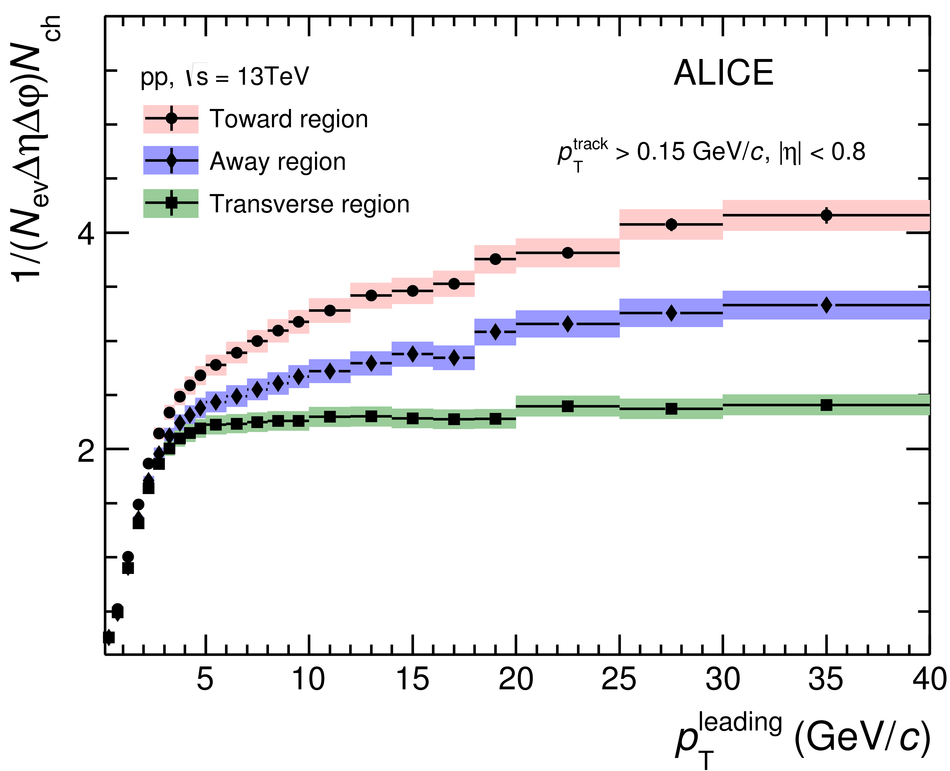
Figure 3: Number density Nch (left) and ∑ pT (right) distributions as a function of pTleading in Toward, Transverse, and Away regions for pTtrack > 0.15 GeV/c. The shaded areas represent the systematic uncertainties and vertical error bars indicate statistical uncertainties. |   |