Figure 6: Left: Number density Nch in the Transverse region as a function of pTleading (pTtrack > 0.15 GeV/c threshold) for √s = 0.9, 7 and 13 TeV. A constant function is used to fit the data in the range 5 < pTleading < 10 GeV/c and the results are shown as solid lines. Right: Number densities Nch scaled by the pedestal values obtained from the fit in order to compare the shapes. The open boxes represent the systematic uncertainties and vertical error bars indicate statistical uncertainties. | 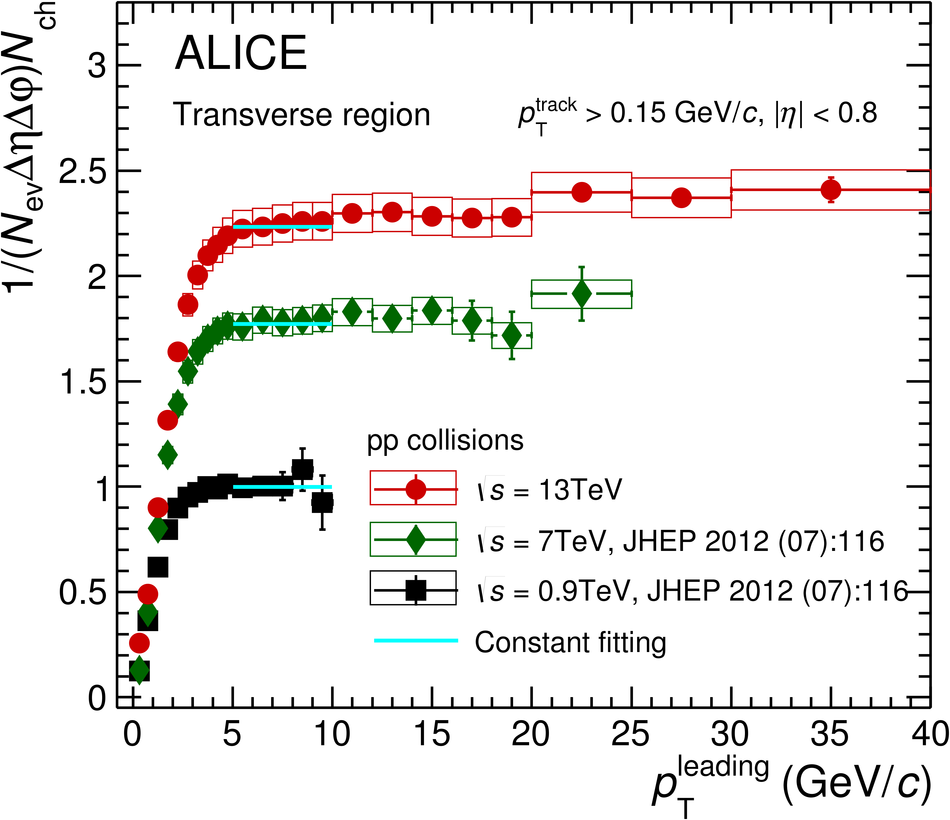 |
![[png]](https://alice-publications.web.cern.ch/sites/default/files/papers/5649/Transverse_SumPt-101104.png)