The first measurement of e$^+$e$^-$ pair production at mid-rapidity ($|\eta_{{\rm e}}|$ $<~$ 0.8) in pp collisions at $\sqrt{s} = 7$ TeV with ALICE at the LHC is presented. The dielectron production is studied as a function of the invariant mass ($m_{\rm ee}$ $<~$ 3.3 GeV/$c^{2}$), the pair transverse momentum ($p_{\rm T,ee}$ $<~$ 8 GeV/$c$), and the pair transverse impact parameter (DCA$_{{\rm ee}}$), i.e., the average distance of closest approach of the reconstructed electron and positron tracks to the collision vertex, normalised to its resolution. The results are compared with the expectations from a cocktail of known hadronic sources and are well described when PYTHIA is used to generate the heavy-flavour contributions. In the low-mass region (0.14 $<~$ $m_{\rm ee}$ $<~$ 1.1 GeV/$c^{2}$), prompt and non-prompt e$^+$e$^-$ sources can be separated via the DCA$_{\rm ee}$. In the intermediate-mass region (1.1 $<~$ $m_{\rm ee}$ $<~$ 2.7 GeV/$c^{2}$), a double-differential fit to the data in $m_{\rm ee}$ and $p_{\rm T,ee}$ and a fit of the DCA$_{\rm ee}$ distribution allow the total ${\rm c\overline c}$ and ${\rm b\overline b}$ cross sections to be extracted. Two different event generators, PYTHIA and POWHEG, can reproduce the shape of the two-dimensional $m_{\rm ee}$ and $p_{\rm T,ee}$ spectra, as well as the shape of the DCA$_{\rm ee}$ distribution, reasonably well. However, differences in the ${\rm c\overline c}$ and ${\rm b\overline b}$ cross sections are observed when using the generators to extrapolate to full phase space. Finally, the ratio of inclusive to decay photons is studied via the measurement of virtual direct photons in the transverse-momentum range 1 $<~$ $p_{\rm T}$ $<~$ 8 GeV/$c$. This is found to be unity within the statistical and systematic uncertainties and consistent with expectations from next-to-leading order perturbative quantum chromodynamic calculations.
JHEP 1809 (2018) 064
HEP Data
e-Print: arXiv:1805.04391 | PDF | inSPIRE
Figure 1
TPC PID signal expressed as \sTPCe (see text) as a function of the ITS PID signal ($n^{\rm ITS}_{\sigma_{{\rm{e}}}}$) for selected tracks with 0.5 $< $ $p$ $< $ 0.52 \GeVoverc after applying the pion rejection in the TPC (left). Electron purity $P_{\rm e}$ as a function of momentum (right). Only statistical uncertainties are shown. | 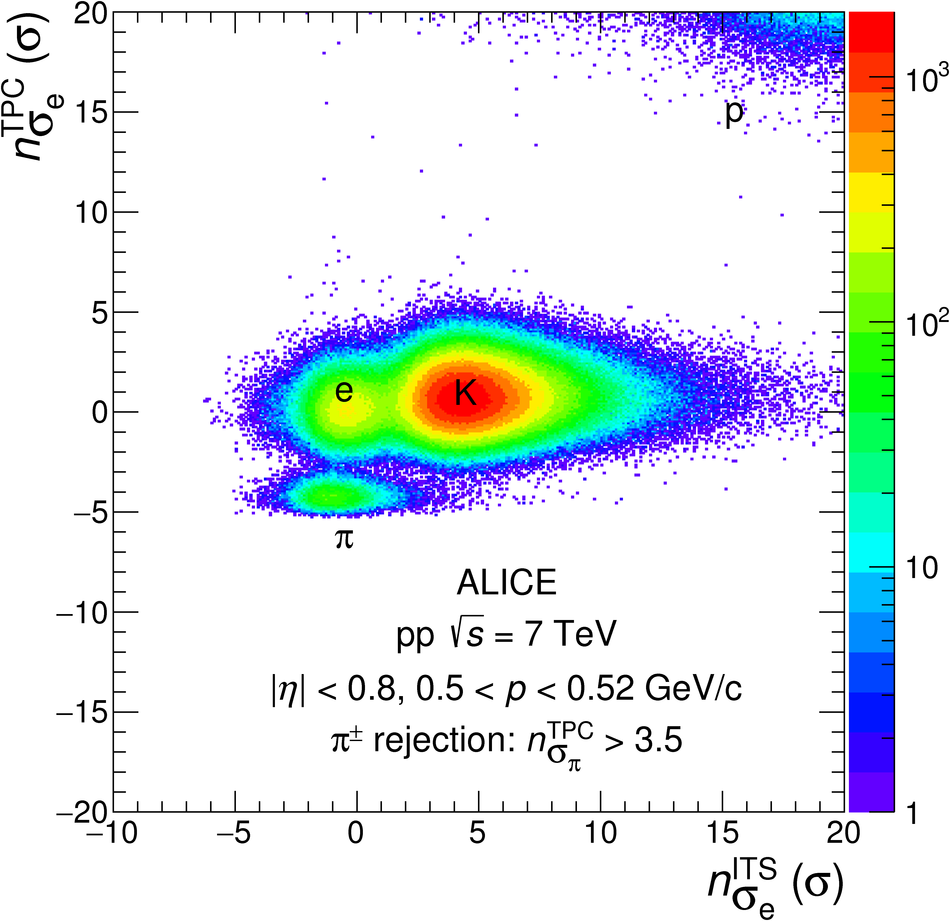  |


Figure 4
Measured $\varphi_{\rm{v}}$ distribution of correlated e$^{+}$e$^{-}$ pairs with \mee $< $ 0.1 GeV/$c^2$ and \ptee $< $ 8 GeV/$c$ compared with a sum of MC templates for different dielectron sources. The distributions are shown for all tracks including those that share some ITS clusters with other tracks (left) and with such tracks removed (right), as in the analysis. Only statistical uncertainties are shown for the data points. | 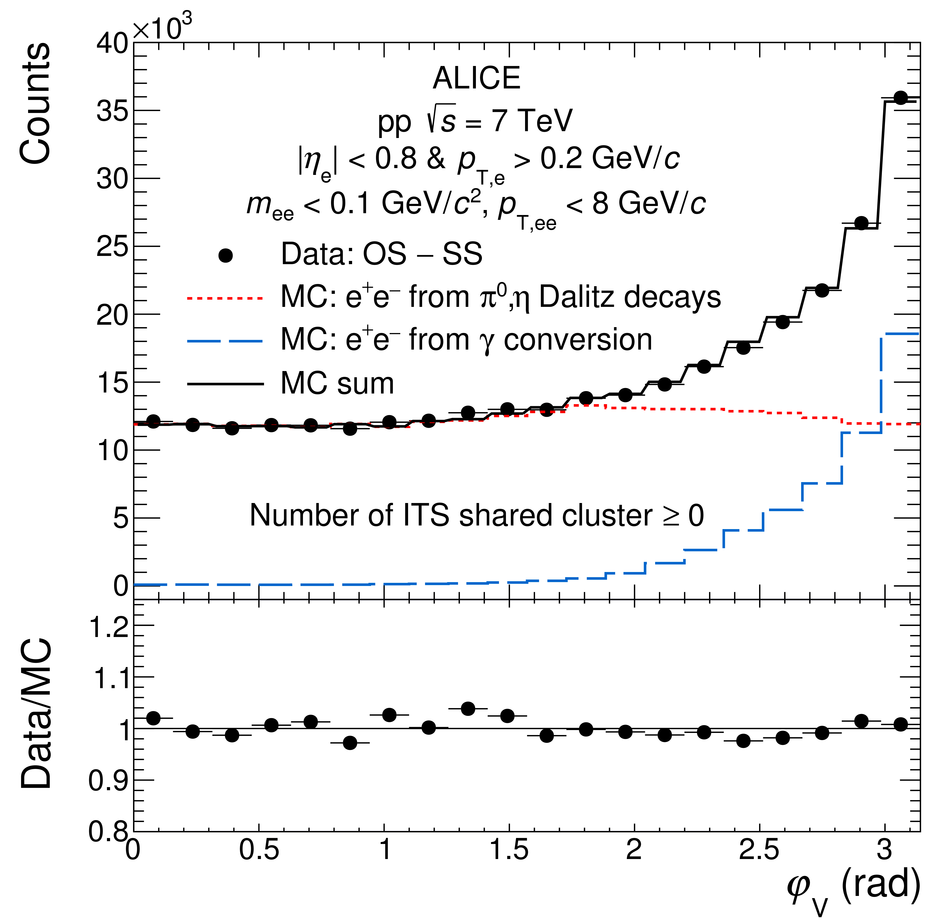 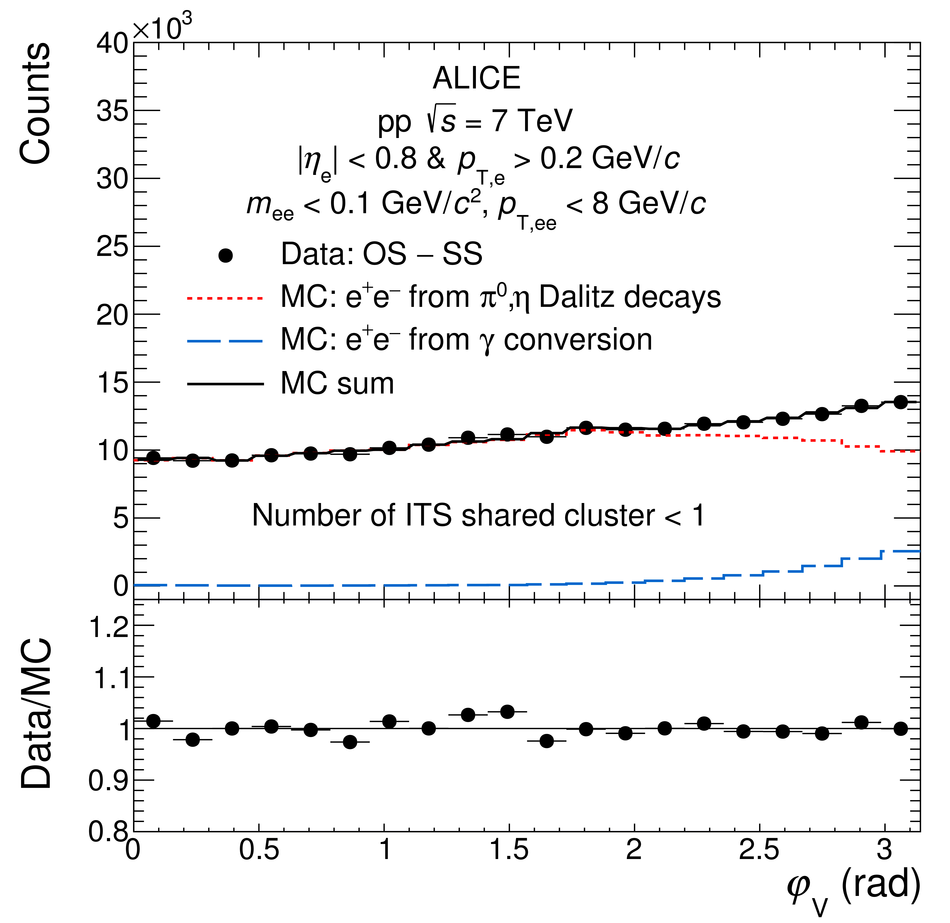 |
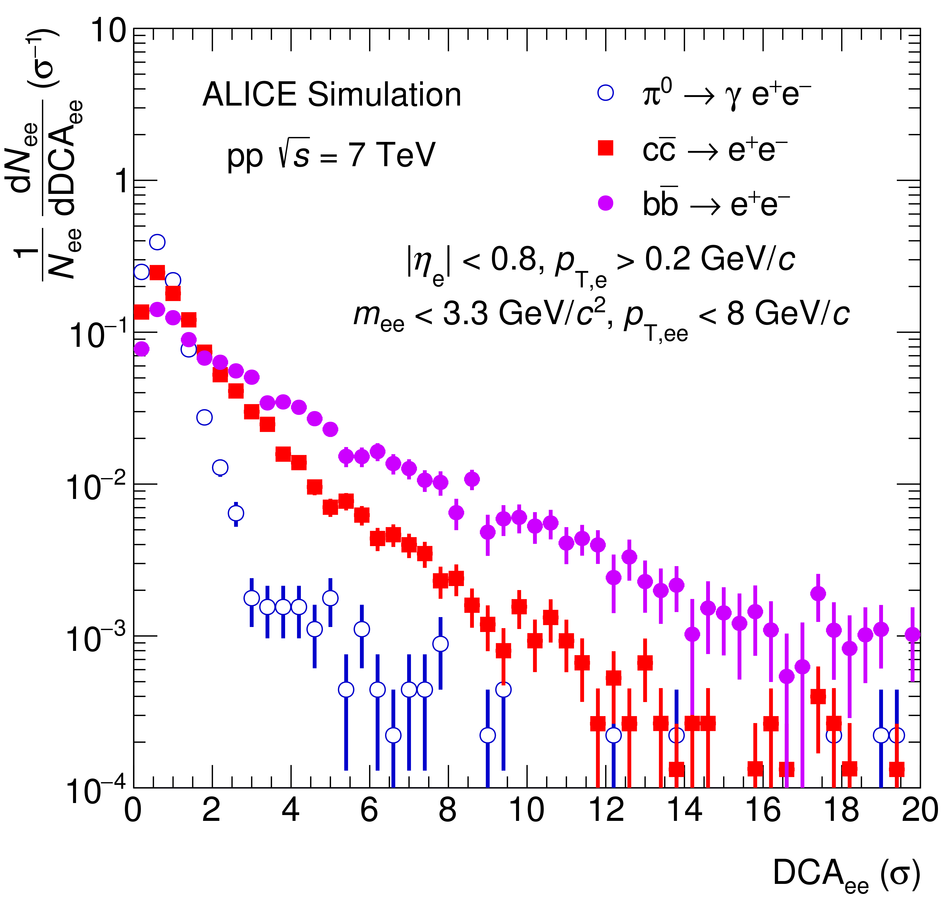
Figure 9
Inclusive \ee cross section in \pp collisions at \roots = 7\,TeV in the ALICE acceptance as a function of mass. The data are compared with a cocktail of expected sources. In the lower panel, the ratio of data to cocktail is shown. Statistical and systematic uncertainties of the data are plotted as vertical bars and boxes, respectively. The total uncertainty of the cocktail is represented as a grey band. | 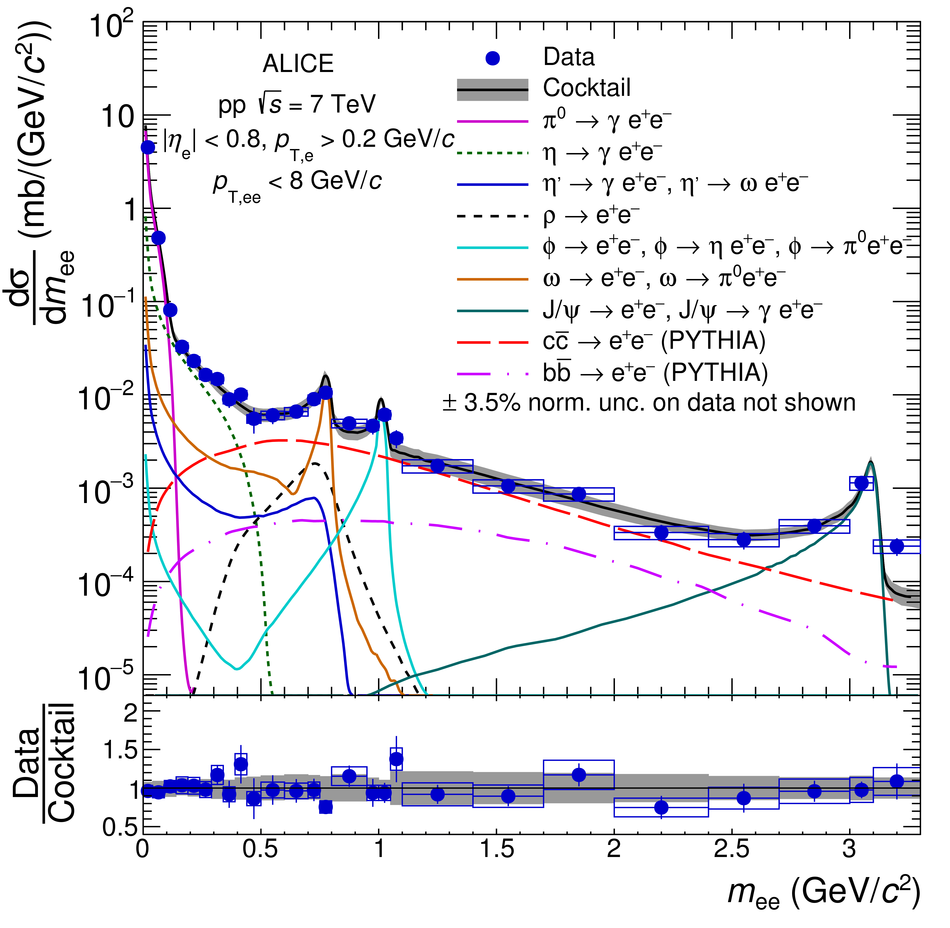 |
Figure 10
Inclusive \ee cross section in \pp collisions at \roots = 7\,TeV in the ALICE acceptance as a function of \ptee (left) and \dcaee (right) for \mee $< $ 0.14 \GeVovercs and 0.08 $< $ \mee $< $ 0.14 GeV/$c^{2}$, respectively. The data are compared with a cocktail of expected sources. In the bottom panels, the ratio of data to cocktail as a function of \ptee (left) and the pull distribution as a function of \dcaee (right) are shown. Statistical and systematic uncertainties on the data are plotted as vertical bars and boxes, respectively. The total uncertainty of the cocktail is represented as a grey band. |  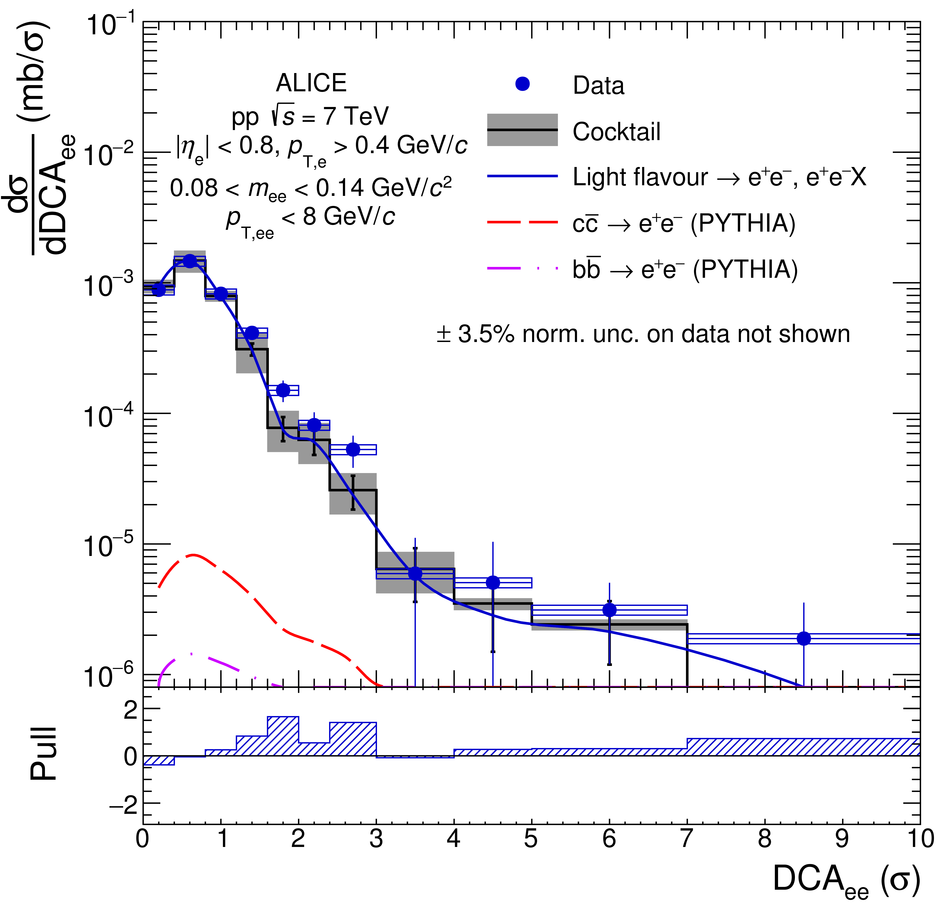 |
Figure 11
Inclusive \ee cross section in \pp collisions at \roots = 7\,TeV in the ALICE acceptance as a function of \ptee in the mass range 0.14 $< $ \mee $< $ 0.7 \GeVovercs (left) and 0.7 $< $ \mee $< $ 1.1 \GeVovercs (right). The data are compared with the hadronic cocktail. In the bottom panels, the ratios of data to cocktail as a function of \ptee are shown. Statistical and systematic uncertainties on the data are plotted as vertical bars and boxes, respectively. The total uncertainty of the cocktail is represented as a grey band. | 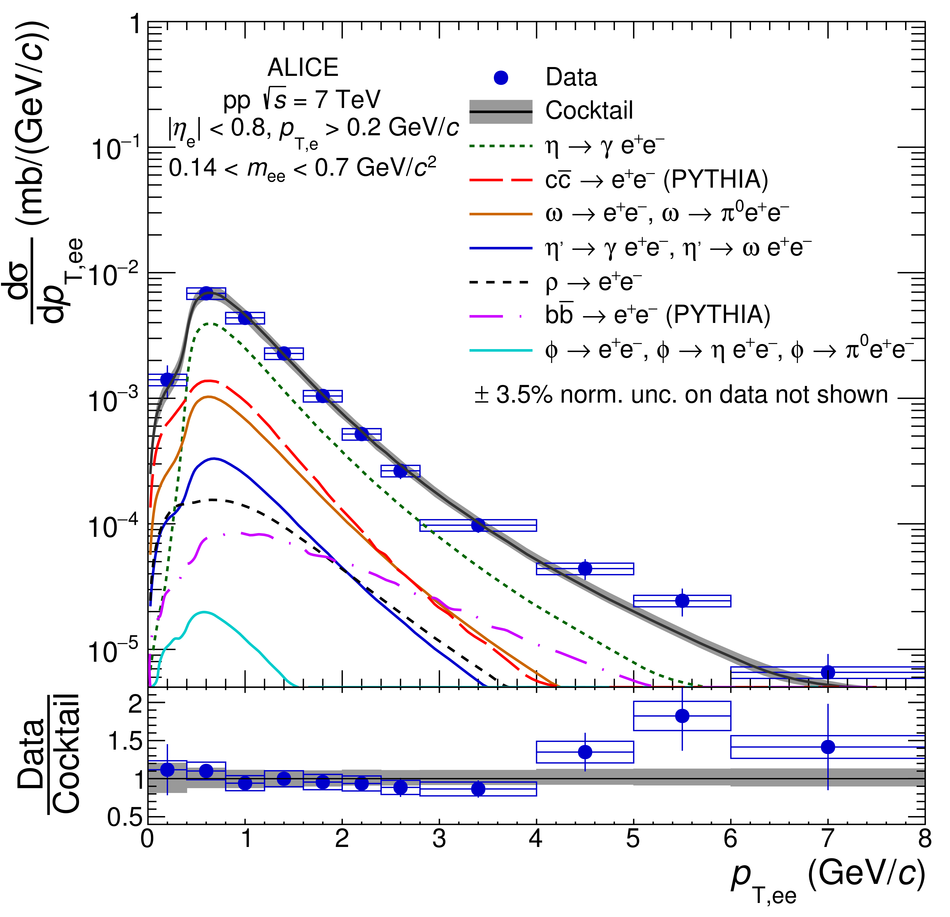 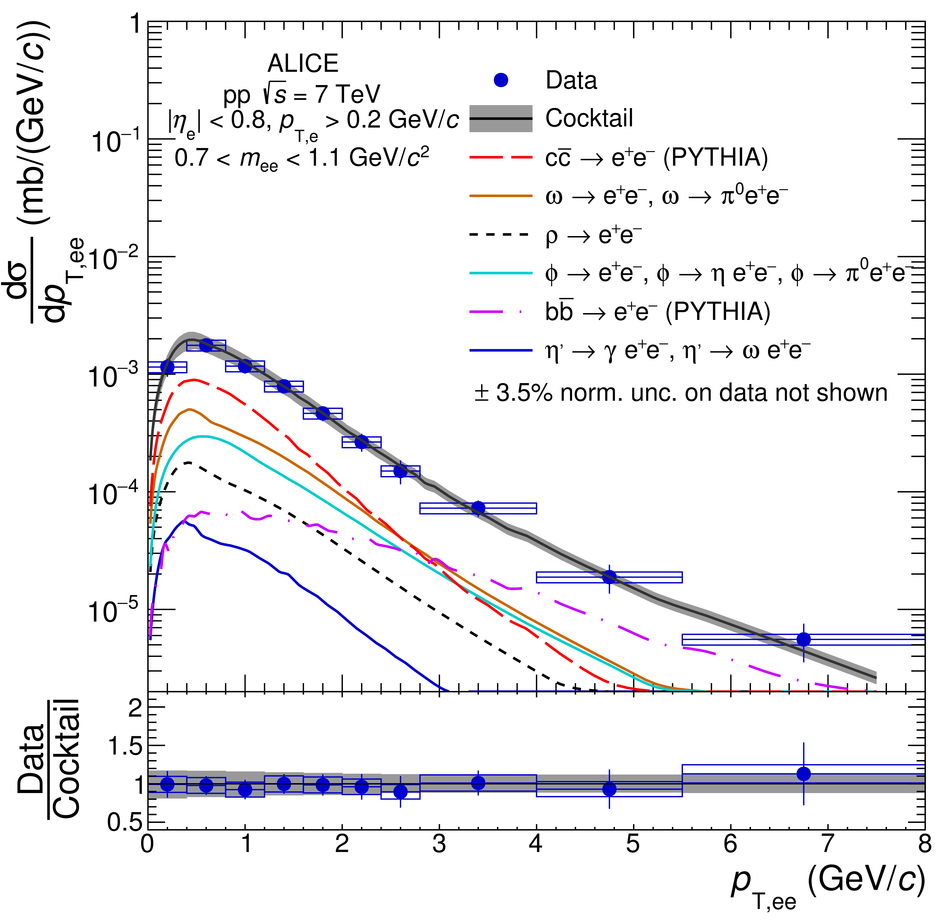 |
Figure 12
Inclusive \ee cross section in \pp collisions at \roots = 7\,TeV in the ALICE acceptance as a function of \dcaee in the mass range 0.14 $< $ \mee $< $ 1.1 GeV/$c^{2}$. The data are compared with a cocktail of expected sources. In the bottom panel, the pull distribution is shown. Statistical and systematic uncertainties on the data are plotted as vertical bars and boxes, respectively. The total uncertainty of the cocktail is represented as a grey band. | 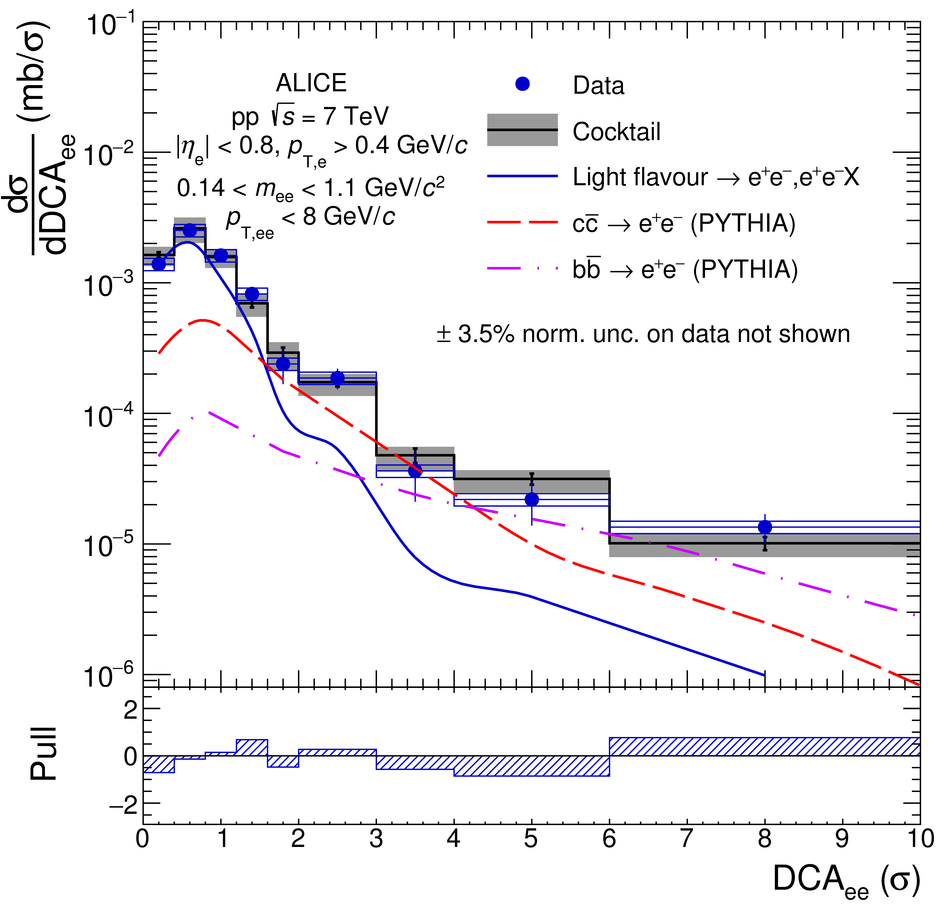 |
Figure 13
Inclusive \ee cross section in \pp collisions at \roots = 7\,TeV in the ALICE acceptance as a function of \ptee in the mass range 1.1 $< $ \mee $< $ 2.7 GeV/$c^{2}$. The data are compared with the hadronic cocktail, where PYTHIA (left) and POWHEG (right) are used to calculate the \ccbar and \bbbar contributions. In the bottom panels, the corresponding ratios of data to cocktail as a function of \ptee are shown. Statistical and systematic uncertainties on the data are plotted as vertical bars and boxes, respectively. The total uncertainty of the cocktails is represented as a grey band. | 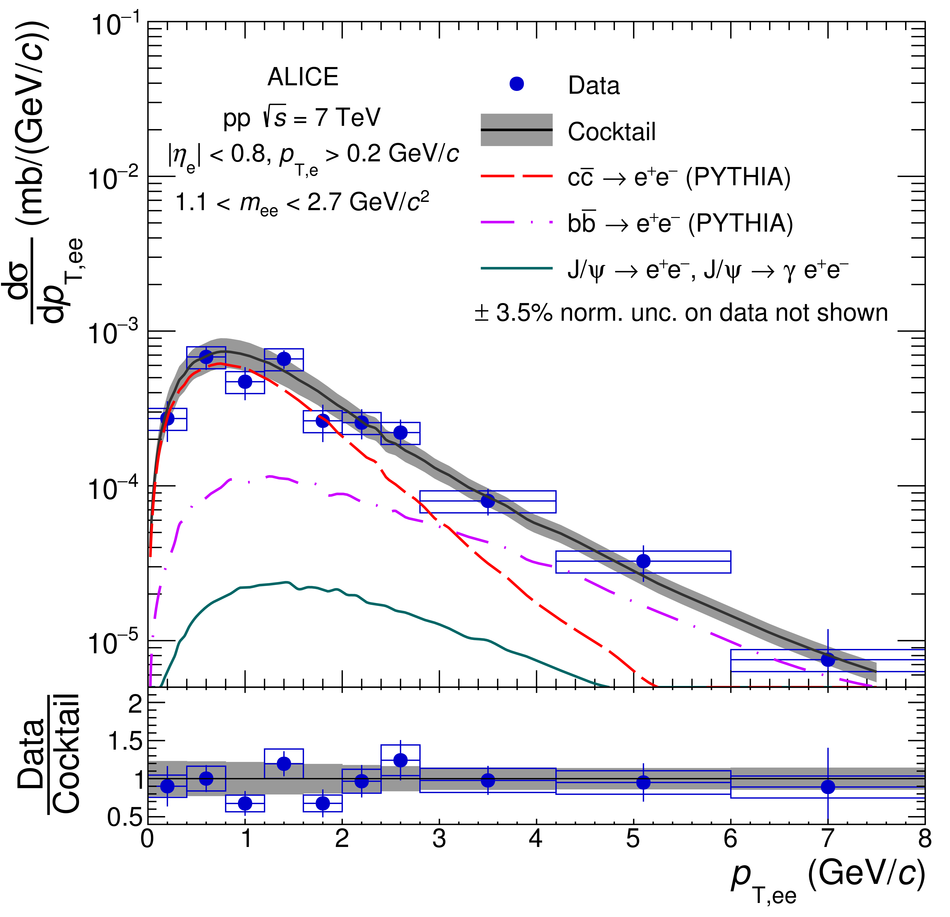 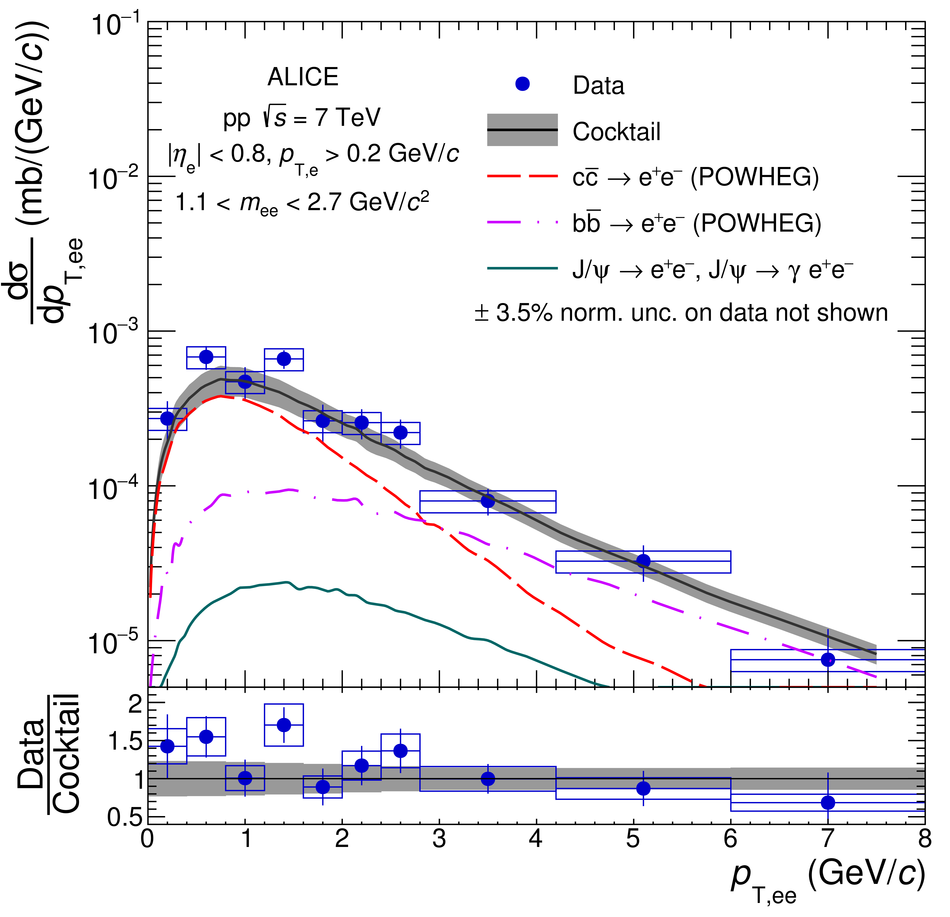 |
Figure 14
Inclusive \ee cross section in \pp collisions at \roots = 7\,TeV in the ALICE acceptance as a function of \dcaee in the mass range 1.1 $< $ \mee $< $ 2.7 GeV/$c^{2}$. The data are compared with a cocktail of expected sources. In the bottom panel, the pull distribution is shown. Statistical and systematic uncertainties on the data are plotted as vertical bars and boxes, respectively. The total uncertainty of the cocktail is represented as a grey band. | 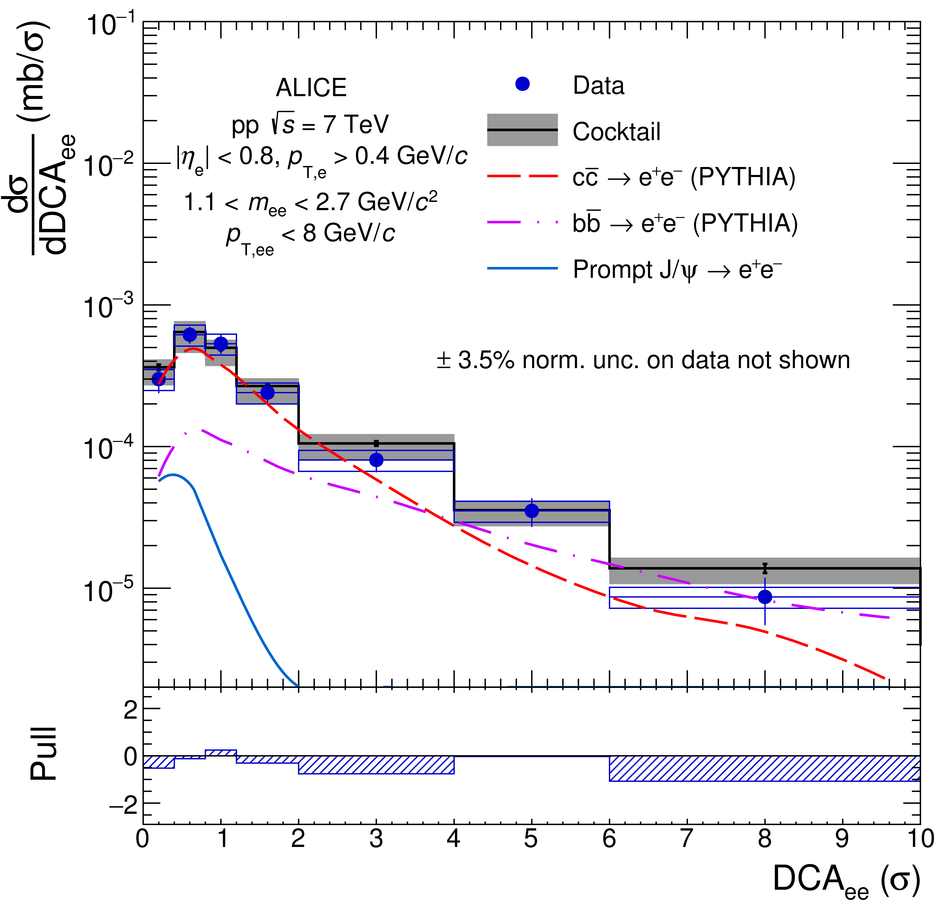 |
Figure 15
Total \ccbar and \bbbar cross sections extracted from a fit of the measured dielectron yield from heavy-flavour hadron decays in \mbox{( $m_{{\rm ee}}$, $p_{{\rm T,ee}}$)} and in \dcaee with PYTHIA (left) and POWHEG (right). The results and their uncertainties (see text) are compared to published cross sections, for which the total uncertainty is represented by dashed lines. |  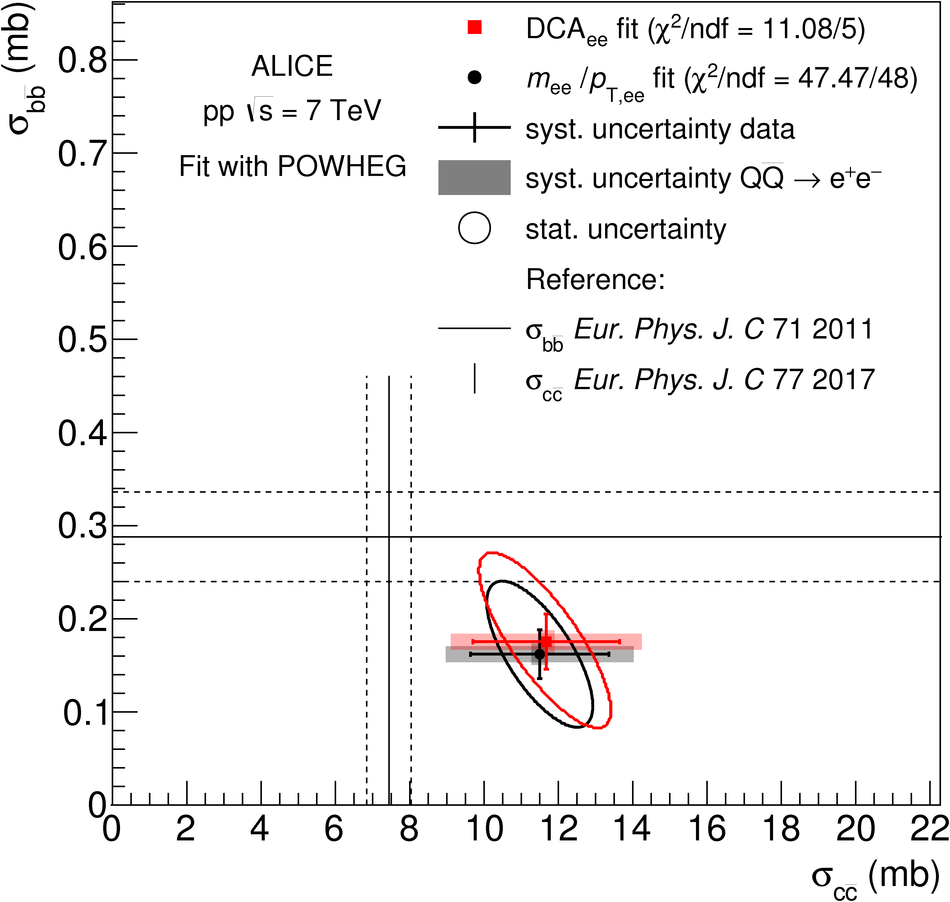 |
Figure 16
Inclusive \ee cross section in \pp collisions at \roots = 7\,TeV in the ALICE acceptance as a function of \ptee (left panel) and \dcaee (right panel) in the mass range 2.7 $< $ \mee $< $ 3.3 GeV/$c^{2}$. The data are compared with a cocktail of expected sources. In the bottom panels, the ratio of data to cocktail as a function of \ptee (left) and the pull distribution as a function of \dcaee (right) are shown. Statistical and systematic uncertainties on the data are plotted as vertical bars and boxes, respectively. The total uncertainty of the cocktail is represented as a grey band. | 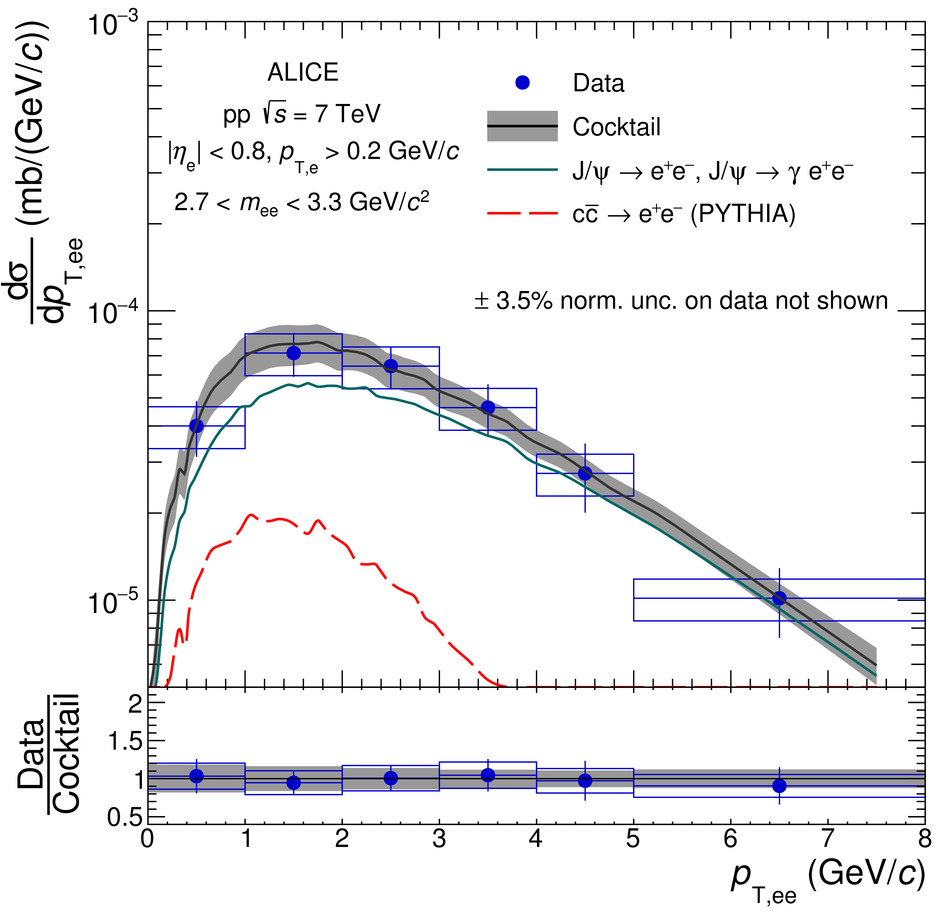 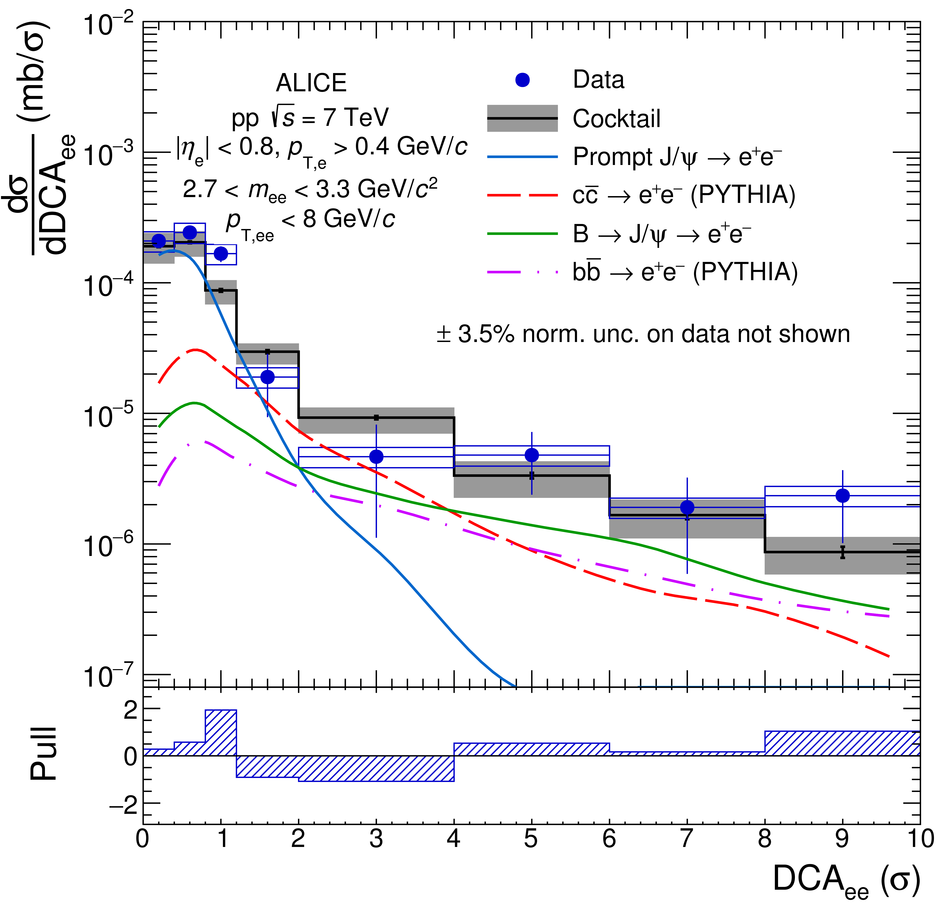 |
Figure 17
Fit of the \ee cross section in \pp collisions at \roots = 7\,TeV in the ALICE acceptance as a function of \mee in the range 3 $< $ \ptee $< $ 4 \GeVoverc with the three-component function defined by Eq. \eqref{fitfunction}. Statistical and systematic uncertainties on the data are shown separately as vertical bars and boxes, respectively. | 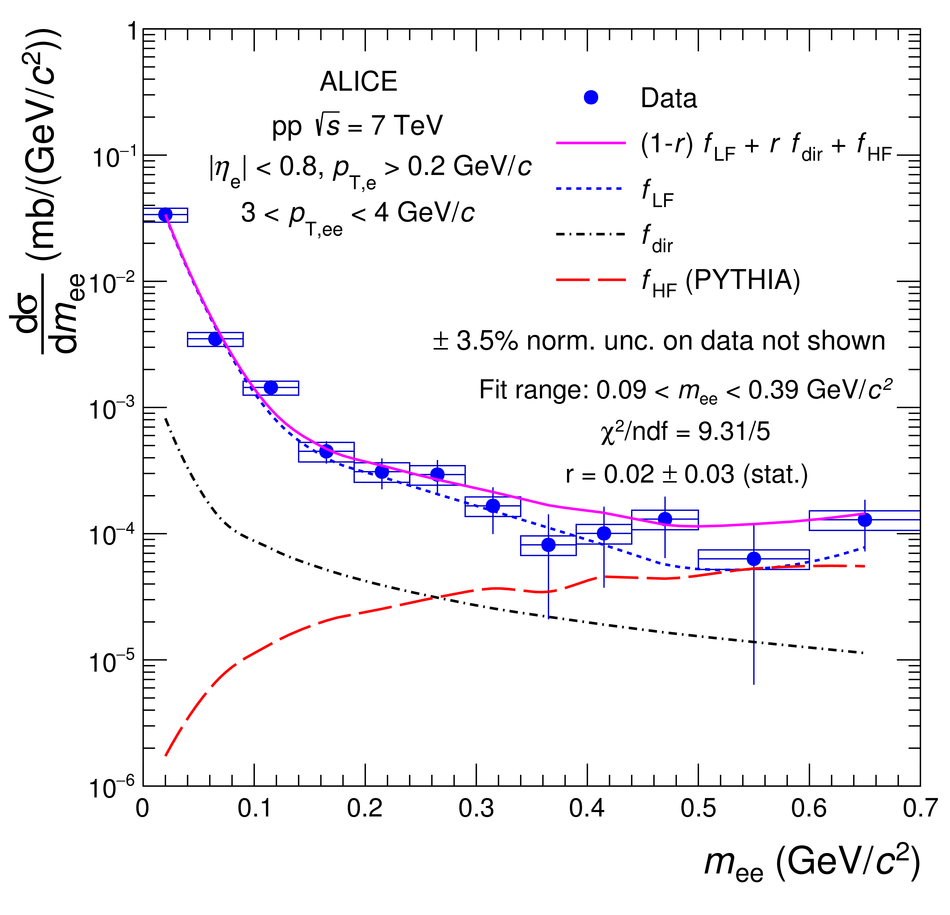 |
Figure 18
Ratio of inclusive to decay photon cross sections extracted from the dielectron spectra measured in \pp collisions at \roots = 7\,TeV. The results are compared with NLO pQCD calculations . Statistical and systematic uncertainties are shown as vertical bars and boxes for the data, respectively, and as a band for the NLO pQCD calculations. | 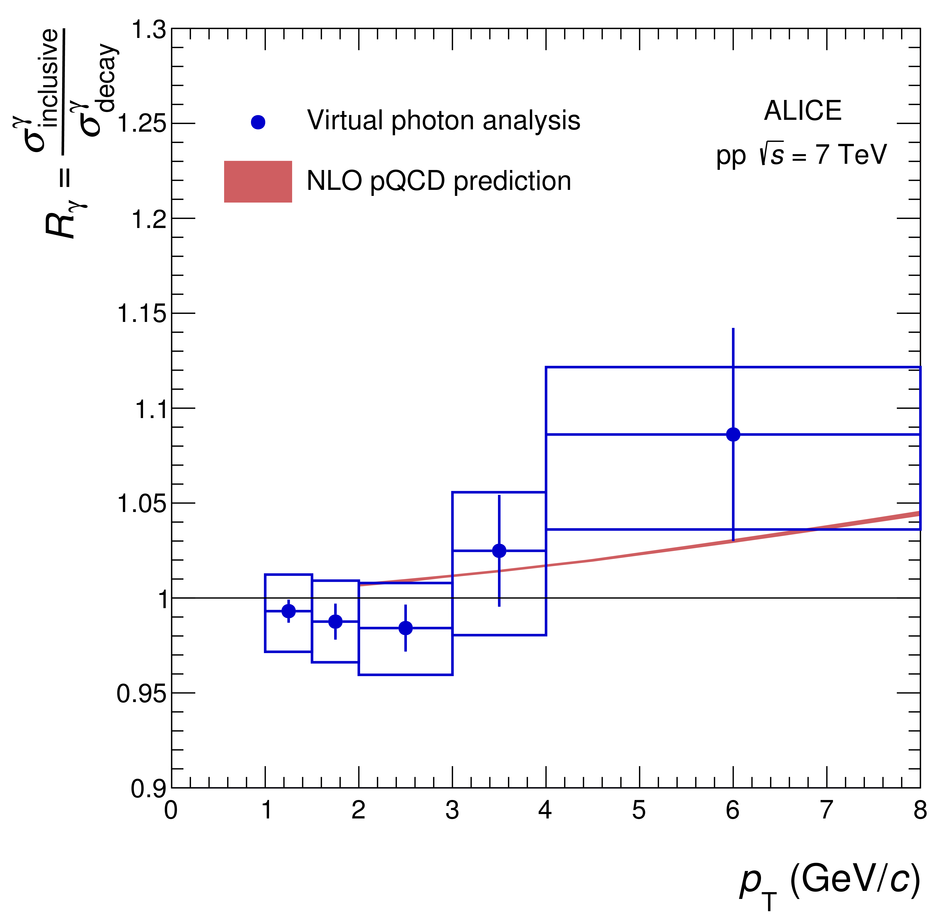 |