Inclusive \ee cross section in \pp collisions at \roots = 7\,TeV in the ALICE acceptance as a function of \ptee (left panel) and \dcaee (right panel) in the mass range 2.7 $< $ \mee $< $ 3.3 GeV/$c^{2}$. The data are compared with a cocktail of expected sources. In the bottom panels, the ratio of data to cocktail as a function of \ptee (left) and the pull distribution as a function of \dcaee (right) are shown. Statistical and systematic uncertainties on the data are plotted as vertical bars and boxes, respectively. The total uncertainty of the cocktail is represented as a grey band. | 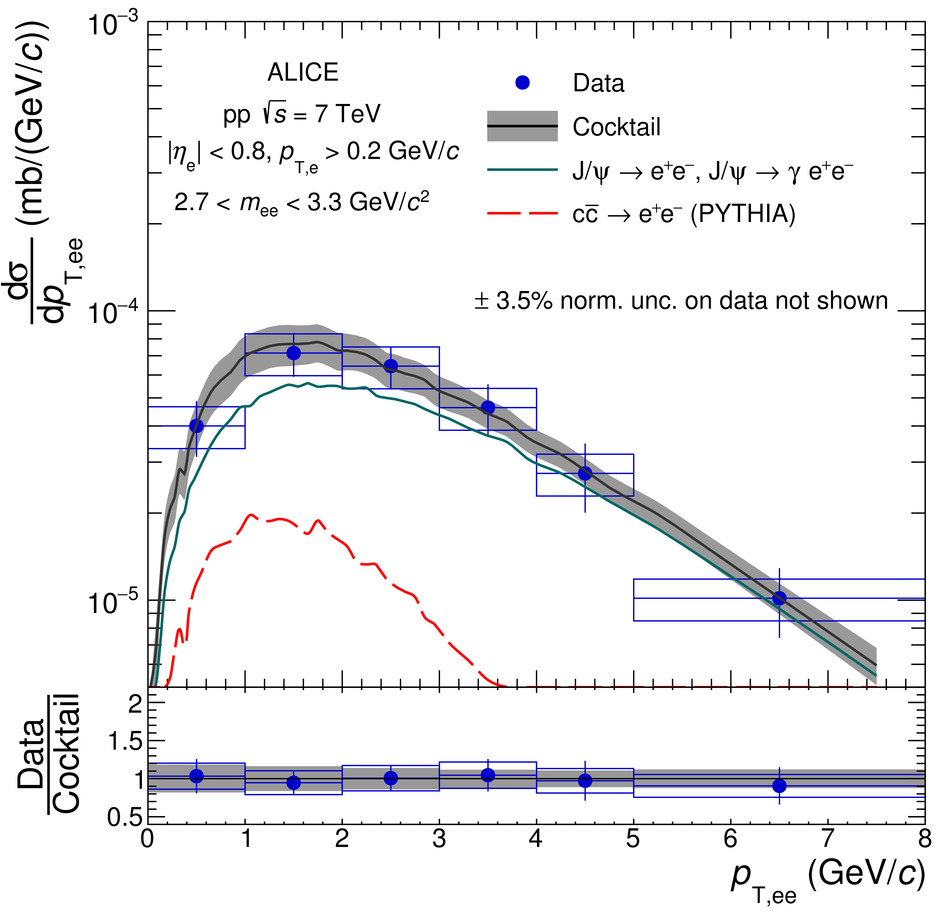 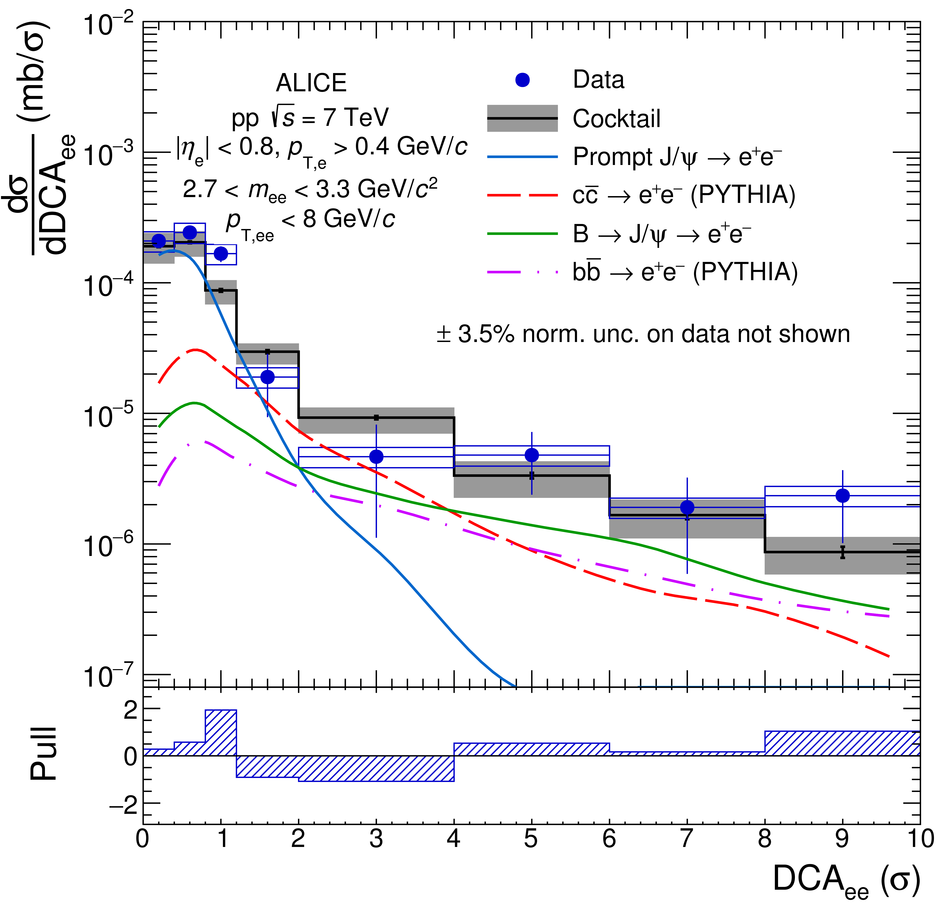 |