The pseudorapidity density of charged particles with minimum transverse momentum ($p_{\rm T}$) thresholds of 0.15, 0.5, 1, and 2 GeV$/c$ is measured in pp collisions at the centre of mass energies of $\sqrt{s} =$ 5.02 and 13 TeV with the ALICE detector. The study is carried out for inelastic collisions with at least one primary charged particle having a pseudorapidity ($\eta$) within $\pm0.8$ and $p_{\rm T}$ larger than the corresponding threshold. In addition, measurements without $p_{\rm T}$-thresholds are performed for inelastic and non-single-diffractive events as well as for inelastic events with at least one charged particle having $|\eta|<~1$ in pp collisions at $\sqrt{s} =$ 5.02 TeV for the first time at the LHC. These measurements are compared to the PYTHIA 6, PYTHIA 8, and EPOS-LHC models. In general, the models describe the $\eta$ dependence of particle production well. However, discrepancies are observed for the highest transverse momentum threshold ($p_{\rm T}>2 {\rm\ GeV}/c$), highlighting the importance of such measurements for tuning event generators. The new measurements agree within uncertainties with results from the ATLAS and CMS experiments obtained at $\sqrt{s} = 13$ TeV.
Phys. Rev. D 108 (2023) 072008
HEP Data
e-Print: arXiv:2211.15364 | PDF | inSPIRE
CERN-EP-2022-262
Figure group
Figure 1
The distributions of $\dndeta$ for INEL (left panel), NSD (middle panel), and $\inelg$ (right panel) event classes in pp collisions at $\sqrt{s} = 5.02$ TeV. Data are compared to simulations obtained with PYTHIA 6 with the Perugia 2011 tuning, PYTHIA 8 with the Monash 2013 tuning, and EPOS-LHC. Grey bands (unfilled rectangles) represent the uncorrelated (correlated) systematic uncertainties from data. The bottom part of the figure shows the ratios between models and data. | 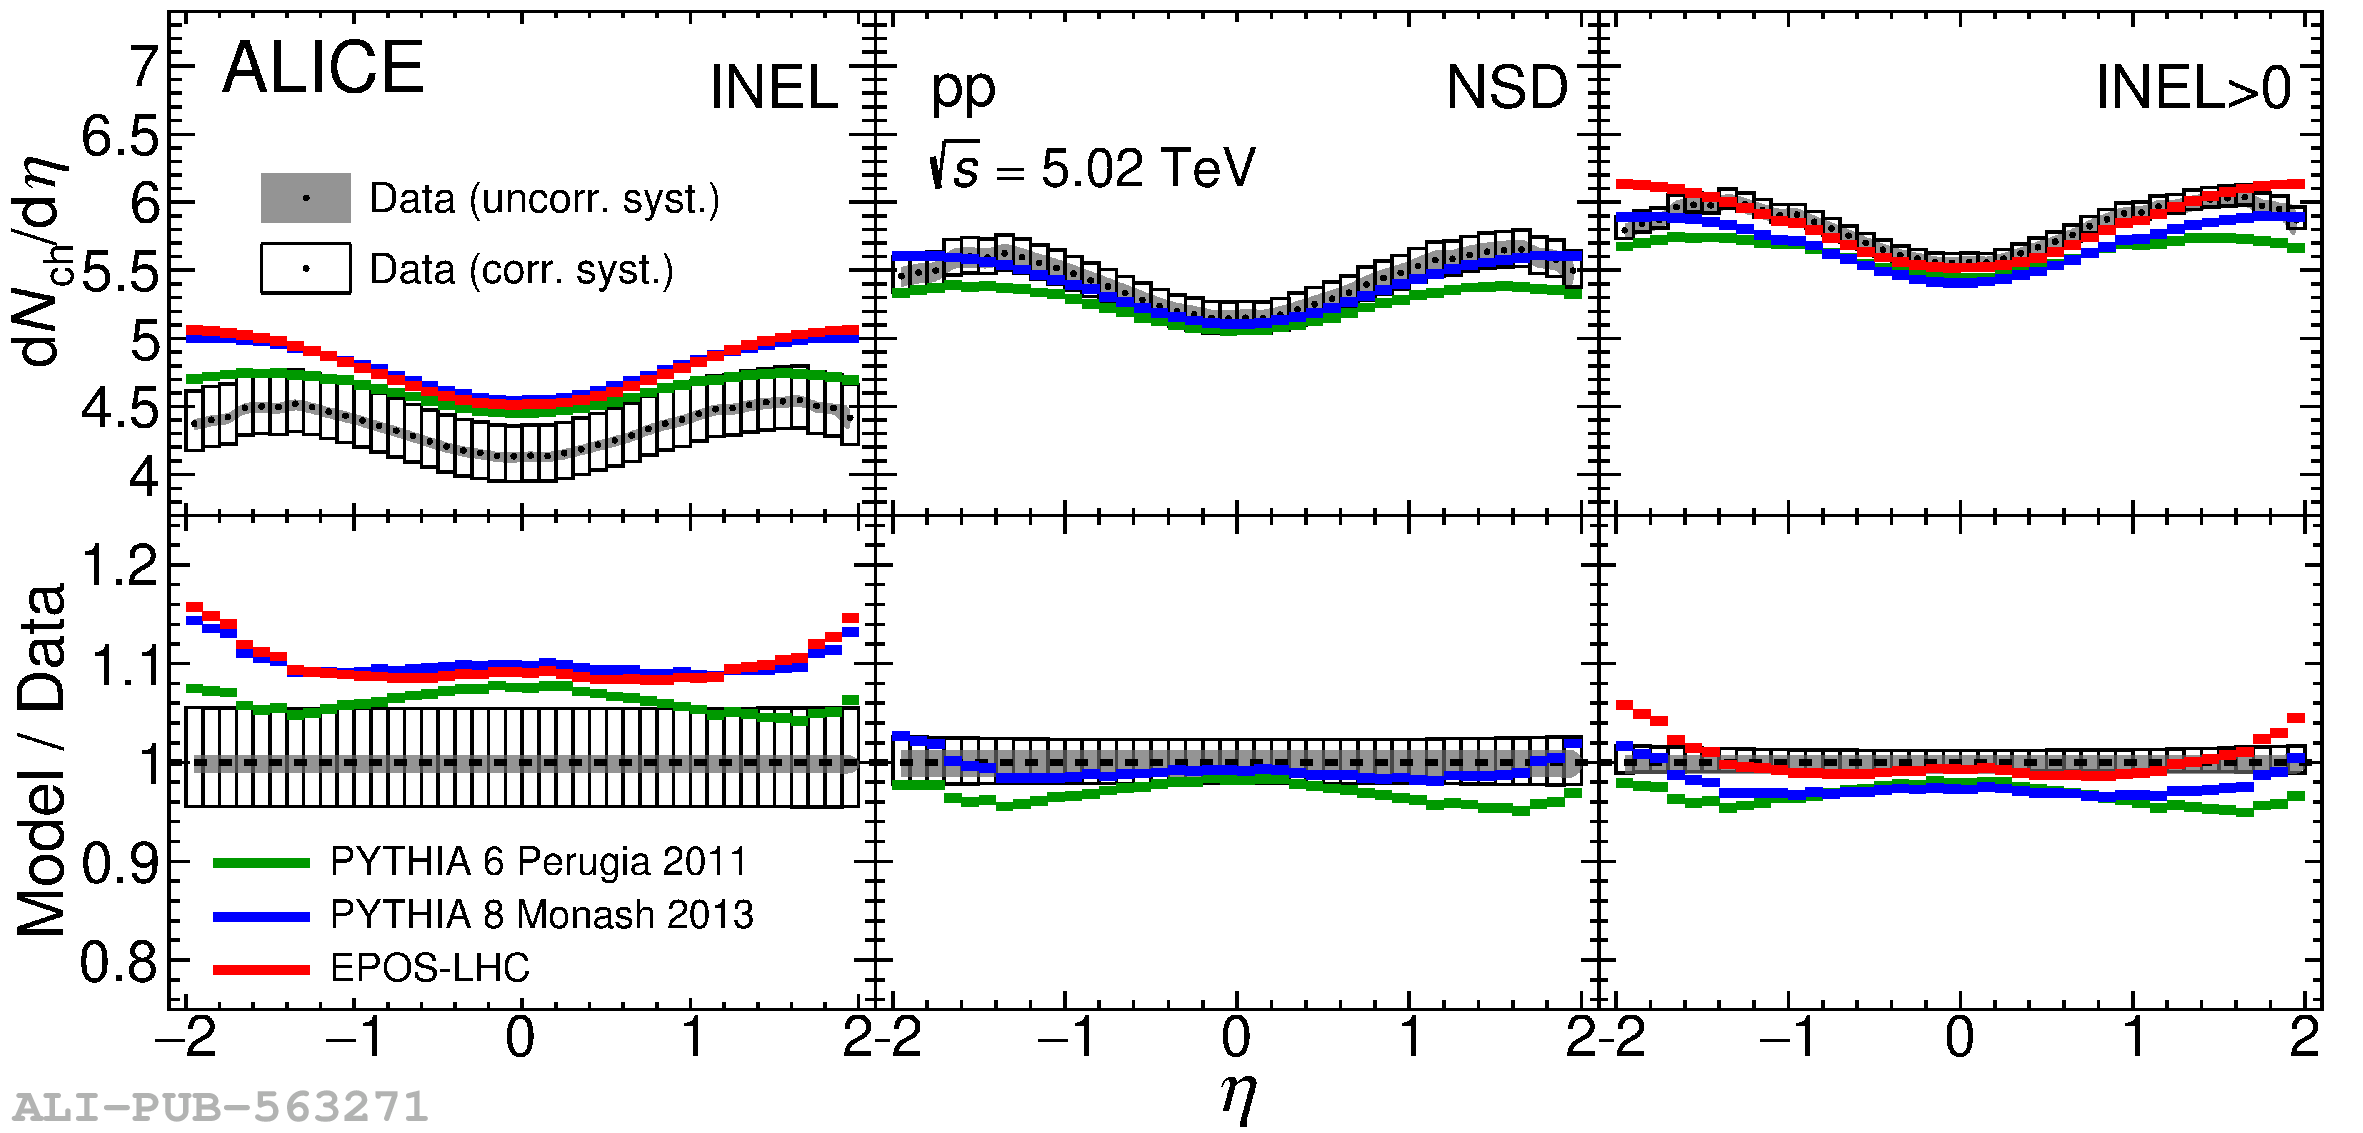 |
Figure 3
Pseudorapidity density distributions of charged particles, $\mathrm{d}N_{\mathrm{ch}}/\mathrm{d}\eta$, in pp collisions at $\sqrt{s} = $ 5.02 TeV for the four event classes, $\inelf$, $\inels$, $\inelt$, and $\inelq$, compared to the distributions from models: PYTHIA 8 Monash 2013 and EPOS-LHC. Grey bands (unfilled rectangles) represent the uncorrelated (correlated) systematic uncertainties from data. | 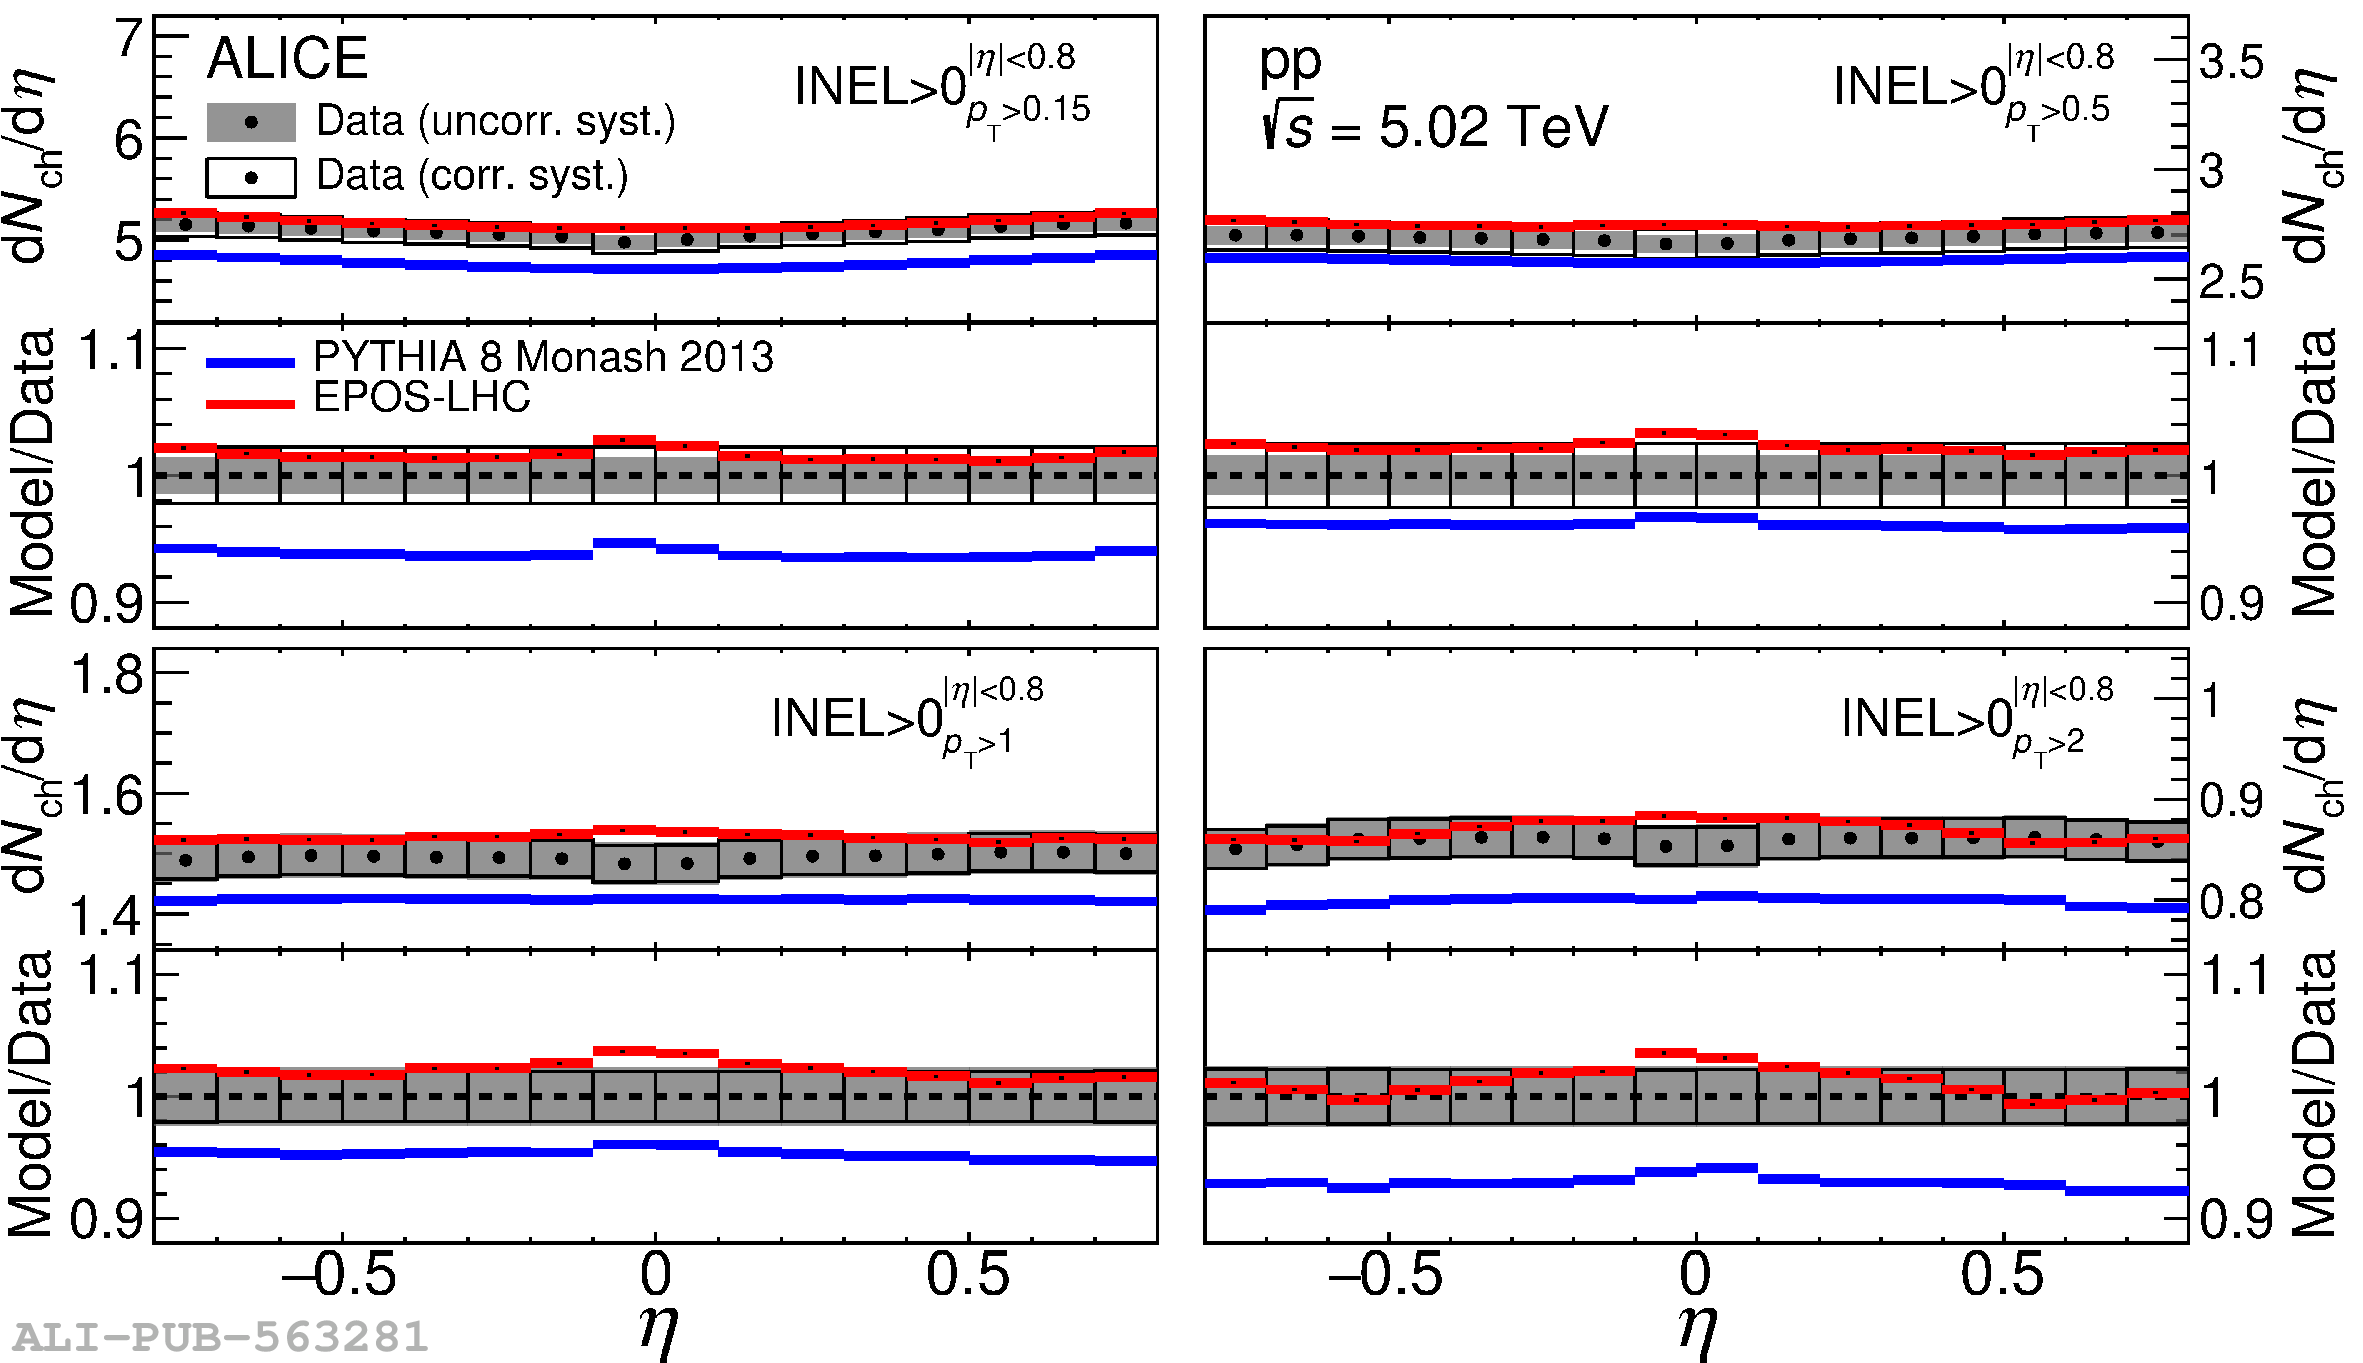 |
Figure 4
Pseudorapidity density distributions of charged particles, $\mathrm{d}N_{\mathrm{ch}}/\mathrm{d}\eta$, in pp collisions at $\sqrt{s}=$ 13 TeV for the four event classes, $\inelf$, $\inels$, $\inelt$, and $\inelq$, compared to the distributions from models: PYTHIA 8 Monash 2013 and EPOS-LHC. Grey bands (unfilled rectangles) represent the uncorrelated (correlated) systematic uncertainties from data. | 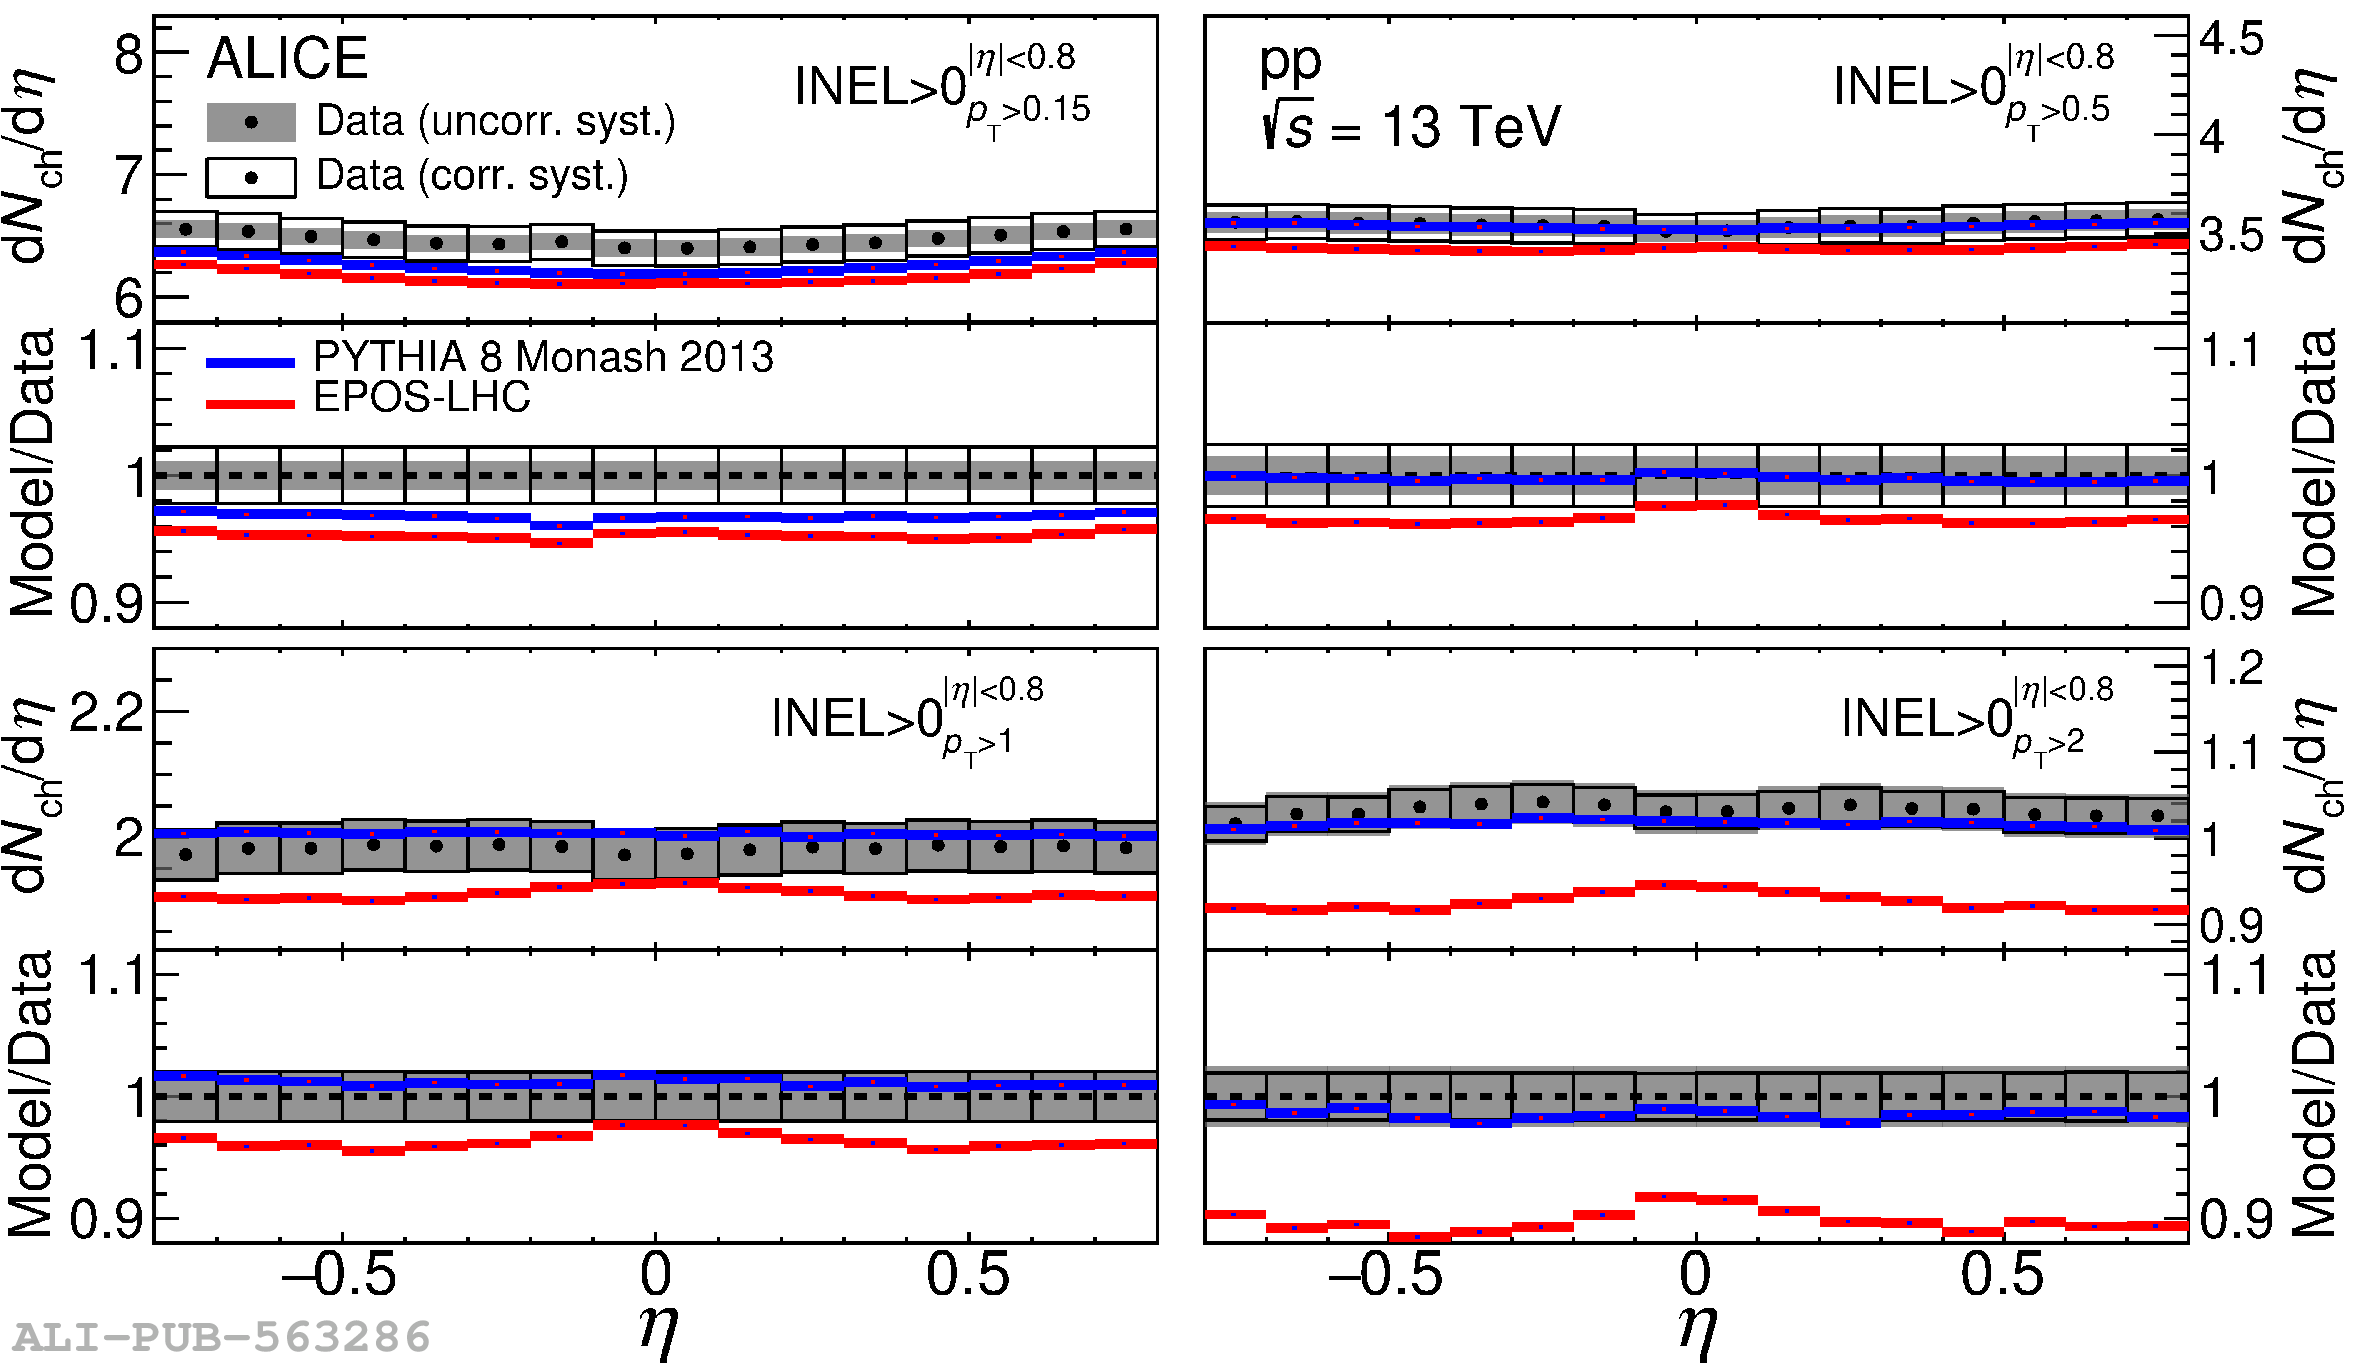 |
Figure 5
The distributions of $\dndeta$ for the $\inels$ event class are normalised to the $\inelsss$ (left) and $\inelss$ (right) event classes using PYTHIA 8 with the Monash 2013 tuning in pp collisions at $\cms = 13$ TeV . The bottom panels show the ratio of $\dndeta$ for the $\inelsss$ (left) and $\inelss$ (right) event class between ALICE and ATLAS (left) and between ALICE and CMS (right), respectively. | 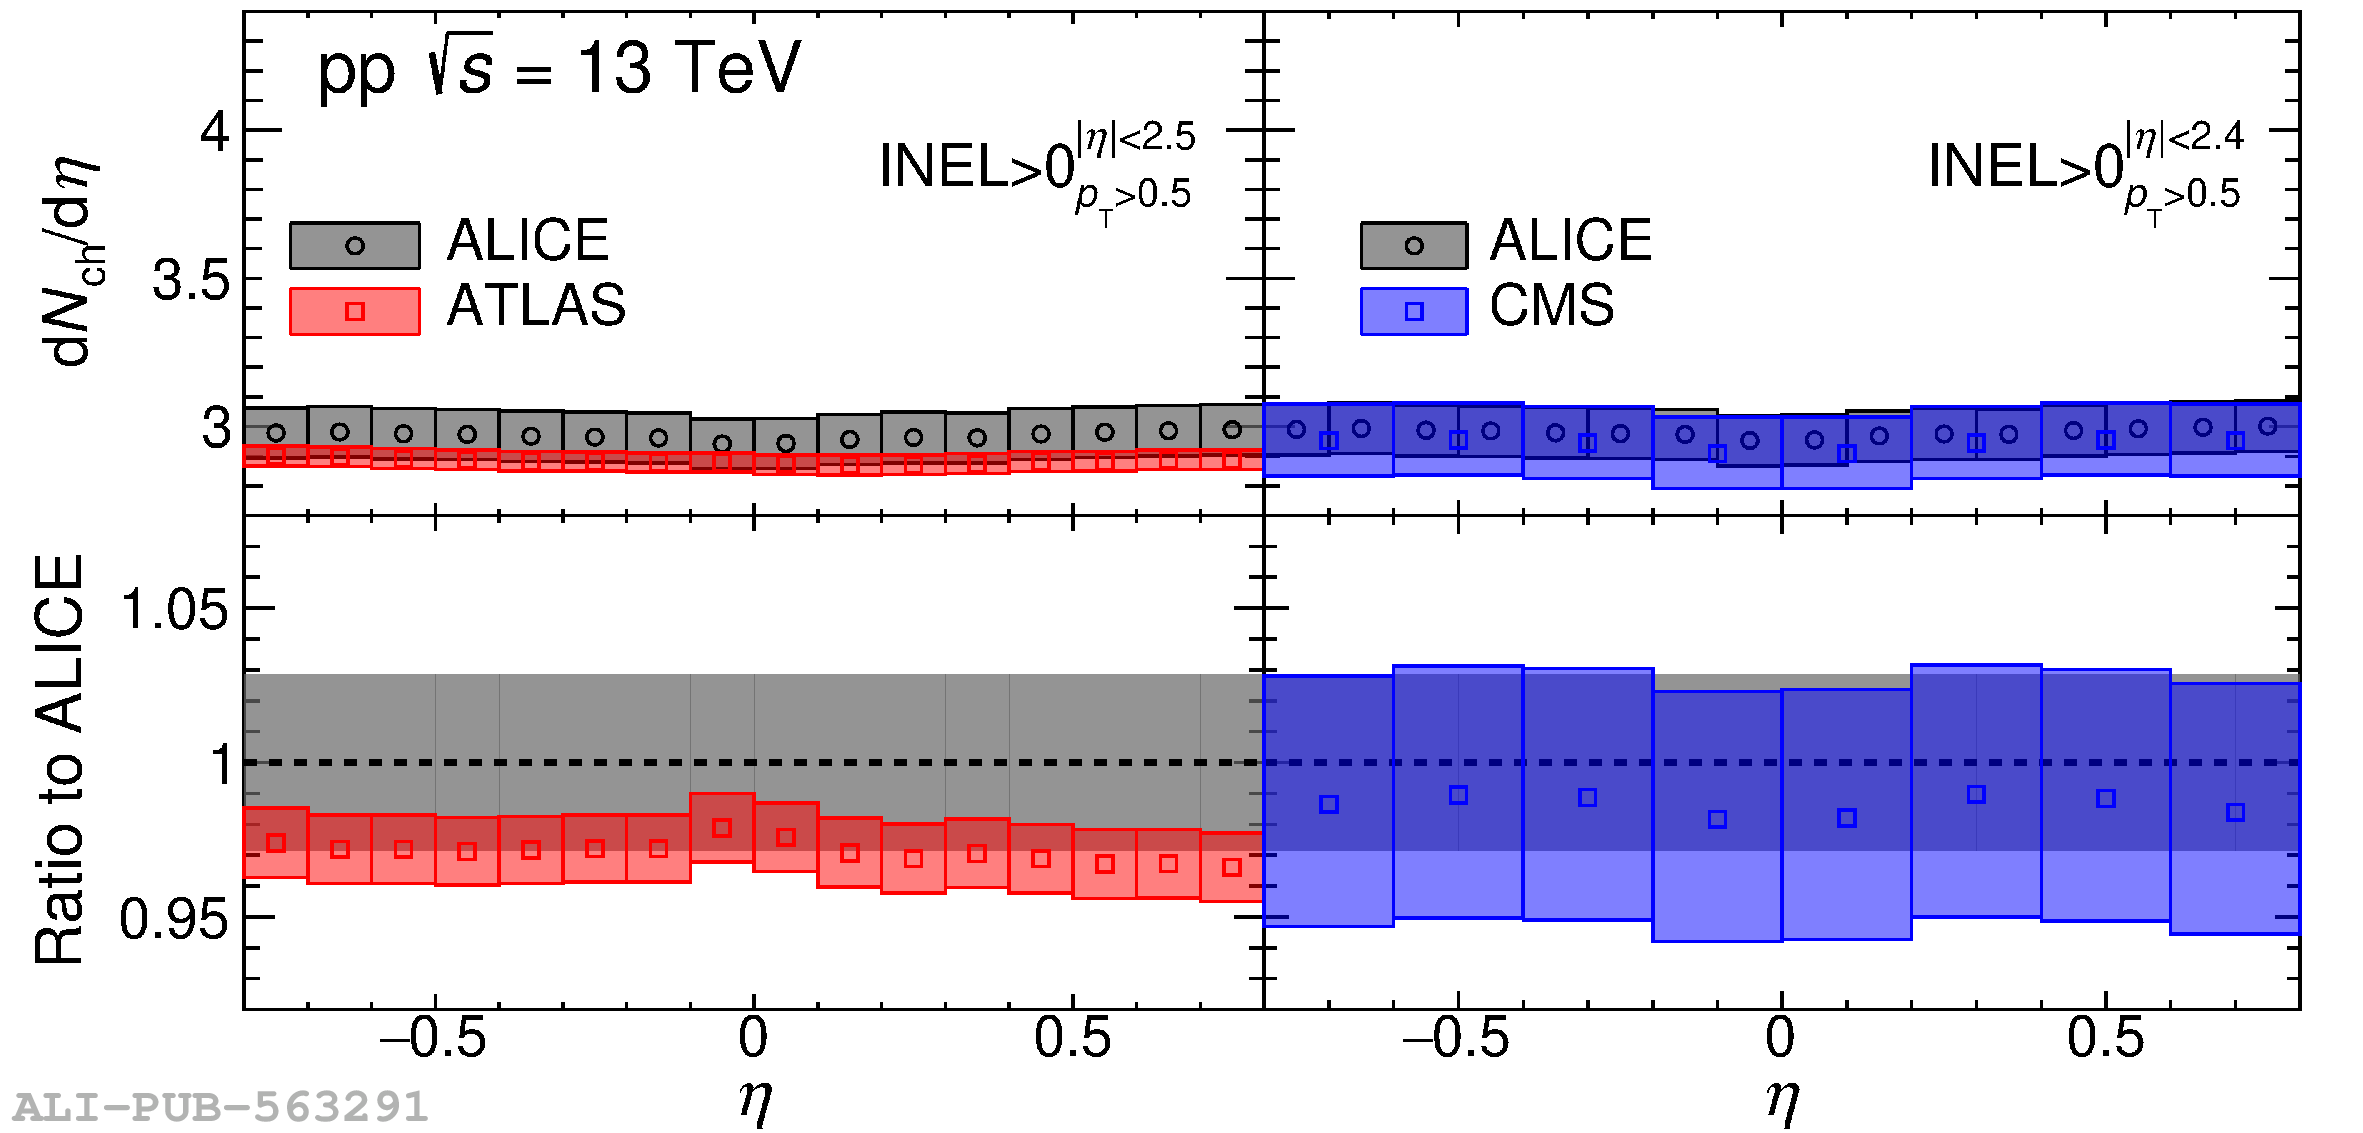 |