The distributions of $\dndeta$ for INEL (left panel), NSD (middle panel), and $\inelg$ (right panel) event classes in pp collisions at $\sqrt{s} = 5.02$ TeV. Data are compared to simulations obtained with PYTHIA 6 with the Perugia 2011 tuning, PYTHIA 8 with the Monash 2013 tuning, and EPOS-LHC. Grey bands (unfilled rectangles) represent the uncorrelated (correlated) systematic uncertainties from data. The bottom part of the figure shows the ratios between models and data. | 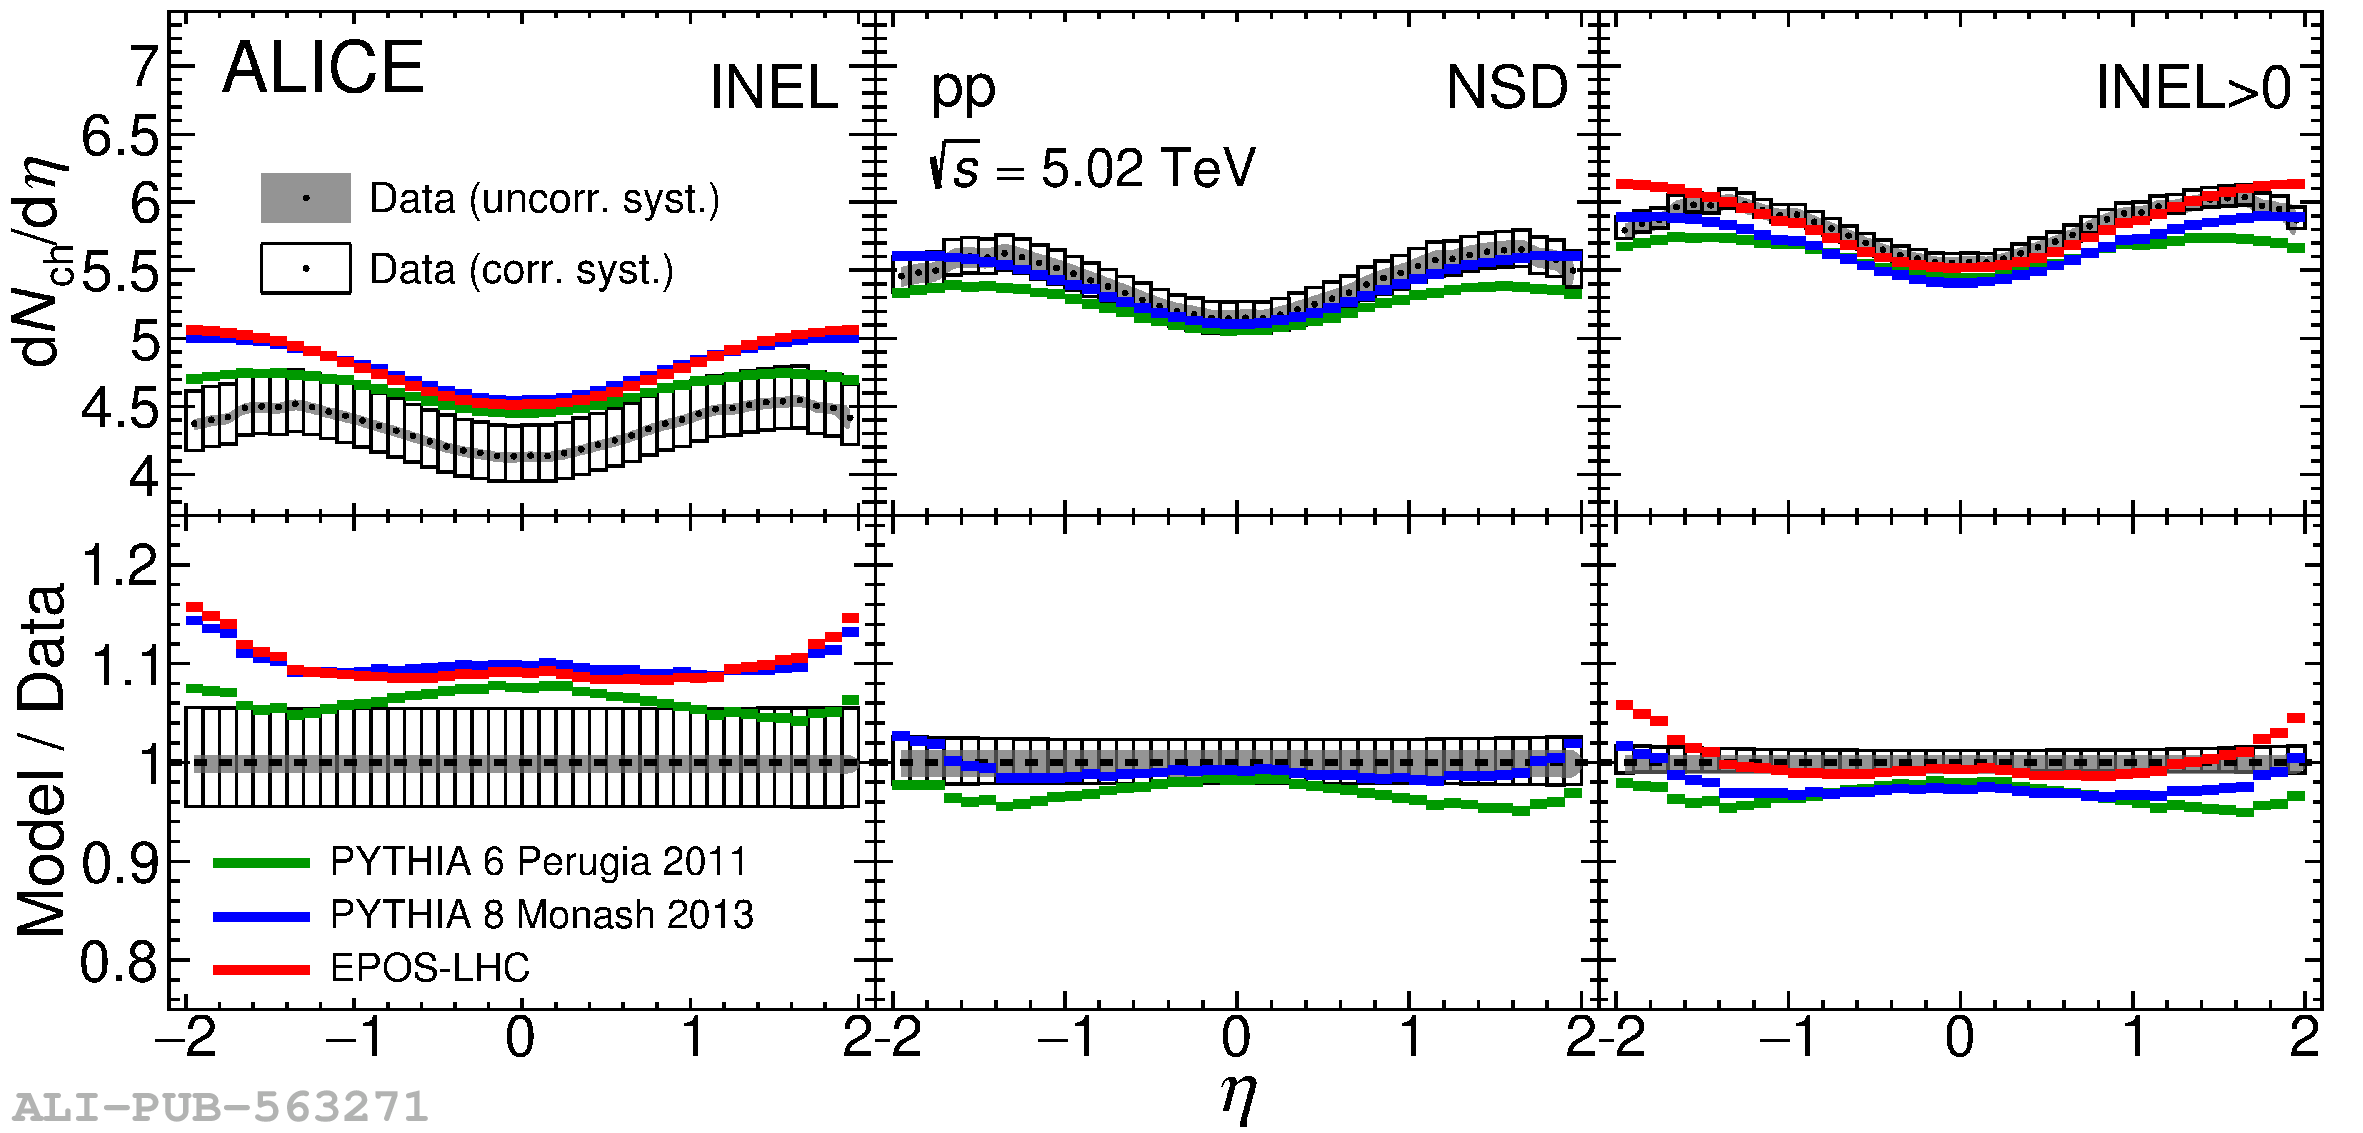 |