Pseudorapidity density distributions of charged particles, $\mathrm{d}N_{\mathrm{ch}}/\mathrm{d}\eta$, in pp collisions at $\sqrt{s} = $ 5.02 TeV for the four event classes, $\inelf$, $\inels$, $\inelt$, and $\inelq$, compared to the distributions from models: PYTHIA 8 Monash 2013 and EPOS-LHC. Grey bands (unfilled rectangles) represent the uncorrelated (correlated) systematic uncertainties from data. | 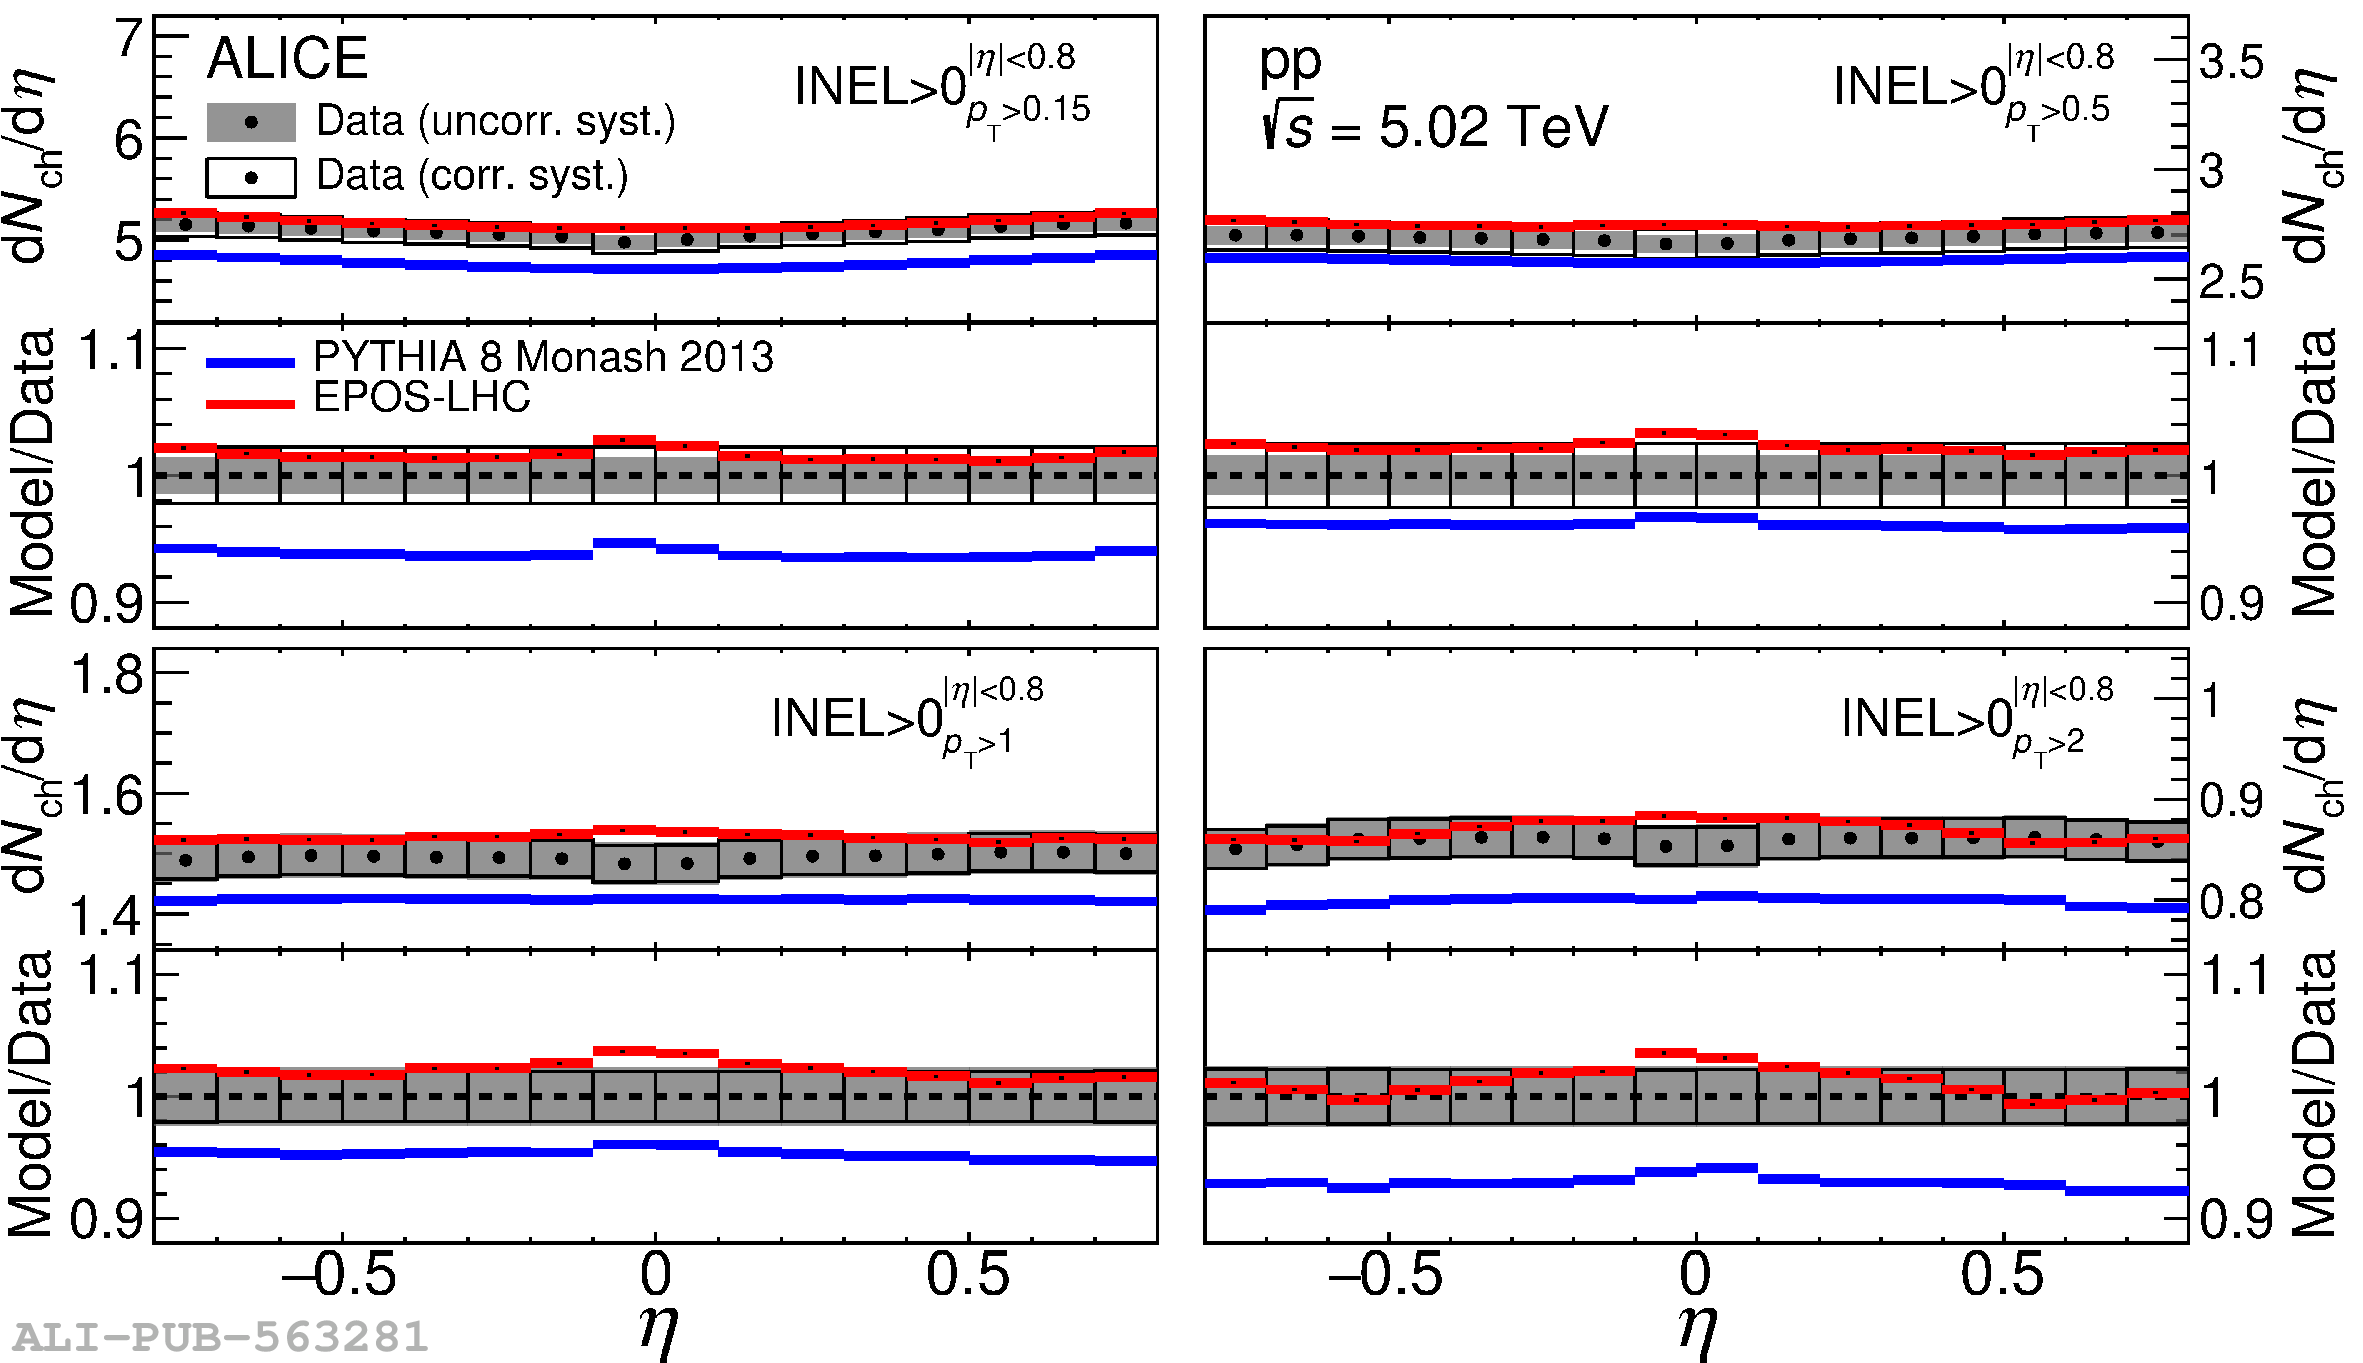 |