The ALICE experiment: a journey through QCD

The ALICE experiment was proposed in 1993, to study strongly-interacting matter at extreme energy densities and temperatures. This proposal entailed a comprehensive investigation of nuclear collisions at the LHC. Its physics programme initially focused on the determination of the properties of the quark-gluon plasma (QGP), a deconfined state of quarks and gluons, created in such collisions. The ALICE physics programme has been extended to cover a broader ensemble of observables related to Quantum Chromodynamics (QCD), the theory of strong interactions. The experiment has studied Pb-Pb, Xe-Xe, p-Pb and pp collisions in the multi-TeV centre of mass energy range, during the Run 1-2 data-taking periods at the LHC (2009-2018). The aim of this review is to summarise the key ALICE physics results in this endeavor, and to discuss their implications on the current understanding of the macroscopic and microscopic properties of strongly-interacting matter at the highest temperatures reached in the laboratory. It will review the latest findings on the properties of the QGP created by heavy-ion collisions at LHC energies, and describe the surprising QGP-like effects in pp and p-Pb collisions. Measurements of few-body QCD interactions, and their impact in unraveling the structure of hadrons and hadronic interactions, will be discussed. ALICE results relevant for physics topics outside the realm of QCD will also be touched upon. Finally, prospects for future measurements with the ALICE detector in the context of its planned upgrades will also be briefly described.


Eur. Phys. J. C 84 (2024) 813
e-Print: arXiv:2211.04384 | PDF | inSPIRE
CERN-EP-2022-227
Figure group

Figure 2

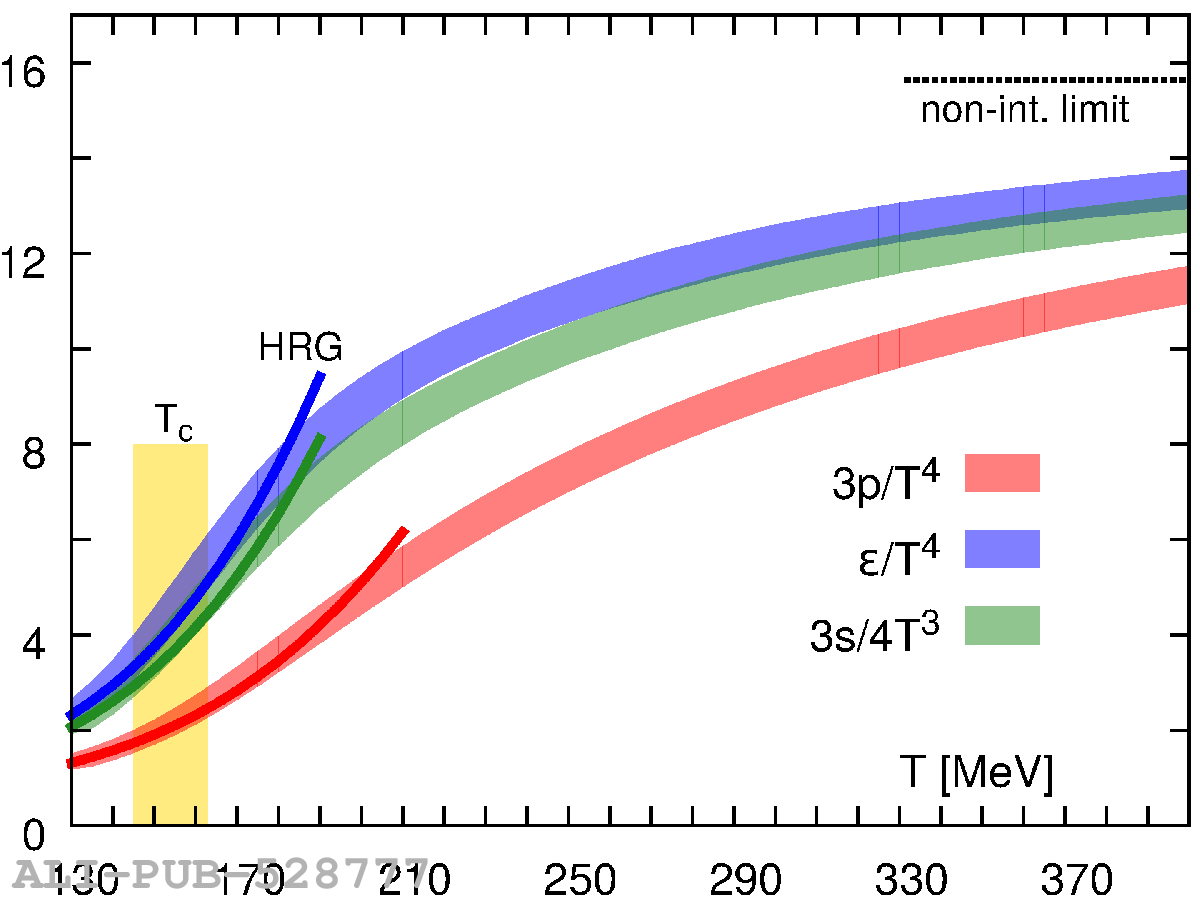
Pressure, energy density and entropy density normalised to the 4$^{\rm th}$ (3$^{\rm rd}$ for the latter) power of the temperature, from the Lattice QCD calculations of the HotQCD Collaboration, see Ref. . The dark lines show the prediction of the Hadron Resonance Gas model, the horizontal line corresponds to the ideal gas limit for the energy density. The vertical band indicates the cross-over transition region. Corresponding results from the Wuppertal-Budapest Collaboration can be found in Ref. .

Figure 4

The $xy$ distributions of the initial energy density (arbitrary units) from the MC-Glauber and IP-Glasma models for a heavy-ion collision .

Figure 5

A mapping of the energy density in the QGP phases vs time and space for a mid-central ($b=7.5$ fm) Pb-- \fivenn collision using the T$_{\rm{R}}$ENTo-VISHNU model chain .

Figure 6

A schematic representation of the QCD phase diagram. The green line and band shows the $\mu_{\rm B}$ region accessible to Lattice QCD calculations  . The line shows the pseudocritical temperature, whereas the band represents the half-width of the crossover transition i.e. the temperatures where the QGP and hadrons can co-exist. The open points show experimental results for the determination of the chemical freeze-out parameters . The location of atomic nuclei is also shown, as well as conjectured regions for the presence of a first order phase transition and of a critical point.

Figure 7

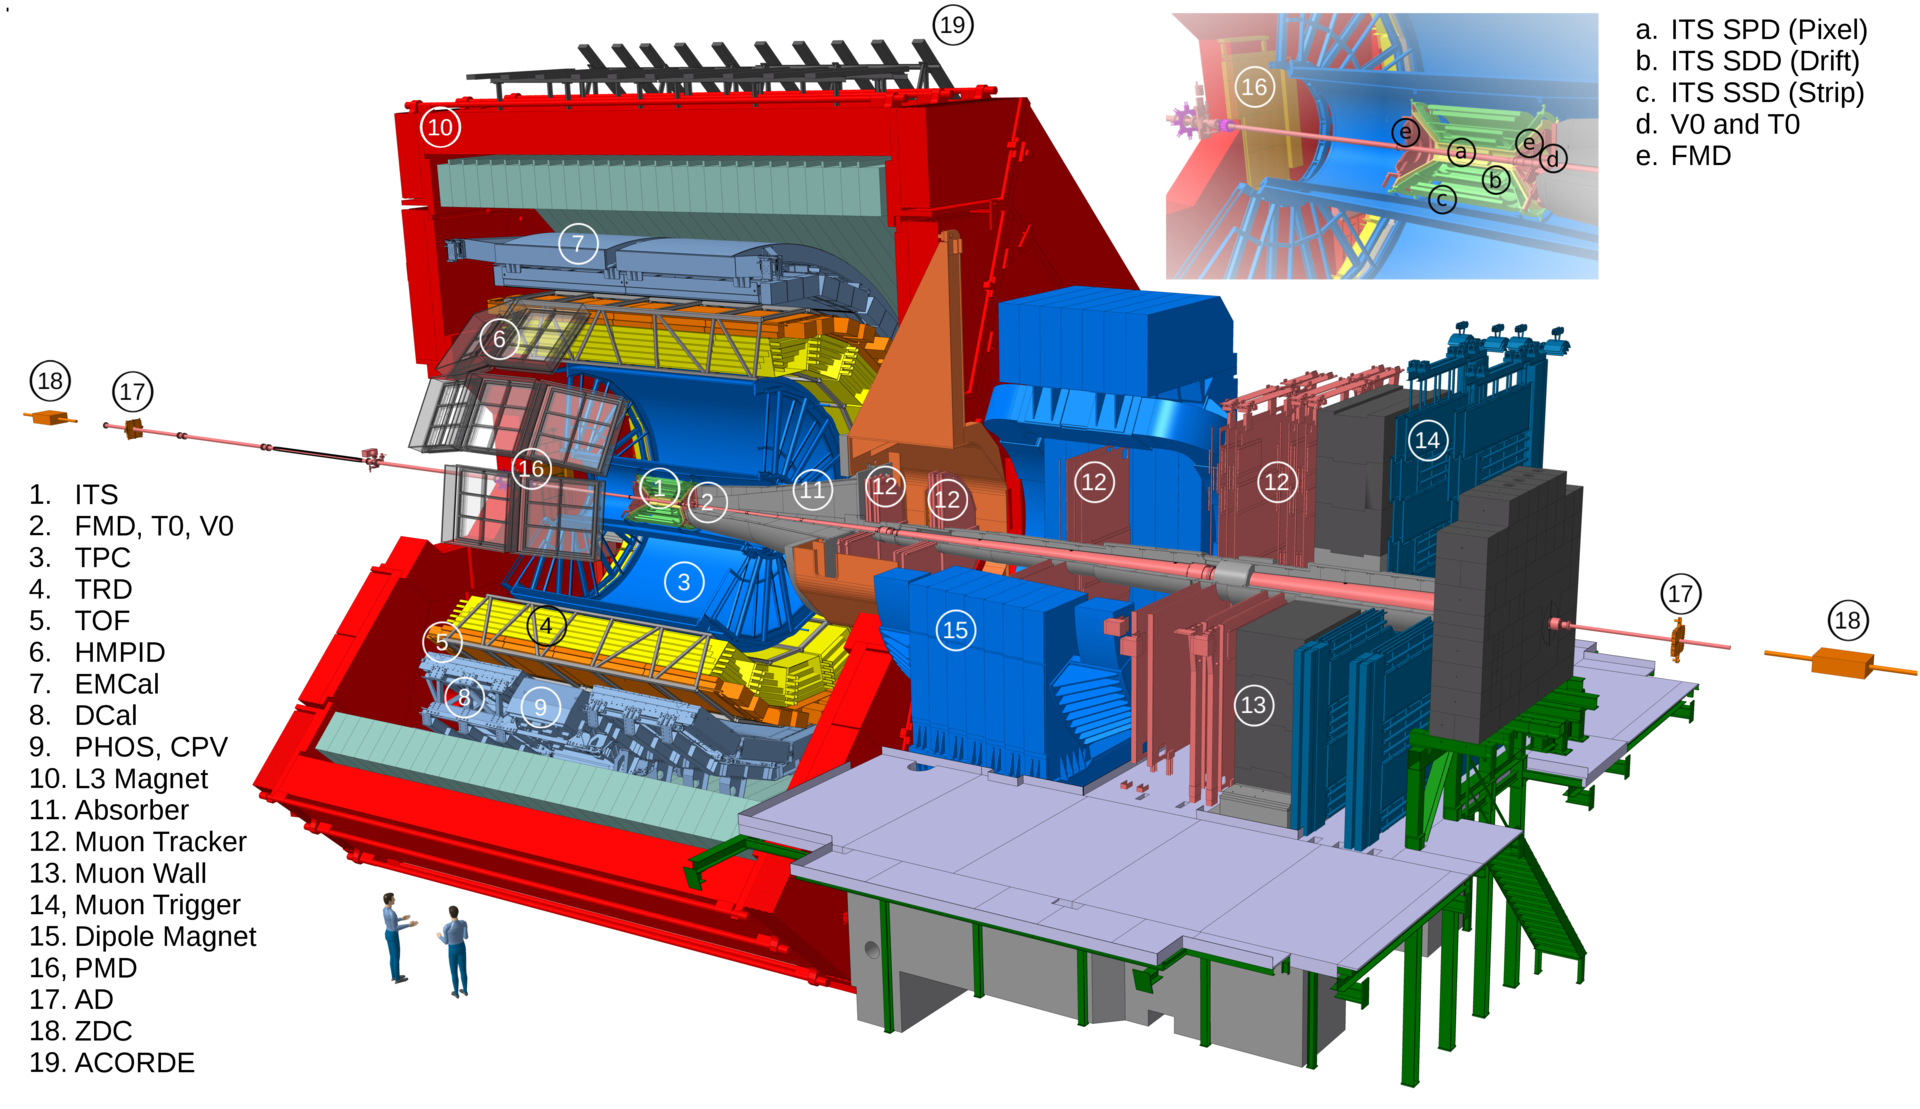
The ALICE detector. A short description of the various subdetectors, as well as information on their kinematic coverage, is given in the text.

Figure 8

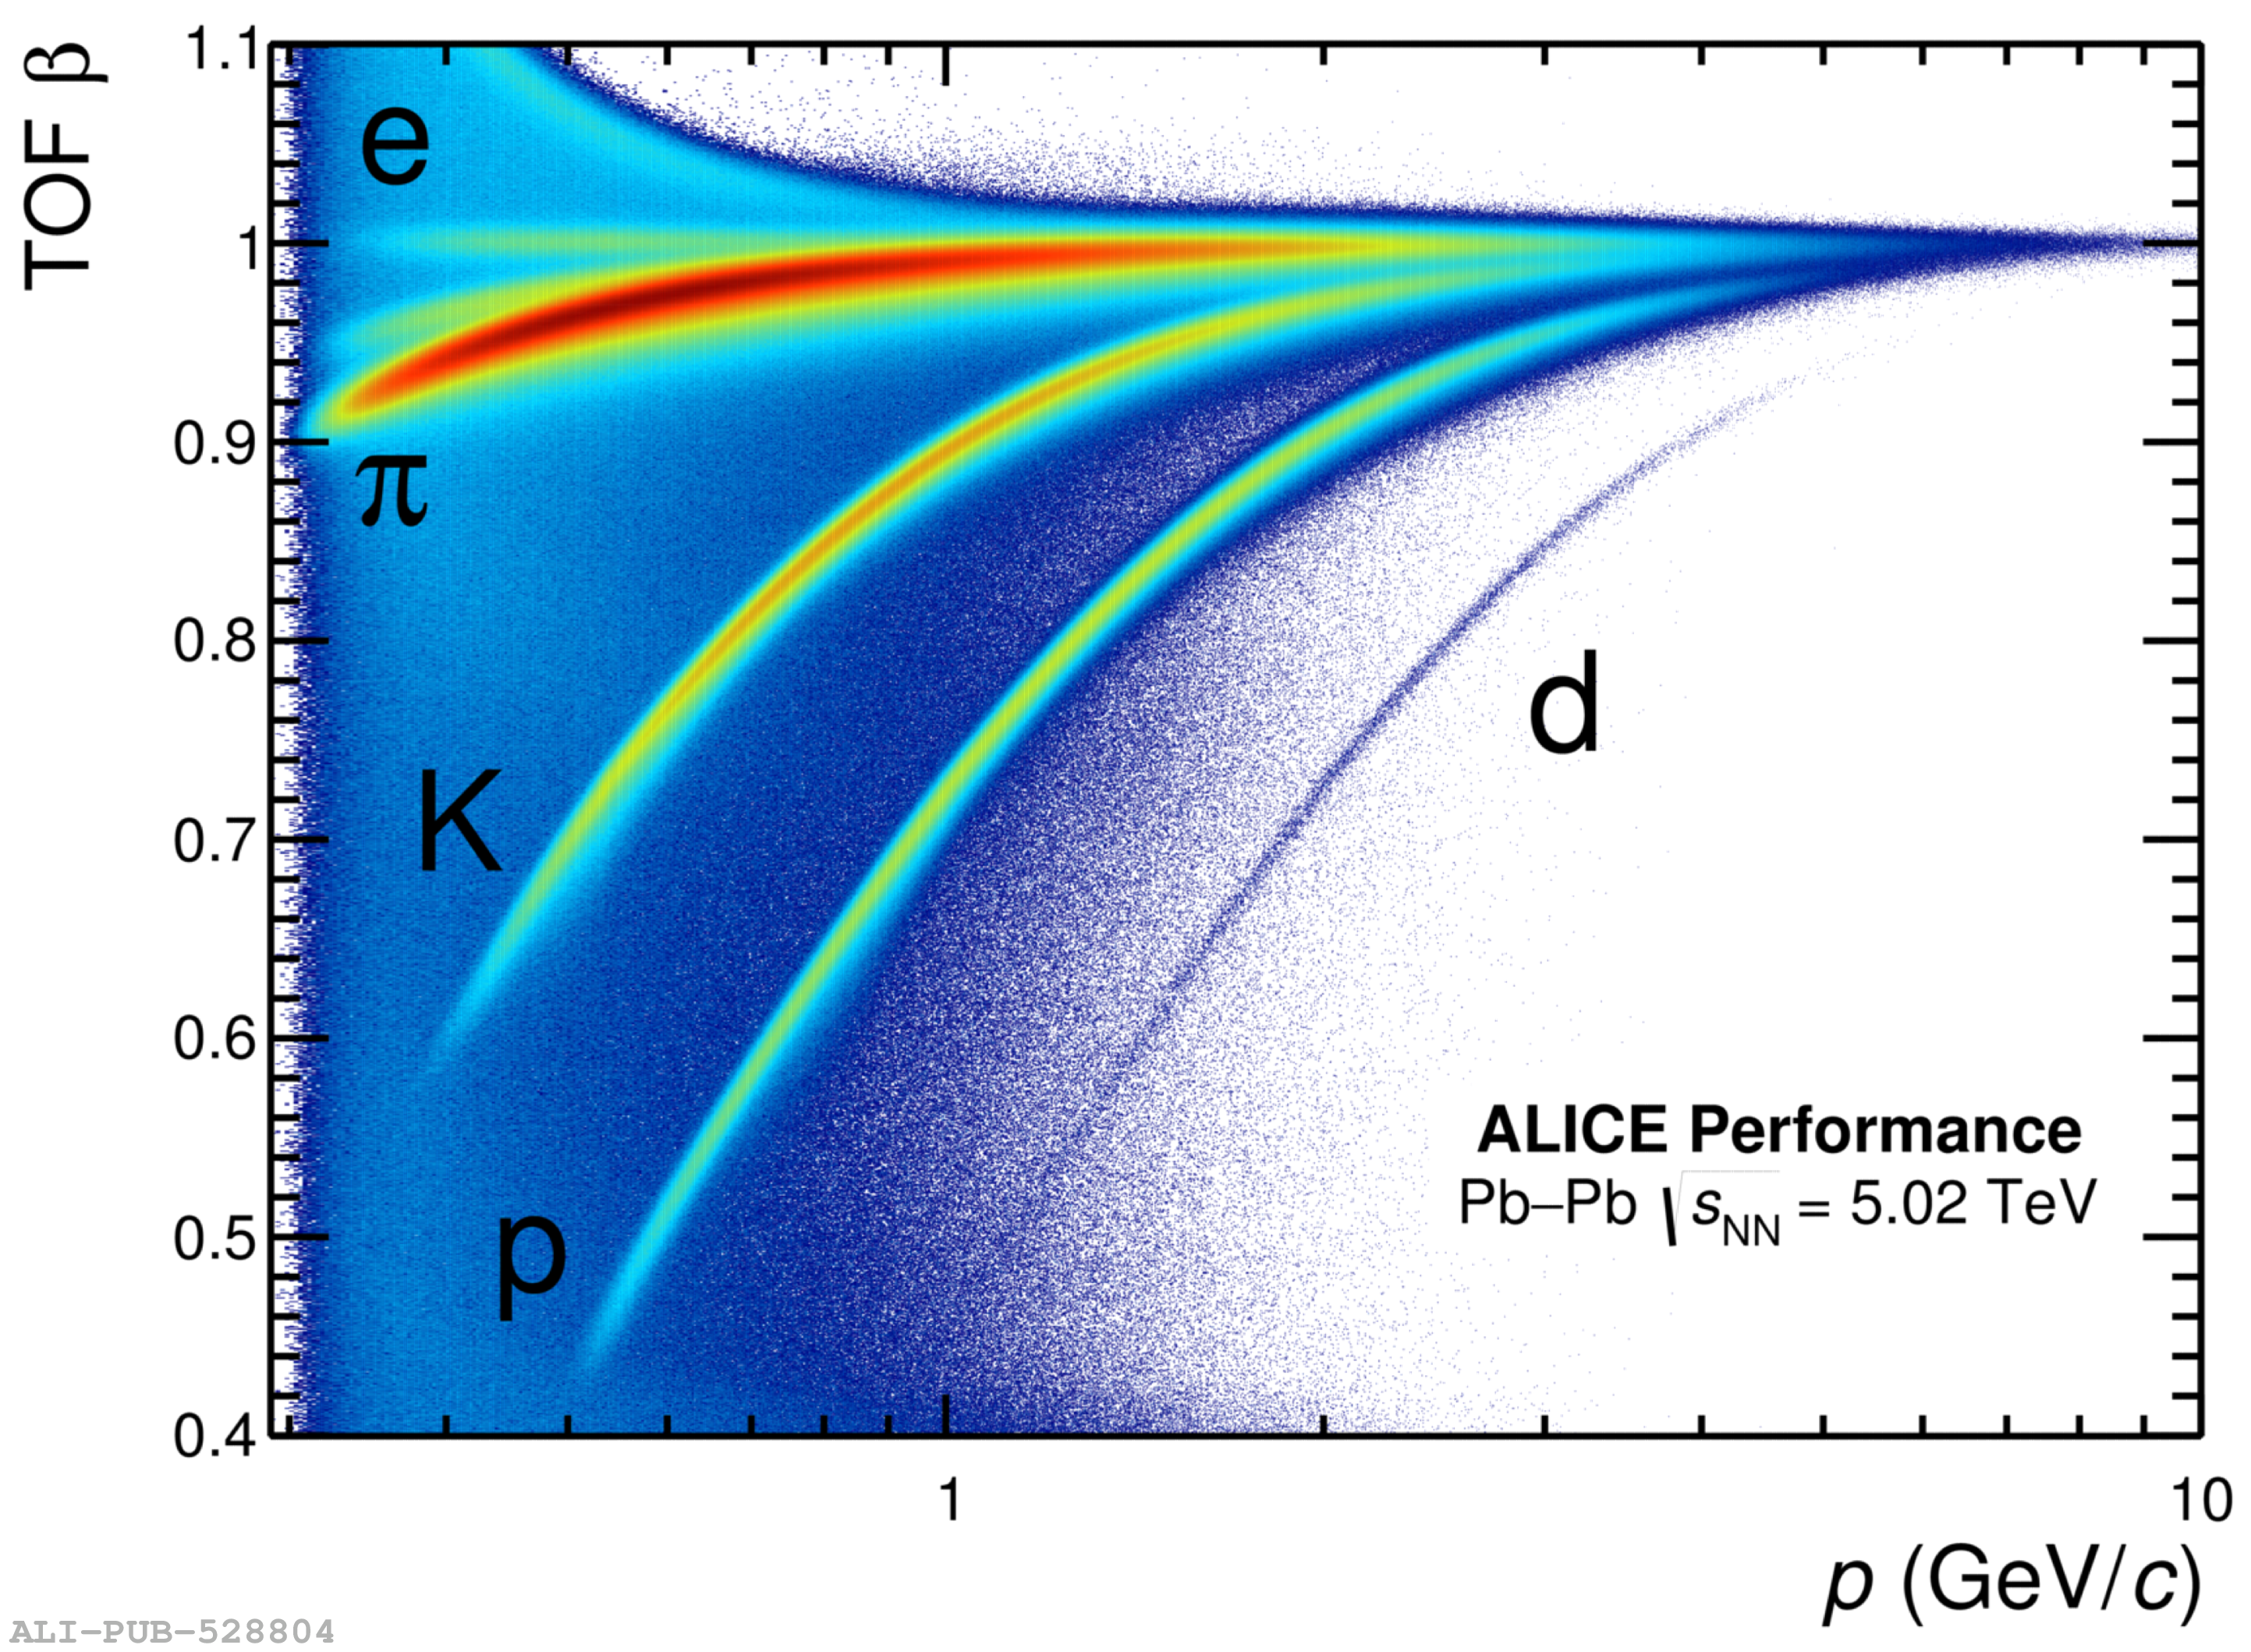
(Top) The ${\rm d}E/{\rm d}x$ signal in the ALICE TPC as a function of magnetic rigidity. The expected curves for various particle species are also shown, with the inset panel showing the TOF mass measurement providing additional separation for helium isotopes when $p/Z>$2.3 GeV/$c$. (Bottom) The Time-of-Flight measured in the TOF system as a function of the particle momentum. Tracks are selected with standard cuts inside the pseudorapidity region $|\eta| 0.5$.

Figure 9

ALICE particle identification and reconstruction capabilities, with the $p_{\rm T}$ coverage corresponding to the published measurements based on pp or Pb--Pb data samples. For W (Z) bosons, the selection $p_{\rm T}>10$ (20) GeV/$c$ is performed on the transverse momentum of the decay muon, without defining a sharp $p_{\rm T}$ range.

Figure 10

Summed signal amplitude in the V0 scintillators in triggered \PbPb collisions at \sqrtSnn = 5.02 \TeV (Top) Correlation between the V0M amplitude, at forward rapidity, and the number of charged-particle track segments (tracklets) reconstructed in the ITS at midrapidity ($\vert\eta\vert1.4$). (Bottom) Fit (red line) to the V0M distribution with a Glauber model coupled to a negative binomial distribution (NBD). Gray and white bands indicate the classification of the events into centrality classes, with centrality expressed in percentile of the hadronic cross section.

Figure 11

Collision energy dependence of the charged-particle pseudorapidity density at midrapidity ($|\eta|0.5$) normalised to the average number of participants, \dNdetape. Data from central \AA\ collisions  are compared to measurements in non-single diffractive p(d)A collisions  and inelastic (INEL) \pp\ and \ppbar collisions . ALICE heavy-ion data include \PbPb\ collisions at \sqrtSnn = 2.76 TeV and 5.02 TeV as well as \XeXe\ collisions at \sqrtSnn = 5.44 TeV. All values of \avNpart\ used for the normalisation of the data are the results of Glauber model calculations. The lines are power law fits to the data and the bands represent the uncertainties on the extracted dependencies.

Figure 12

(Left) Pseudorapidity density of charged particles in 0--5$\%$ central \PbPb\ collisions , NSD \pPb\ collisions , and INEL \pp\ collisions at \mbox{\sqrtSnn = 5.02 TeV}  in ALICE. Dashed lines represent EPOS 3.4 model calculations , available only for pp and \PbPb\ collisions at this energy and PYTHIA 8.3 , available for all collision systems Error bars represent systematic uncertainties on data, statistical uncertainties are negligible. (Right) Ratio between EPOS 3.4 and PYTHIA 8.3 model calculations relative to \PbPb\ (top), \pPb\ (middle), and \pp\ (bottom) data. Shaded bands represent the relative systematic uncertainties on data.

Figure 13

\dNdetape\ in \PbPb\ collisions , \pPb\ collisions  and \pp\ collisions  at \sqrtSnn = 5.02 TeV, \XeXe\ collisions at \sqrtSnn = 5.44 TeV  scaled by a factor of 0.98, Au-Au and Cu-Cu collisions at \sqrtSnn = 0.2 TeV  scaled by 2.55 as a function of \avNpart. PYTHIA 8.3 calculations  for $N_{\rm ch}-$selection are shown as black lines, dotted lines are $N_{\rm part}-$selected calculations.

Figure 14

Lower-bound estimate of the energy density times the formation time $\tau$ in pp, \pPb, and \PbPb\ collisions at $\sqrtSnn = 5.02$ \TeV as a function of the number of participating nucleons . The transverse area is calculated as the total area of overlap between participating nucleons using Eq. \ref{eq:eps_lb}. The open circles are from \PbPb{} collisions at $\sqrtSnn = 2.76$ \TeV and calculated via direct measurements of $\ET$ . A fit to a power law $a\Npart^p$ is shown with best-fit parameter values $a=0.8\pm0.2$ GeV/(fm$^2$$c$) and $p=0.44\pm0.07$, and $\chi^2/dof = 1.2/16$.

Figure 15

Evolution of the average energy density as a function of the proper time of the system in hydrodynamic calculations. The green curve represents the average energy density profile from hydrodynamic model calculation from . The blue line the grey bands represent the energy density estimated from the total transverse energy, $E_{\mathrm{T}}$, measured in 0-5$\%$ central \PbPb\ collisions at $\sqrtSnn = 2.76$ TeV  using Eq. \ref{eq:bjorkenest} for the free-streaming expansion and Eq. \ref{eq:hydro_eps_evol} for hydrodynamical expansion. The hydrodynamical expansion is matched to the free-streaming behaviour at $\tau = 6$ and $12 \;\mathrm{fm}/c$.

Figure 16

Direct photon spectra (top) and direct photon excess \Rgamma (bottom) measured in \PbPb\ collisions at \sqrtSnn = 2.76 TeV  and \sqrtSnn = 0.2 TeV  in the 0--20\% (left) and 20--40$\%$ (right) centrality classes. The slope of the exponential function fitted to the ALICE data was determined without subtracting any pQCD contribution. The slope of the spectrum measured by PHENIX was determined after subtracting a pQCD contribution determined by parameterising a direct photon measurement in pp collisions.

Figure 17

Elliptic flow of direct photons, \vtwogammadir, in the 0--20\% (left) and 20--40\% (right) centrality classes for \PbPb\ collisions at \sqrtSnn = 2.76 TeV . The vertical bars and the boxes indicate the statistical and the total uncertainties on the data, respectively. ALICE data are compared to model calculations  and PHENIX data  in the same respective centrality classes.

Figure 18

Homogeneity volume (top) and decoupling time $\tau_f$ (bottom) measured at \sqrtSnn = 2.76 TeV  compared to those obtained for central \AuAu\ and \PbPb\ collisions at lower energies at the AGS , SPS , and RHIC . The homogeneity region is determined as the product of the three pion femtoscopic radii at $\langle\kT\rangle = 0.3$ \GeVc for 0--5\% central events, whereas the decoupling time $\tau_f$ is extracted from \Rlong(\kT) according to \eq \ref{eq:rlong_mt}.

Figure 19

Multiplicity dependence of pion radii in \pp, \pPb\ and \AA\ collisions for a number of collision systems and energies . Various experiments use different \kT ranges. On the plot are the values for the range for which the average \kT is closest to the selected value of 0.25 \GeVc.

Figure 20

Pair transverse mass dependence of the pion  and kaon  femtoscopic radii for different event centralities in \PbPb\ collisions at \sqrtSnn = 2.76 \TeV. The measured $R_{\rm out}$, $R_{\rm side}$, $R_{\rm long}$ are reported in the left, right top and bottom panel, respectively. The experimental data are reported with solid symbols together with statistical and systematic uncertainties. Bands represent theoretical predictions of pion radii by a (3+1)D hydrodynamic model coupled to the Therminator code  for the same centralities as in data, selected based on the impact parameter b in the calculation Lines represent calculations for central collisions by the HKM model with and without rescattering .

Figure 21

(Top) Energy dependence of $v_2$ for midcentral heavy-ion collisions integrated over $p_{\rm T}$ . (Bottom) Decomposition of the two-particle correlation function in terms of even and odd anisotropic flow harmonics ($v_{\rm n}$) from very central Pb--Pb collisions at $\sqrt{s_{\rm{NN}}}=$ 2.76 TeV .

Figure 22

Transverse momentum distributions of $\pi^{+}$, $\rm K^+$, p , $\rm K^{0}_{S}$ and $\Lambda$ , and the $\phi$ meson  for the 0--5\% and 80--90\% centrality intervals in Pb--Pb collisions at $\sqrt{s_{\rm{NN}}}= 2.76$ TeV. The data points are scaled by various factors for better visibility. Statistical and systematic uncertainties are shown as bars and boxes, respectively.

Figure 23

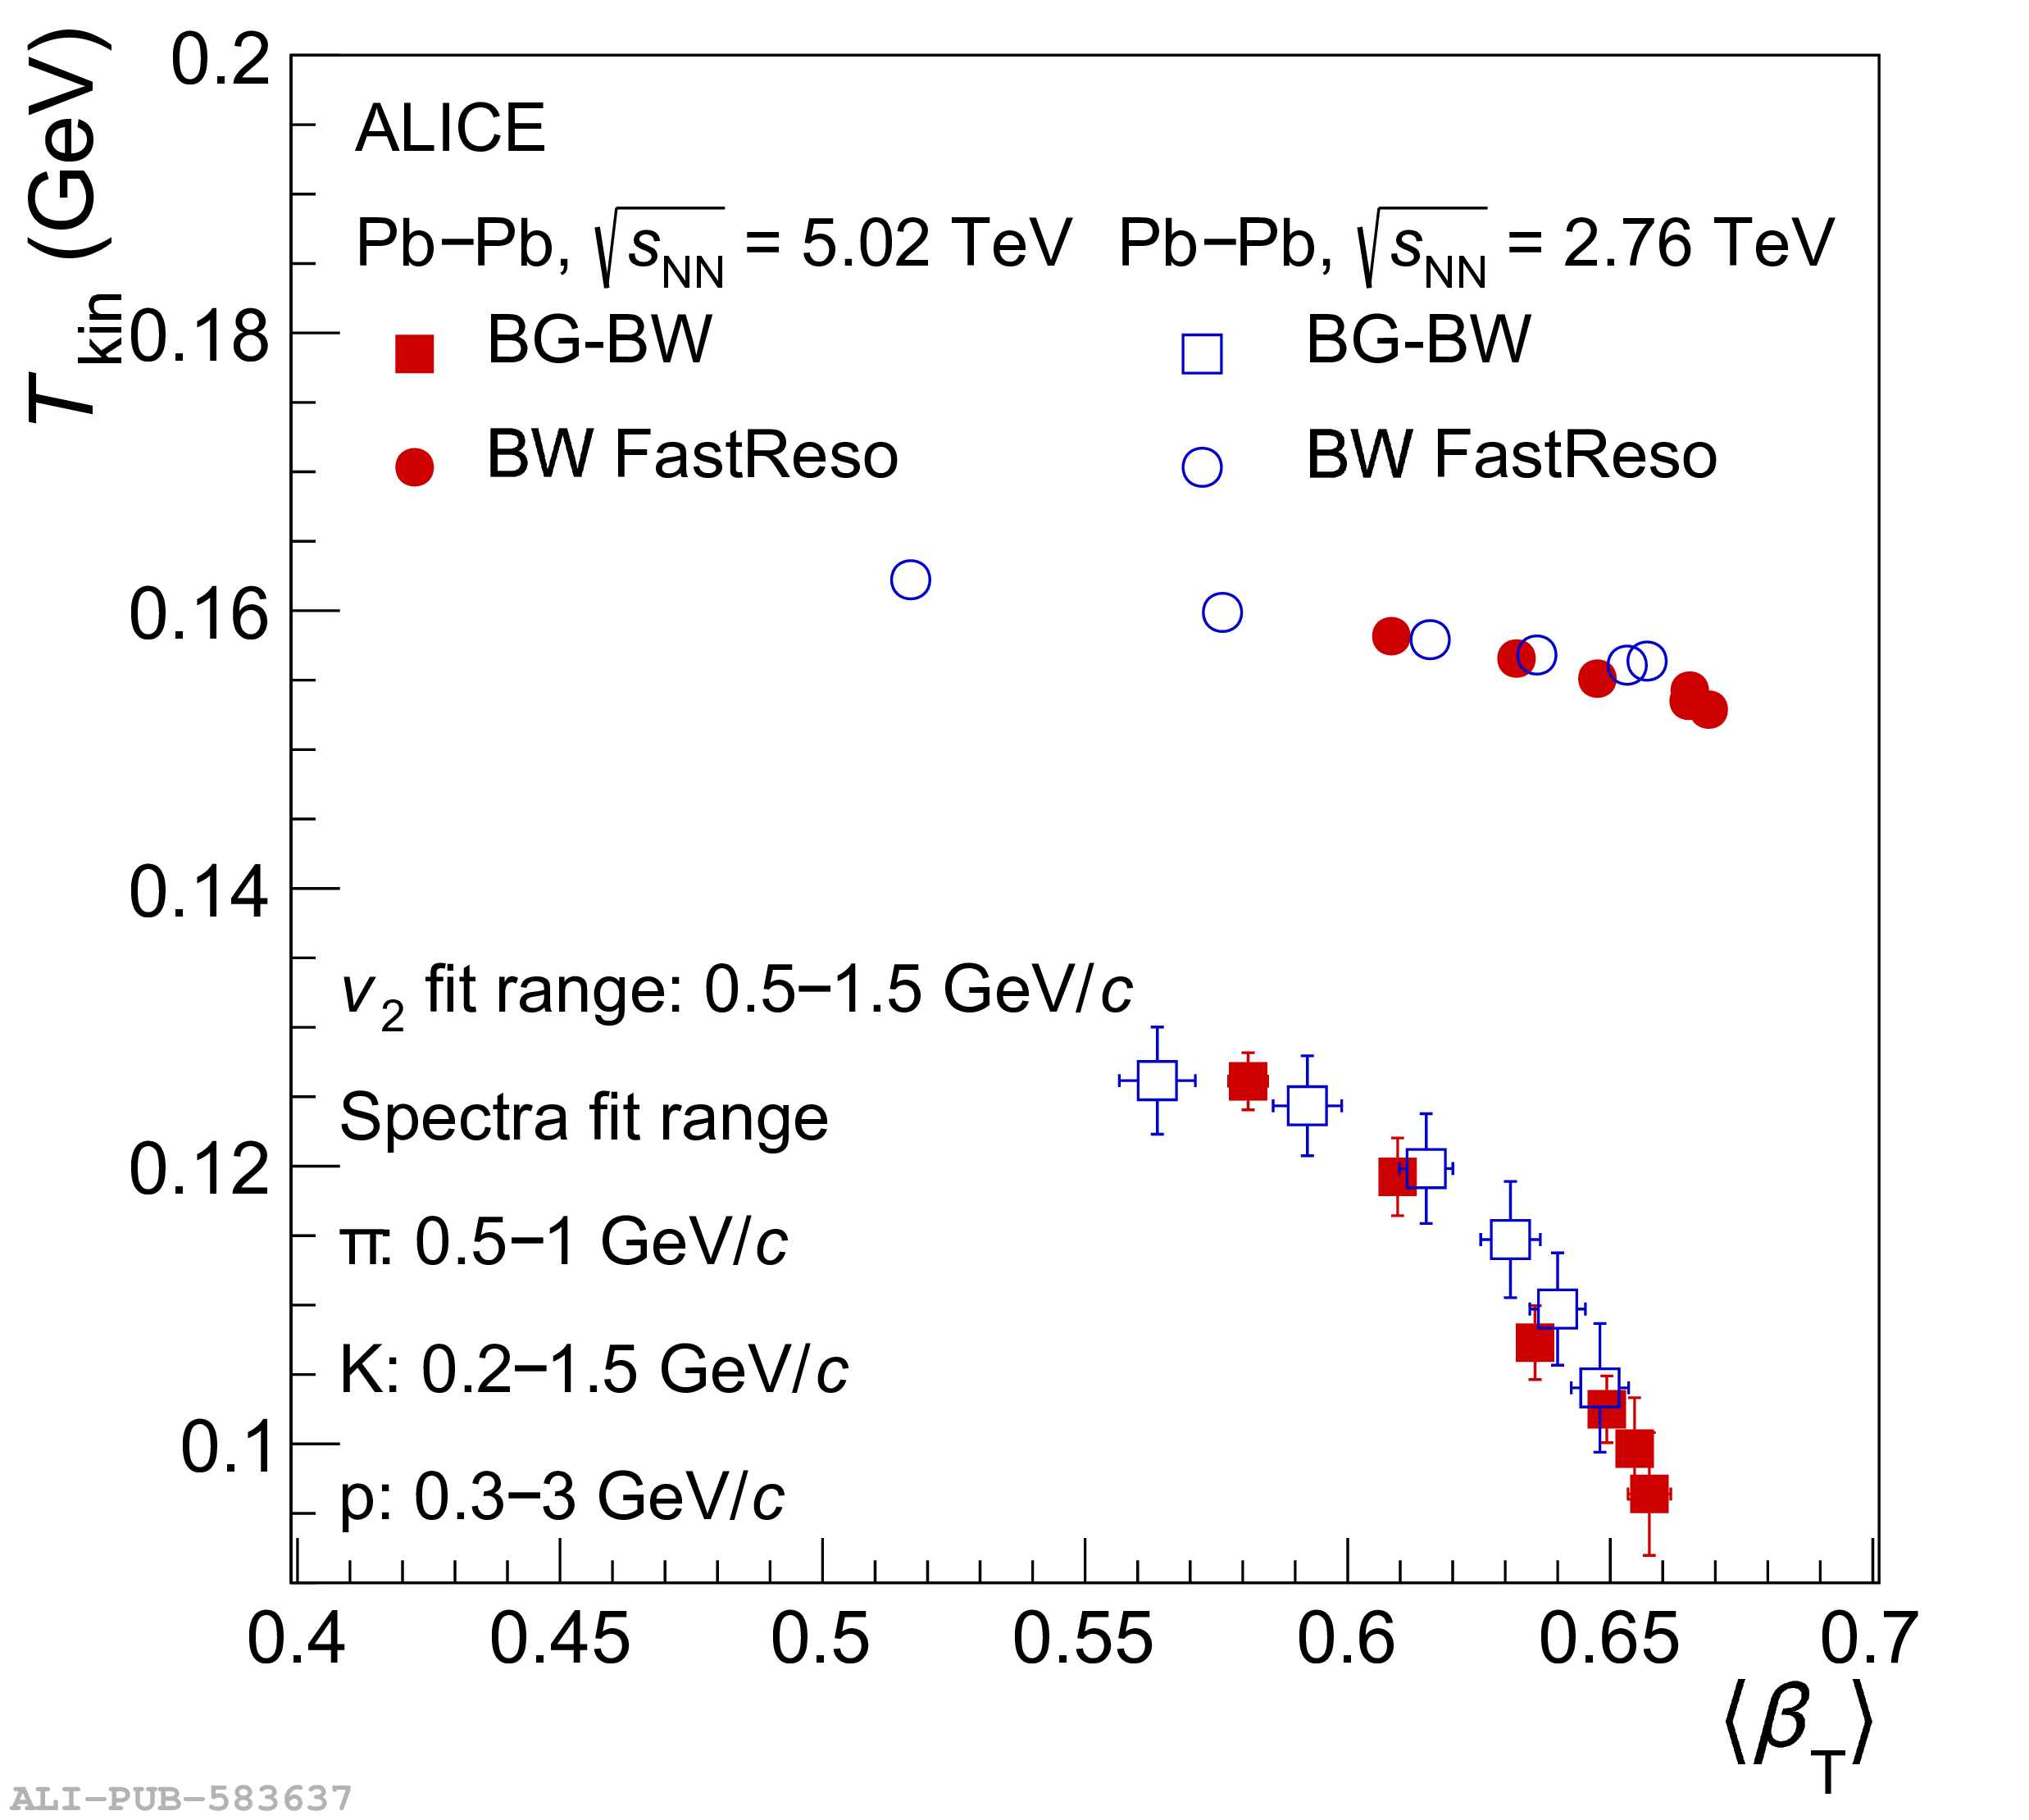
Blast-Wave model parameters of the kinetic freeze-out temperature $T_{\rm{kin}}$ and radial flow velocity $\beta_{\rm{T}}$. These extracted values involve simultaneous fits to $\pi$, K, and p spectra and $v_{2}$ for the two models in Pb--Pb collisions.

Figure 24

Comparisons of ALICE measurements of identified particle $\langle p_{\mathrm{T}} \rangle$ and charged hadron $\it{v}_{n}$ coefficients in Pb--Pb collisions at $\sqrt{s_{\rm{NN}}}=$ 5.02 TeV (left) and Xe--Xe collisions at $\sqrt{s_{\rm{NN}}}=$ 5.44 TeV (right)  to hydrodynamic calculations  .

Figure 25

Measurements of charged hadron $\it{v}_{n}$ coefficients in central Pb--Pb collisions at $\sqrt{s_{\rm{NN}}}=$ 5.02 TeV  compared with hydrodynamic calculations . The arrow denotes predictions from Ref.  for 0--0.2\% Pb--Pb collisions.

Figure 27

The $p_{\mathrm{T}}$--differential $v_2$ (a), $v_3$ (b), $v_4$ (c), and $v_{4,22}$ (d) measured by ALICE in semicentral (i.e., 20--30\% centrality interval) Pb--Pb collisions at $\sqrt{s_{\mathrm{NN}}} = 5.02$ TeV . The data points are drawn with their statistical (error bars) and systematic (boxes) uncertainties. The curves represent estimations extracted from T$_{\rm{R}}$ENTo+VISHNU that give the best description of other anisotropic flow measurements among all models studied.

Figure 28

Centrality dependence of event-by-event flow harmonic correlations measured by ALICE in Pb--Pb collisions at $\sqrt{s_{\mathrm{NN}}} = 2.76$ TeV  compared with various hydrodynamic calculations . The SC(4,2) and SC(5,3) points are slightly shifted along the horizontal axis for better visibility in the left panel.

Figure 29

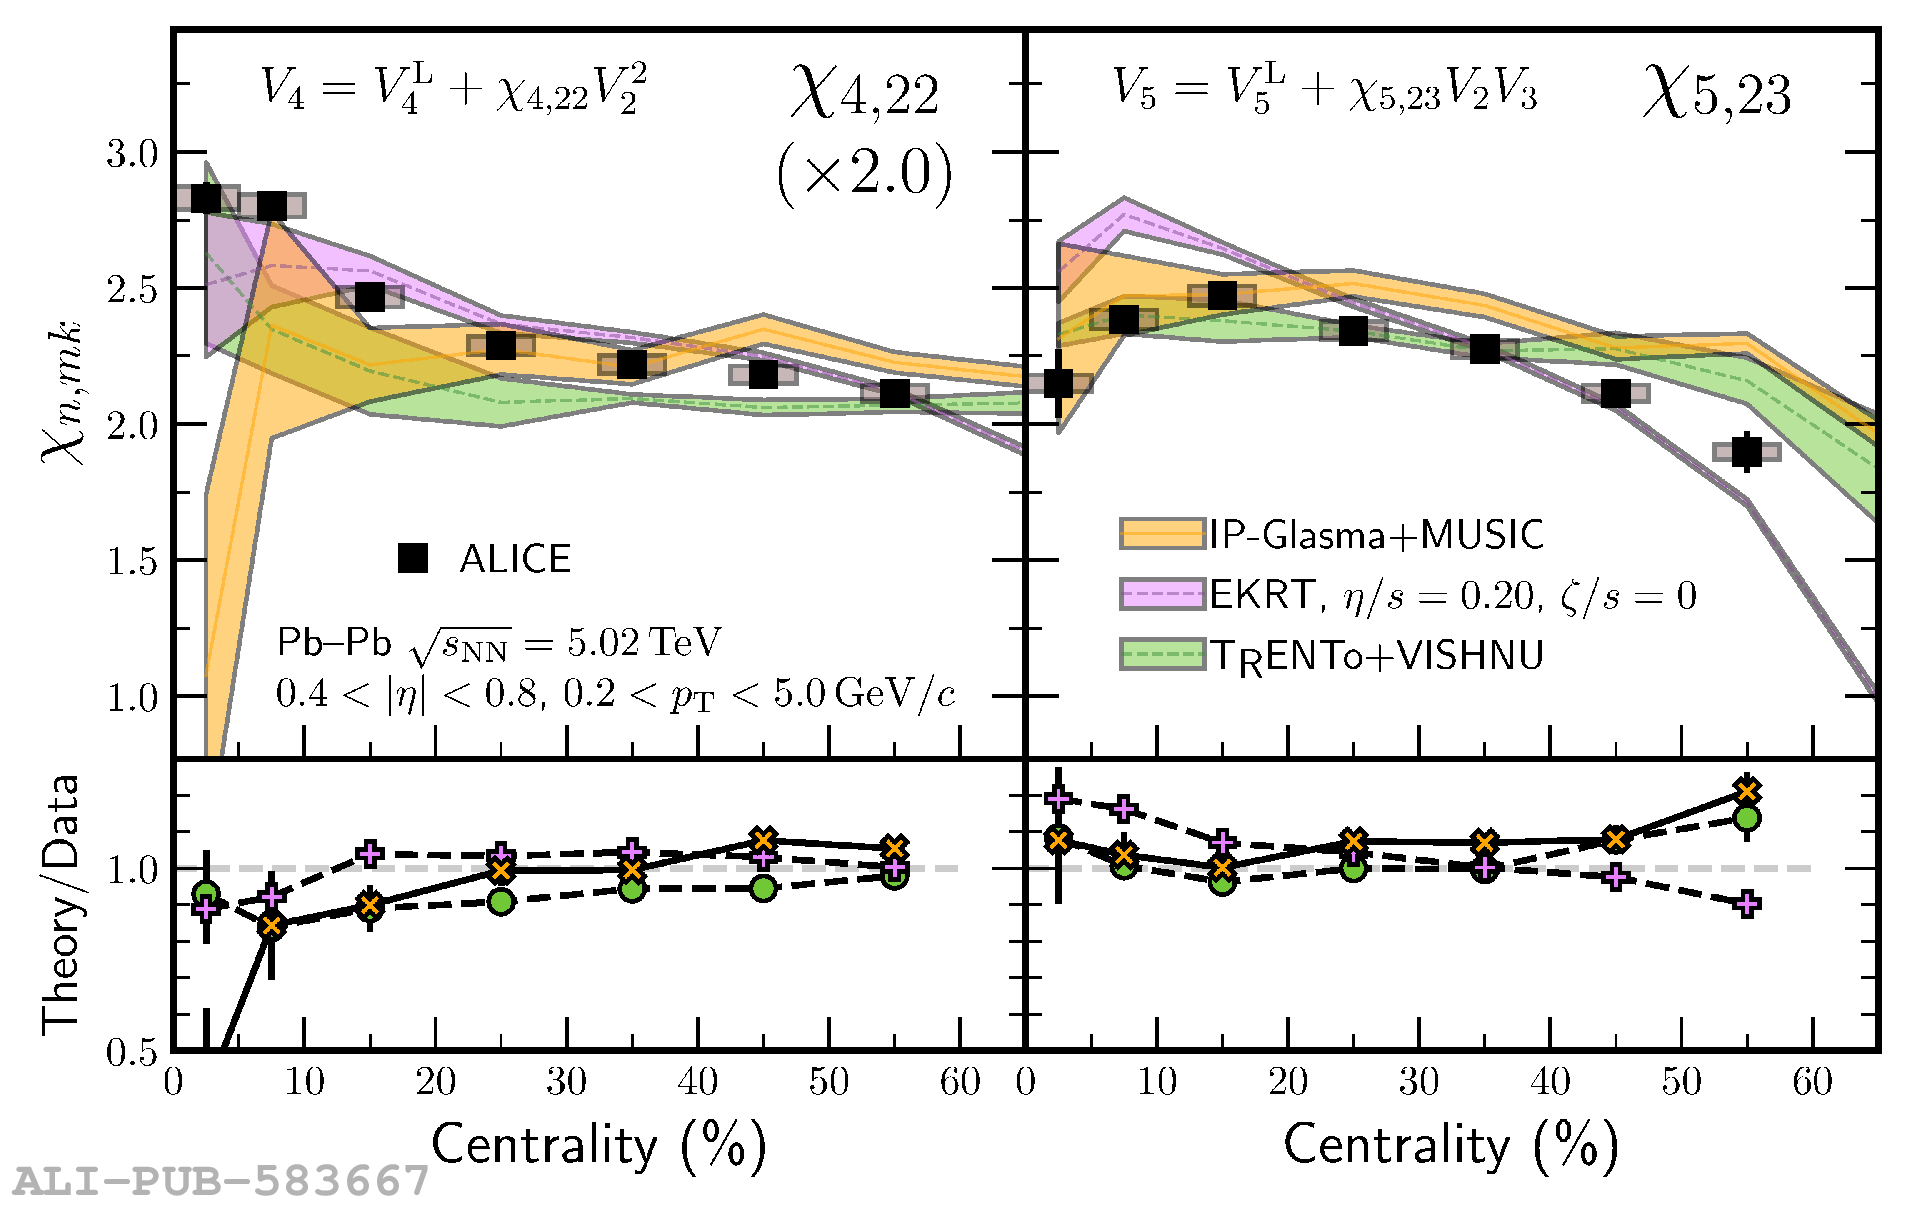
Non-linear flow mode coefficients $\chi_{4, 22}$ (left) and $\chi_{5, 23}$ (right) in Pb--Pb collisions at $\sqrt{s_{\mathrm{NN}}} = 5.02$ TeV compared to various hydrodynamic calculations .

Figure 30

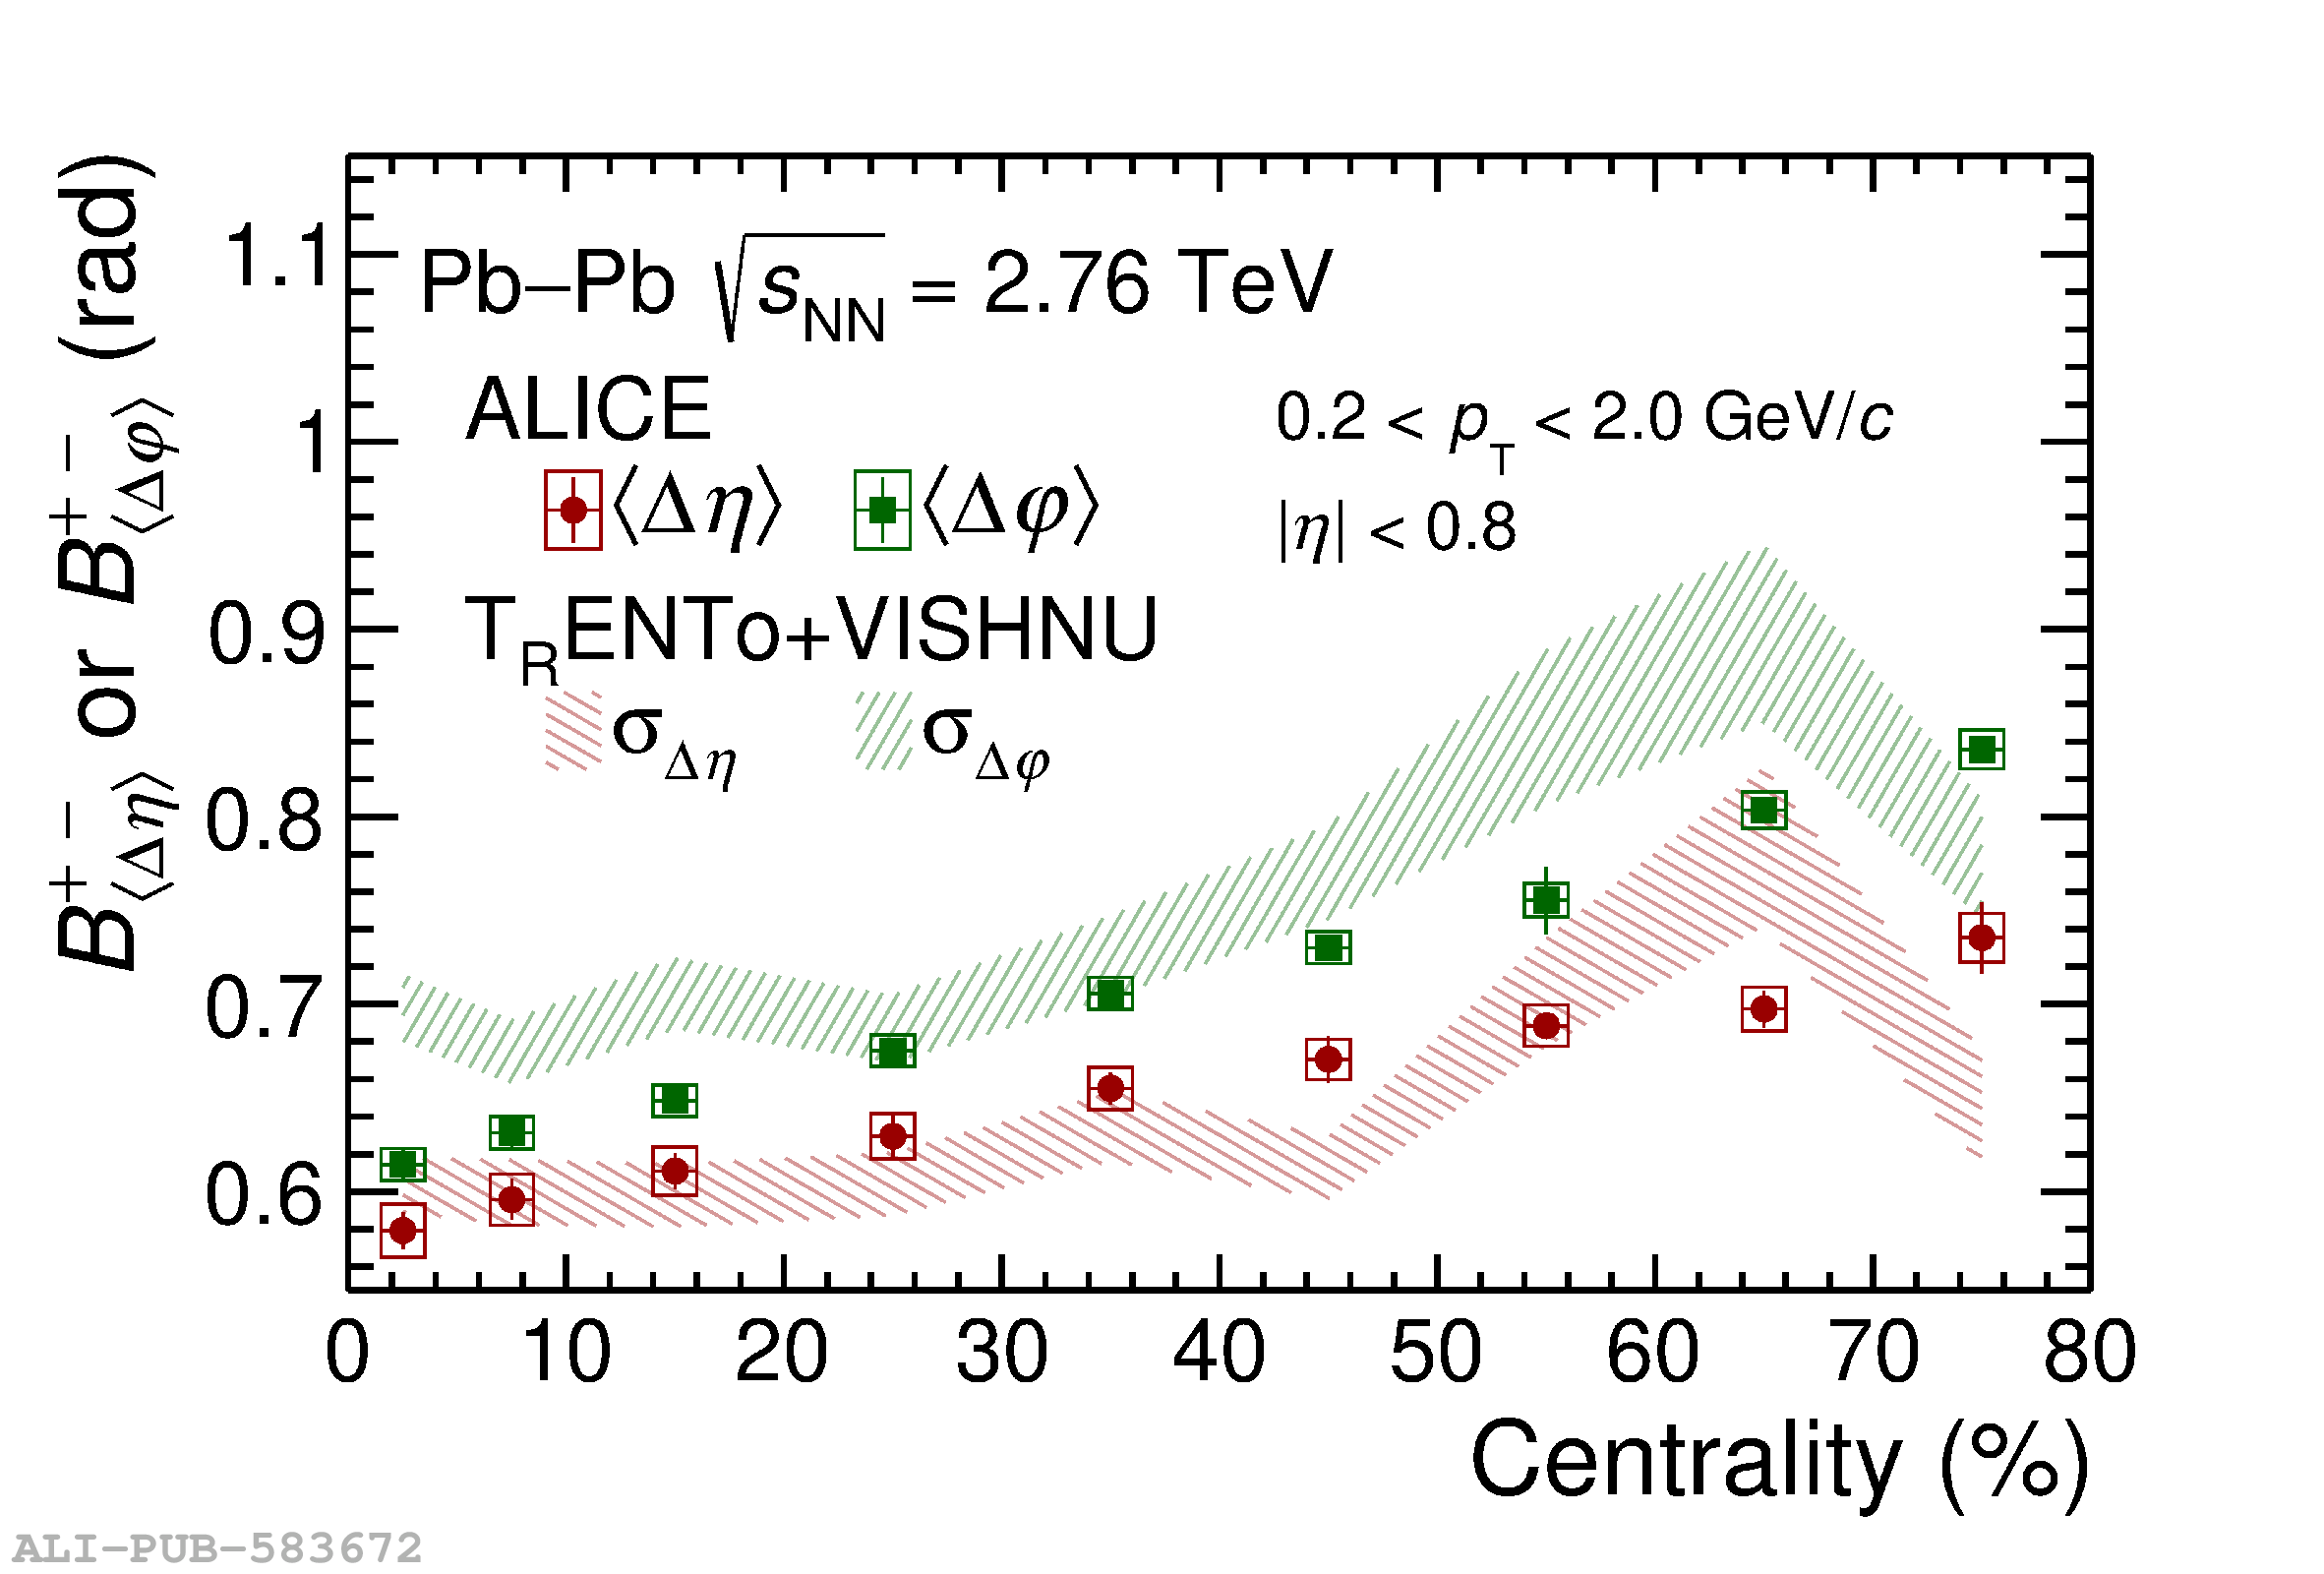
(Top) Evolution of longitudinal and azimuthal widths as a function of collision centrality for the balance function $B^{+-}$. (Bottom) The two-particle transverse momentum correlator $G_{2}^{\rm CI}$ as a function of centrality. ALICE data  are compared to calculations from the T$_{\rm{R}}$ENTo+VISHNU model chain .

Figure 31

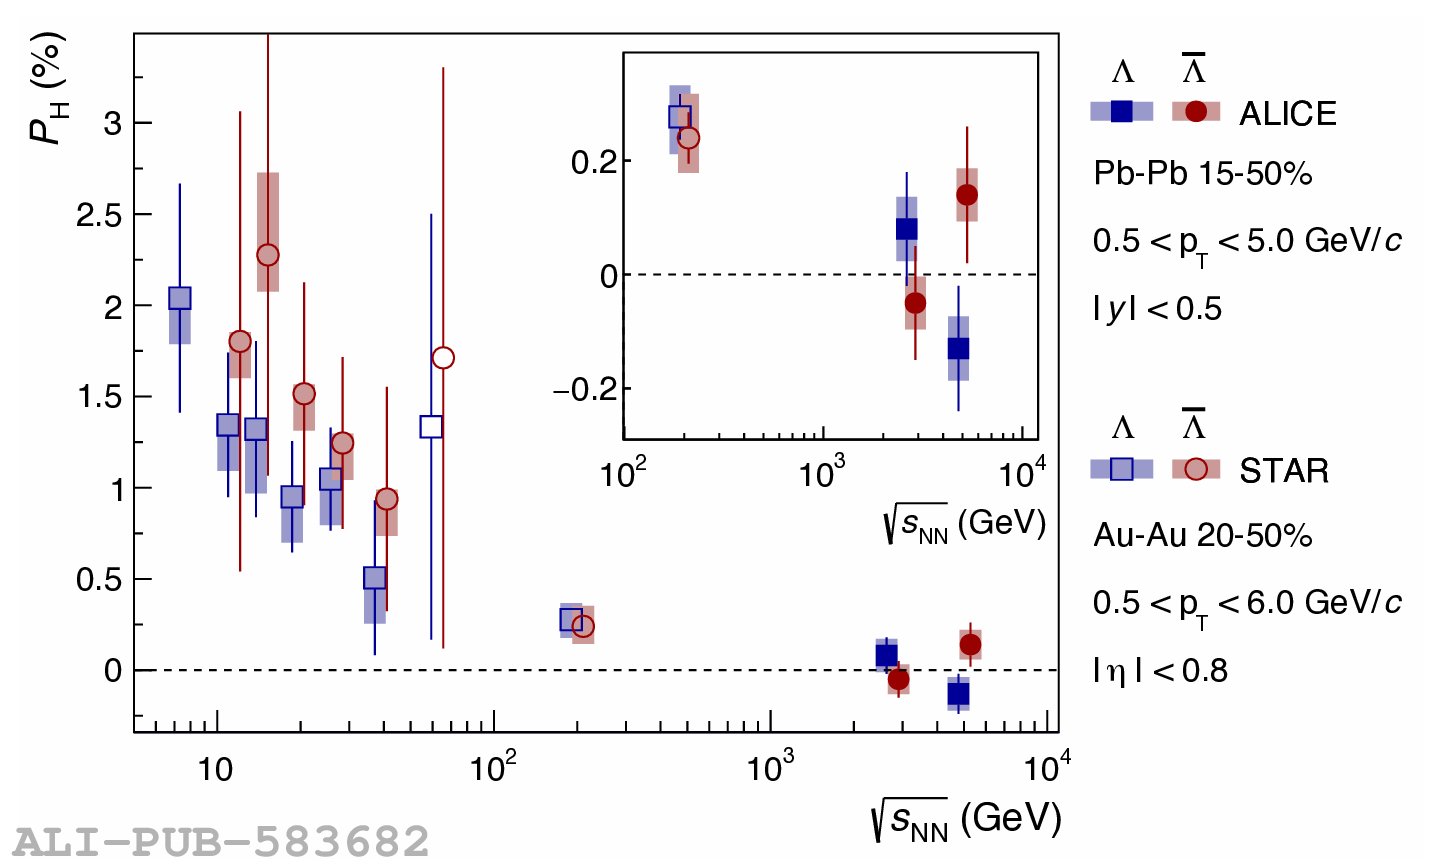
(Top) The global hyperon polarisation (\ph) as a function of collision energy compared with the STAR data at lower energies . The insert shows zoomed-in comparison with the data at the top RHIC energy. The systematic uncertainties are shown as shaded boxes. Points are slightly shifted along the horizontal axis for better visibility. (Bottom) Centrality dependence of the hyperon polarisation component along the beam direction $P_z$ measured in Pb--Pb collisions at $\sNN=$ 5.02 TeV compared with STAR data and two hydrodynamic calculations .

Figure 32

(Left) \rh as a function of \pt for \kst in Pb--Pb and pp collisions, and for \Kzs in Pb--Pb collisions. (Right) Centrality dependence of \rh for \kst mesons in Pb--Pb collisions. From Ref. .

Figure 33

Measured multiplicity per unit of rapidity of different hadron species and light nuclei  compared to SHM fits from THERMUS , SHARE , Thermal-FIST , and GSI-Heidelberg . Differences between the model calculations and the measured yields are shown in the bottom panels. The hypertriton yield is obtained using a theoretical estimation of BR = 25\% for the branching ratio of the ${}^3_\Lambda{\rm H} \rightarrow {}^3{\rm He}\,\pi^{-}$ decay channel .

Figure 34

\pT-integrated yields per unit of rapidity measured at midrapidity for different charm-hadron species in the 10\% most central \PbPb\ collisions at $\sqrtSnn=5.02 \tev$  compared to SHM predictions . Systematic uncertainties from data (open boxes) and from the \pT{} extrapolation (shaded boxes) are shown separately. The coloured band in the SHM predictions represents the uncertainty on the charm-quark production cross section.

Figure 35

(Left) Transverse-momentum spectra of \rmPiPM, \rmKpm, p+\pbar  and \rmPhiMes  in 0--10\% (filled markers) and \mbox{70--80\%} (empty markers) central \PbPb\ collisions at \sqrtSnn{} = 5.02 \tev. (Right) Proton-to-pion and proton-to-phi \pT-differential ratios in inelastic pp collisions at \sqrtS{} = 5.02 \tev\ and in several centrality intervals in \PbPb\ collisions at \sqrtSnn{} = 5.02 \tev. Systematic uncertainties are shown as boxes while statistical uncertainties as vertical bars. In the (p+\pbar)/(\piPlus+\piMinus) ratio, only the systematic uncertainties uncorrelated across centrality intervals are shown in the error boxes, in order to better highlight the evolution of the ratio with the collision centrality.

Figure 36

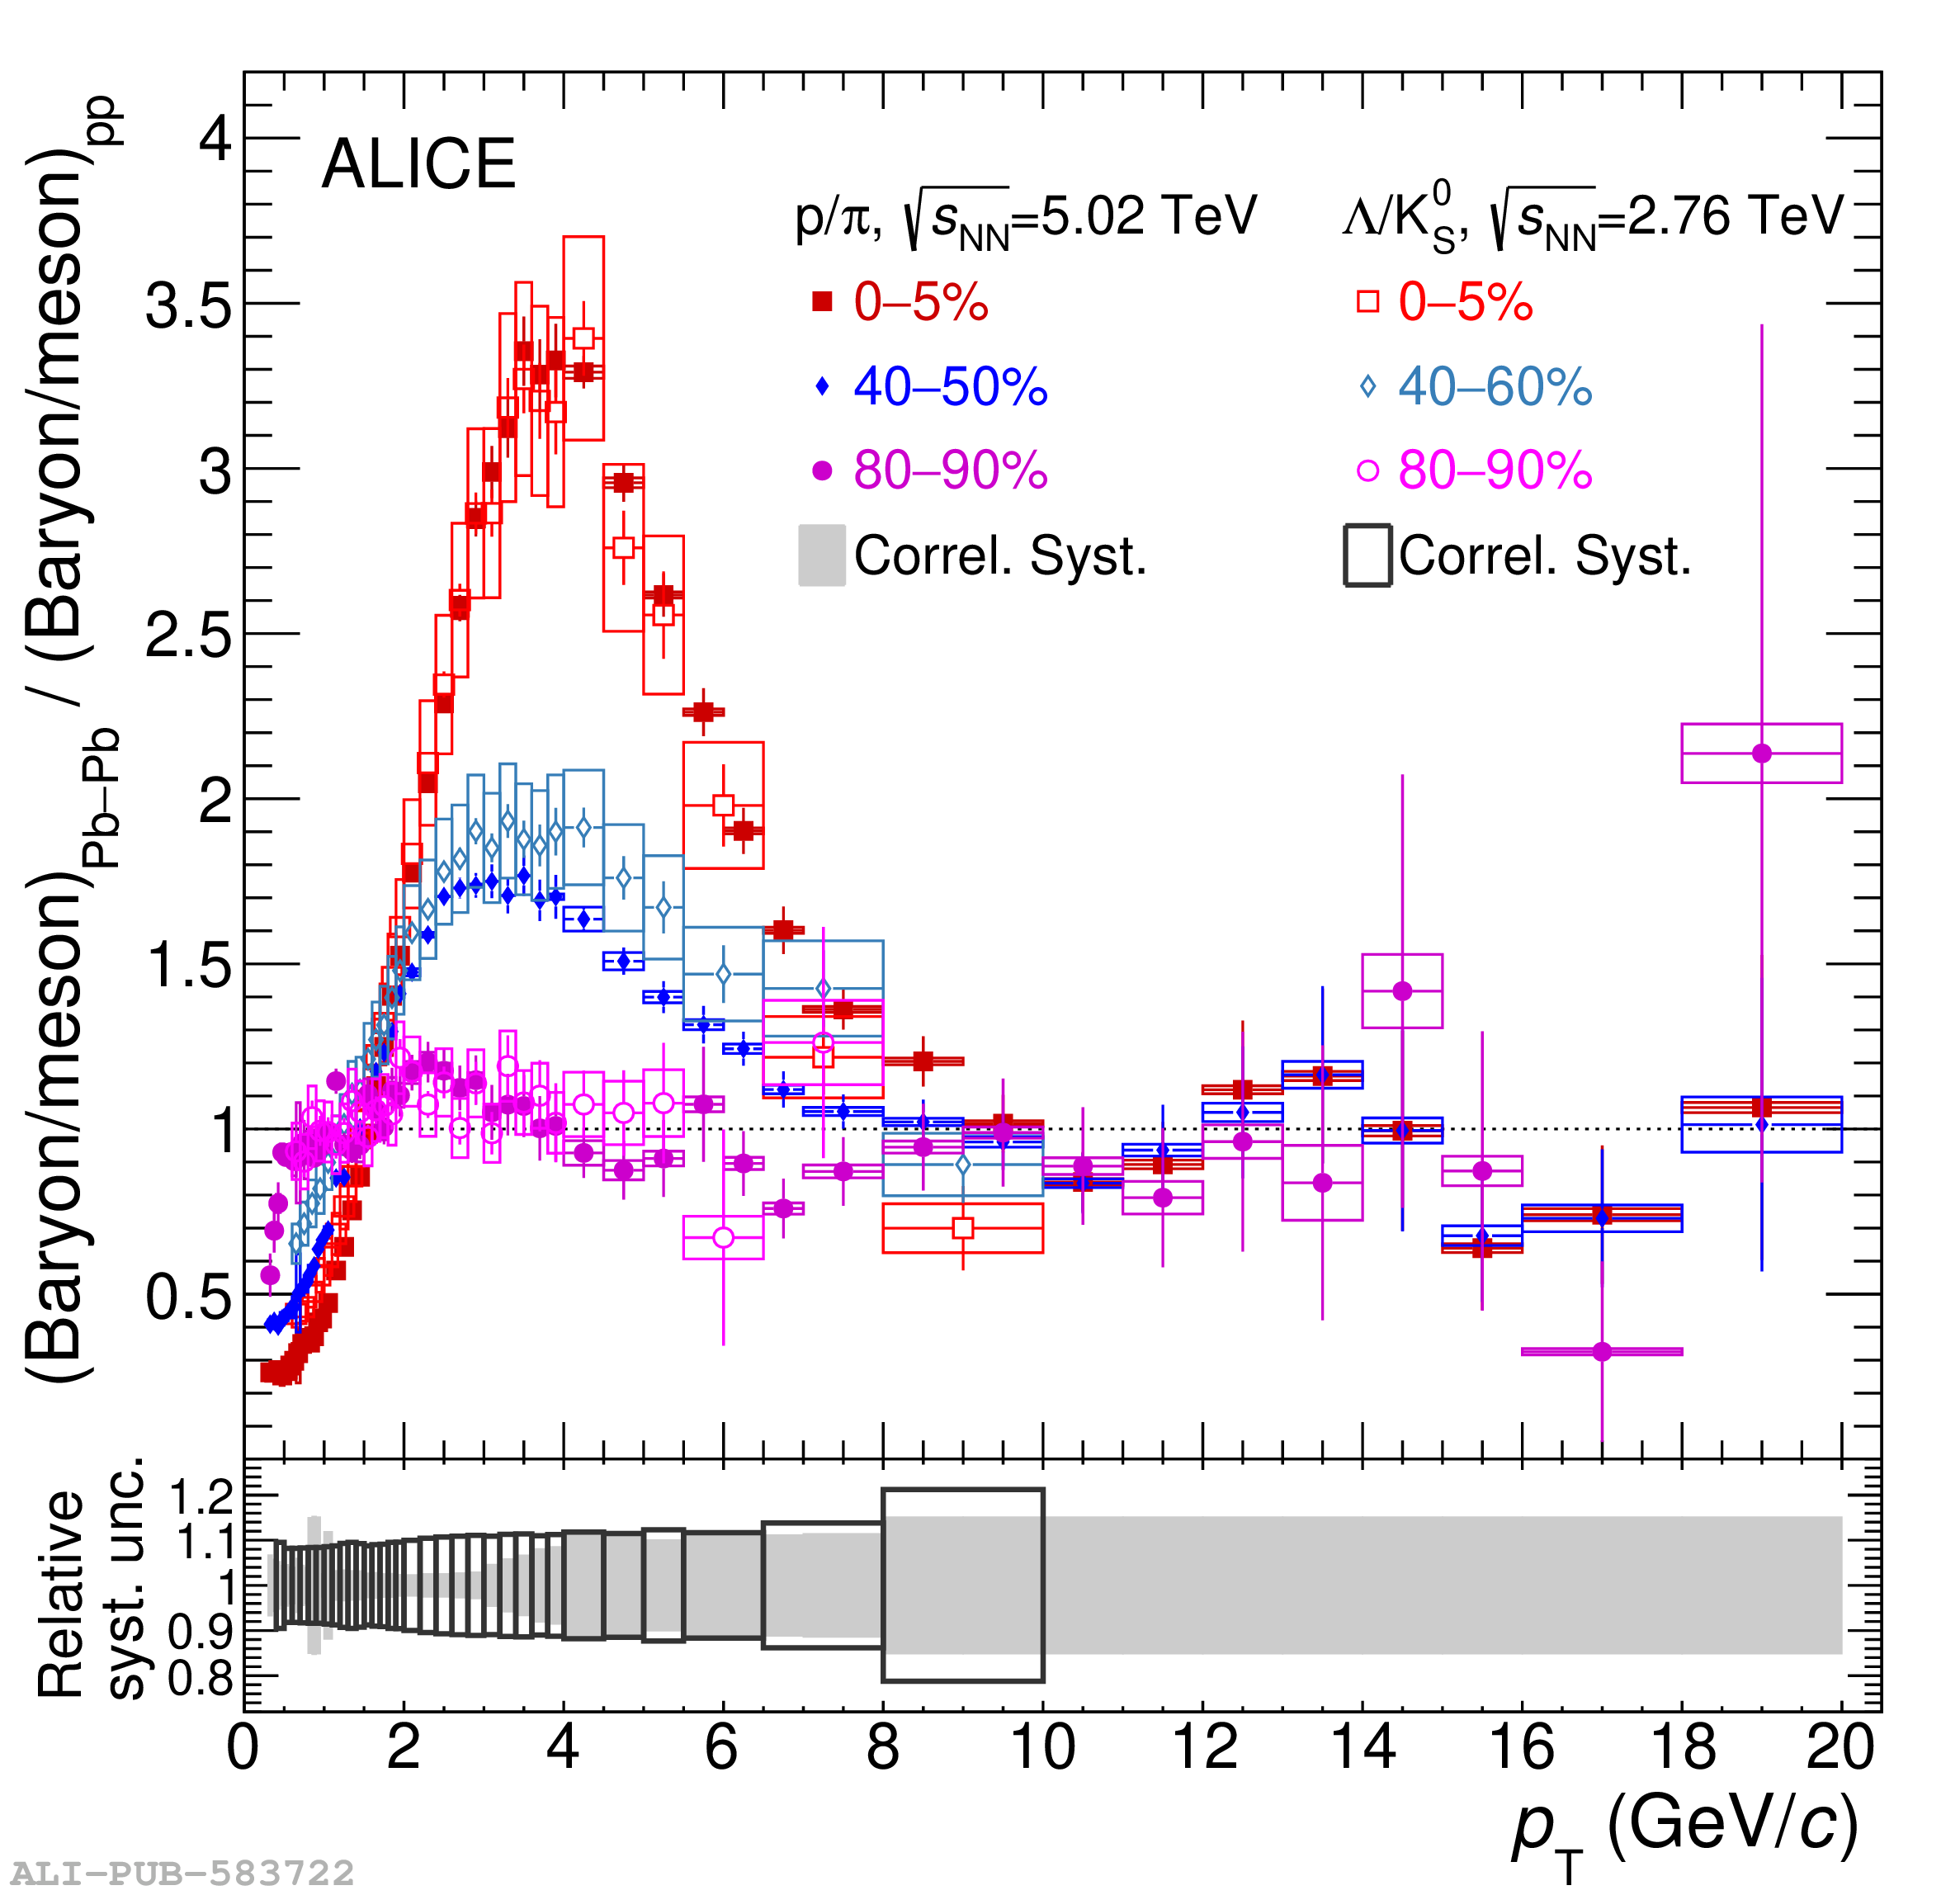
(Left) \pT-differential \ratioLamOverKzs  ratio in \PbPb\ collisions at \sqrtSnn = 2.76 \tev\ compared to pp collisions at \sqrtS = 7 \tev\ for the inclusive production  and for the production in jets . (Right) \pT-differential double ratios (baryon/meson ratios in \PbPb\ divided by the \pp\ ones at a same colliding energy) for \proton/\Pion{} at \sqrtSnn = 5.02 \tev  and \ratioLamOverKzs{} at \sqrtSnn = 2.76 \tev . Results are shown for several centrality intervals. Systematic uncertainties are shown as boxes while statistical uncertainties as vertical bars. The relative systematic uncertainty on the pp results in the double ratios, which is correlated among the different centrality intervals of the \PbPb\ measurements is displayed separately in the lower panel.

Figure 37

Comparison of \rmPiPM, p+\pbar , and \rmPhiMes  transverse-momentum spectra in 10--20\% central \PbPb\ collisions at \sqrtSnn = 5.02 \tev\ to VISHNU , EPOS v3.4 , and CoLBT  models. The systematic uncertainties are represented as boxes while the statistical uncertainties are shown as vertical bars.

Figure 38

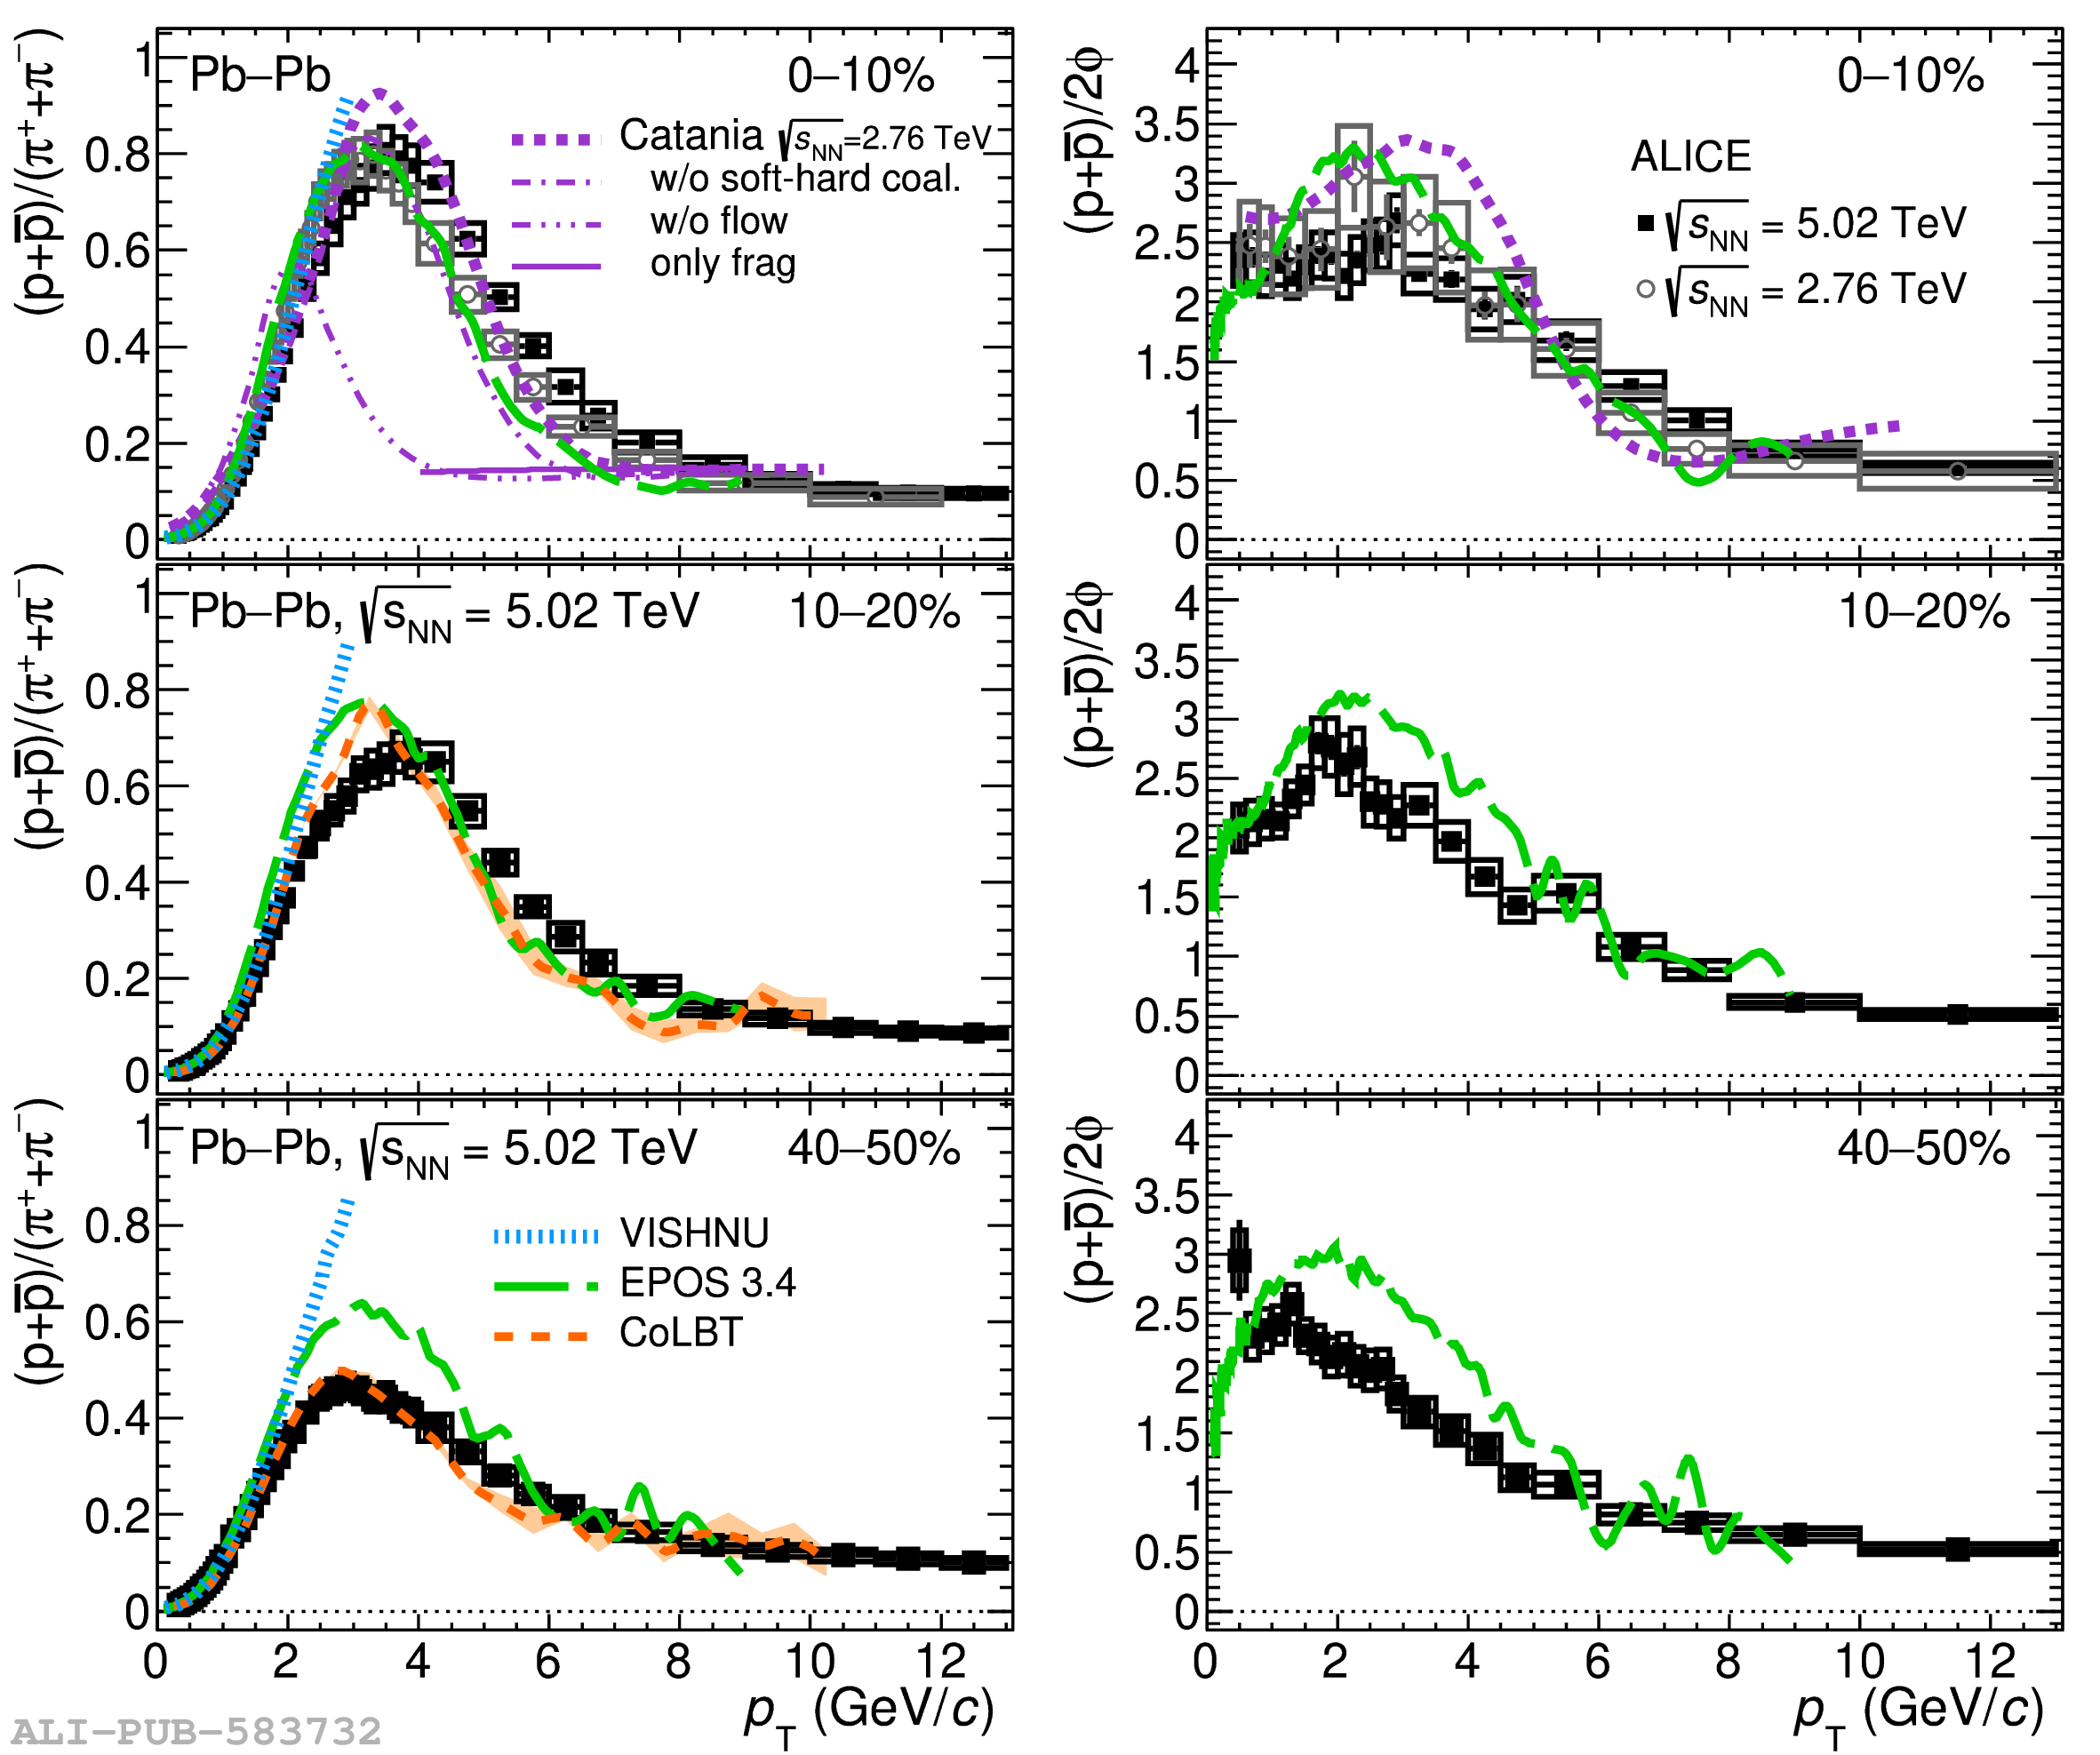
Comparison of \proton/\Pion{} (left) and (\proton+\pbar)/(2\rmPhi) (right) in \mbox{0--10\%}, \mbox{10--20\%}, and 40--50\% \PbPb\ collisions to the VISHNU , EPOS v3.4 , Catania , and CoLBT  models as illustrated in the legend. More details on the different Catania model components can be found in the text. The systematic uncertainties are represented as boxes while the statistical uncertainties are shown as vertical bars.

Figure 39

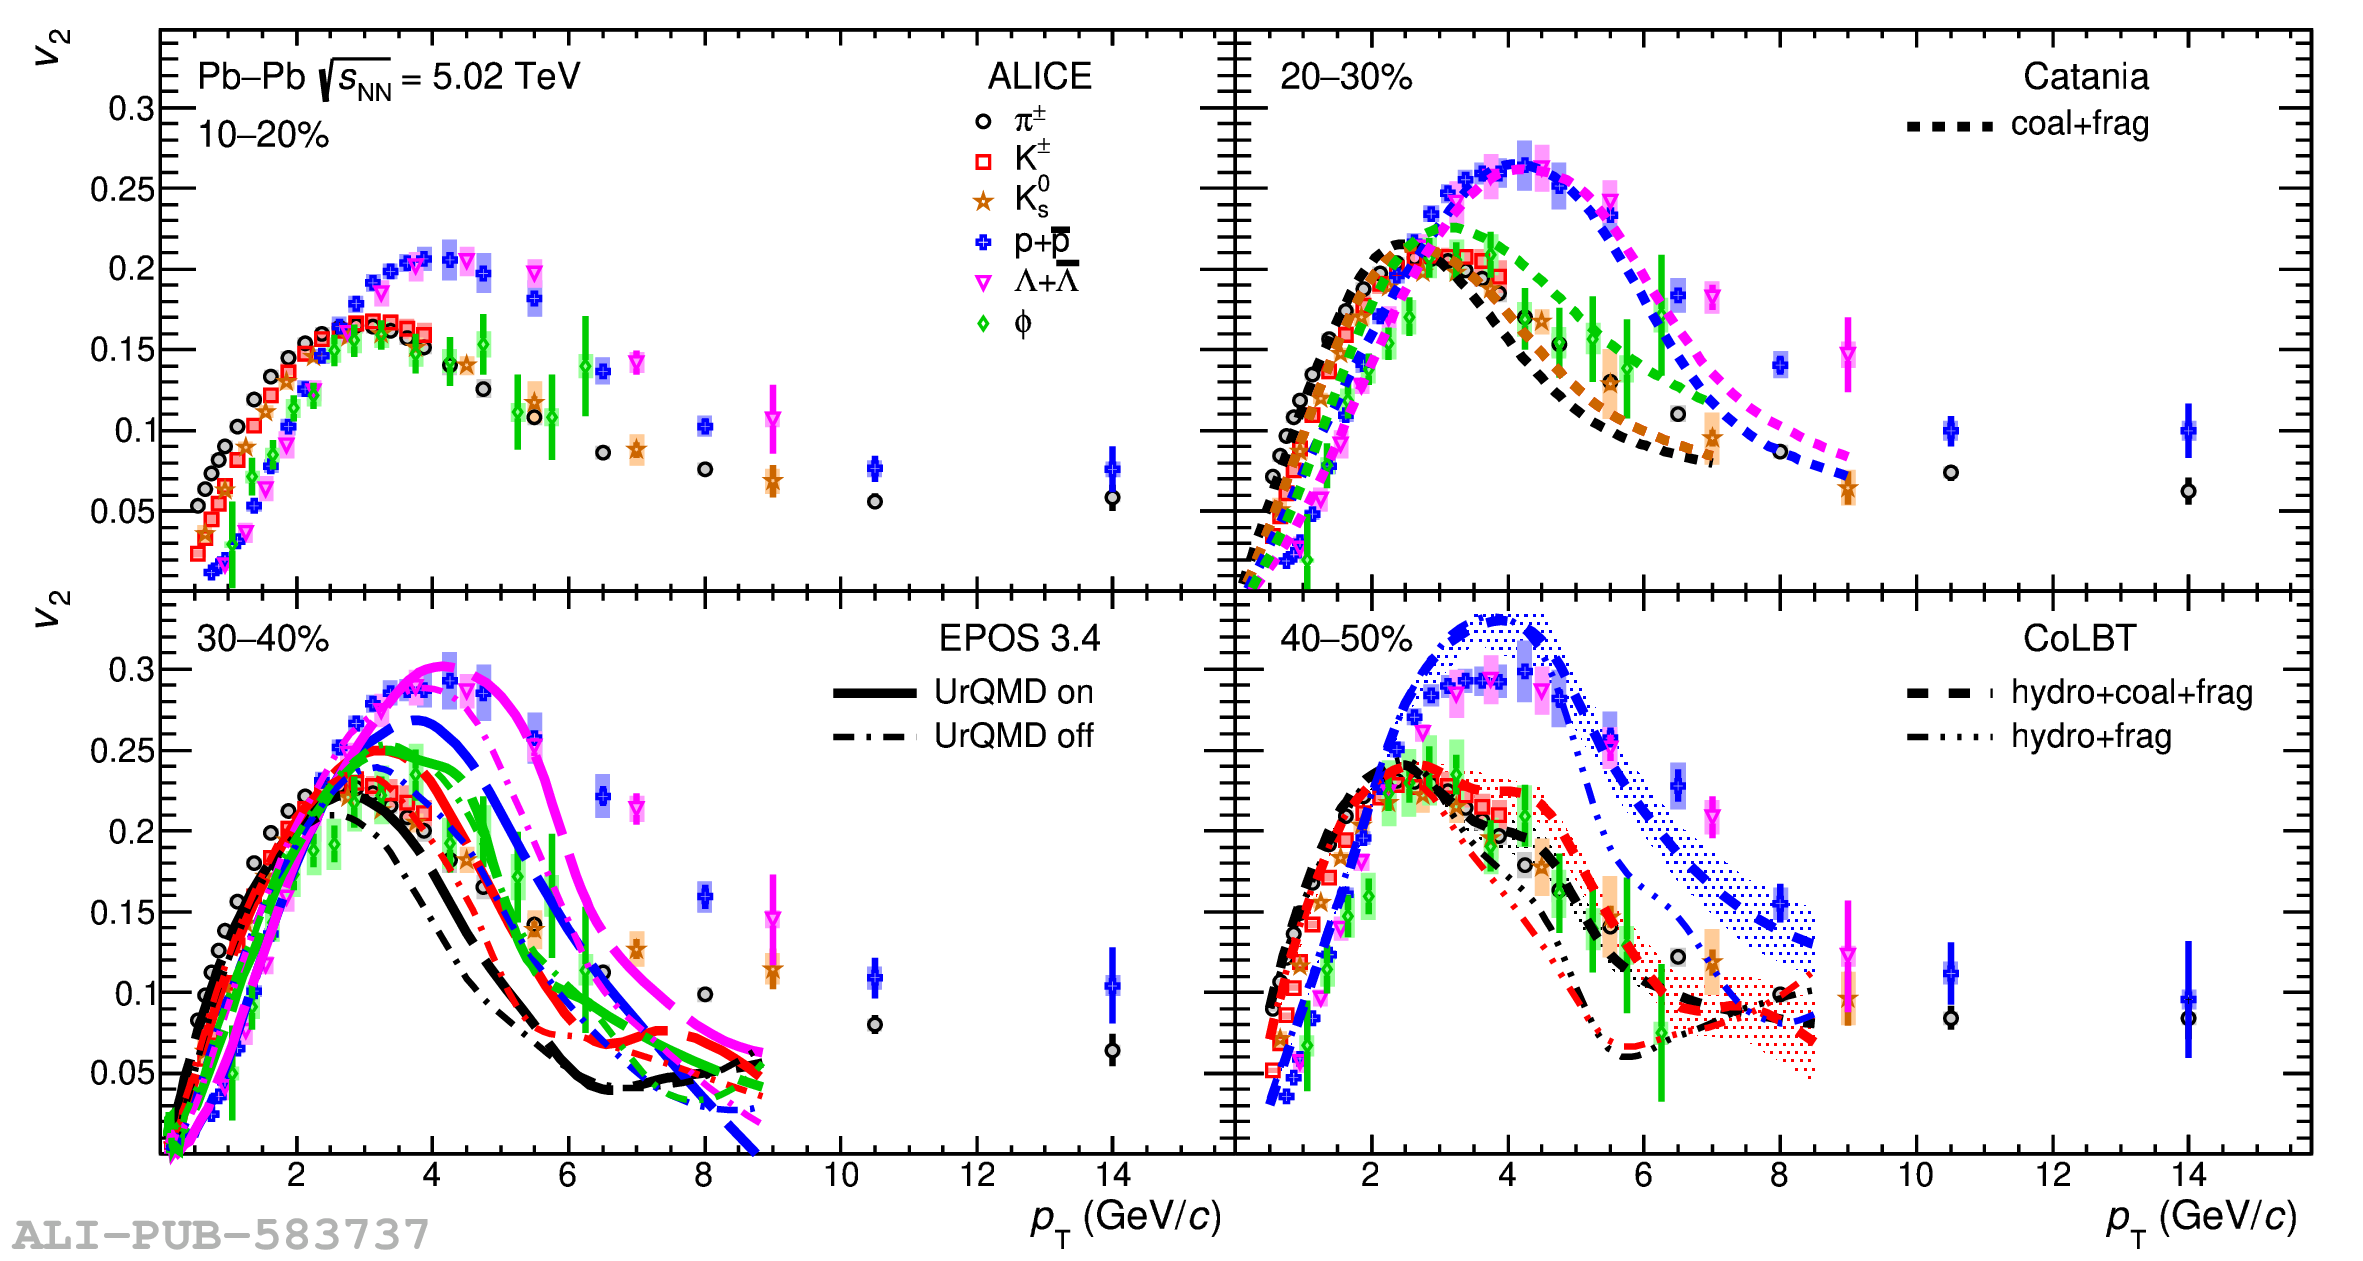
\pT-differential \vTwo{} for several particle species in \PbPb{} collisions at \sqrtSnn = 5.02 \tev\ for different centrality classes  compared to the Catania , EPOS 3.4 , and CoLBT  models.

Figure 40

\rmDs/\rmDzero  (left) and \rmLambdaC/\rmDzero  (right) yield ratios as a function of \pT{} in pp collisions and in the 10\% most central \PbPb{} collisions at \sqrtSnn = 5.02 \tev\ compared to different model calculations, namely Catania , TAMU , POWLANG , and the GSI-Heidelberg statistical hadronisation model .

Figure 41

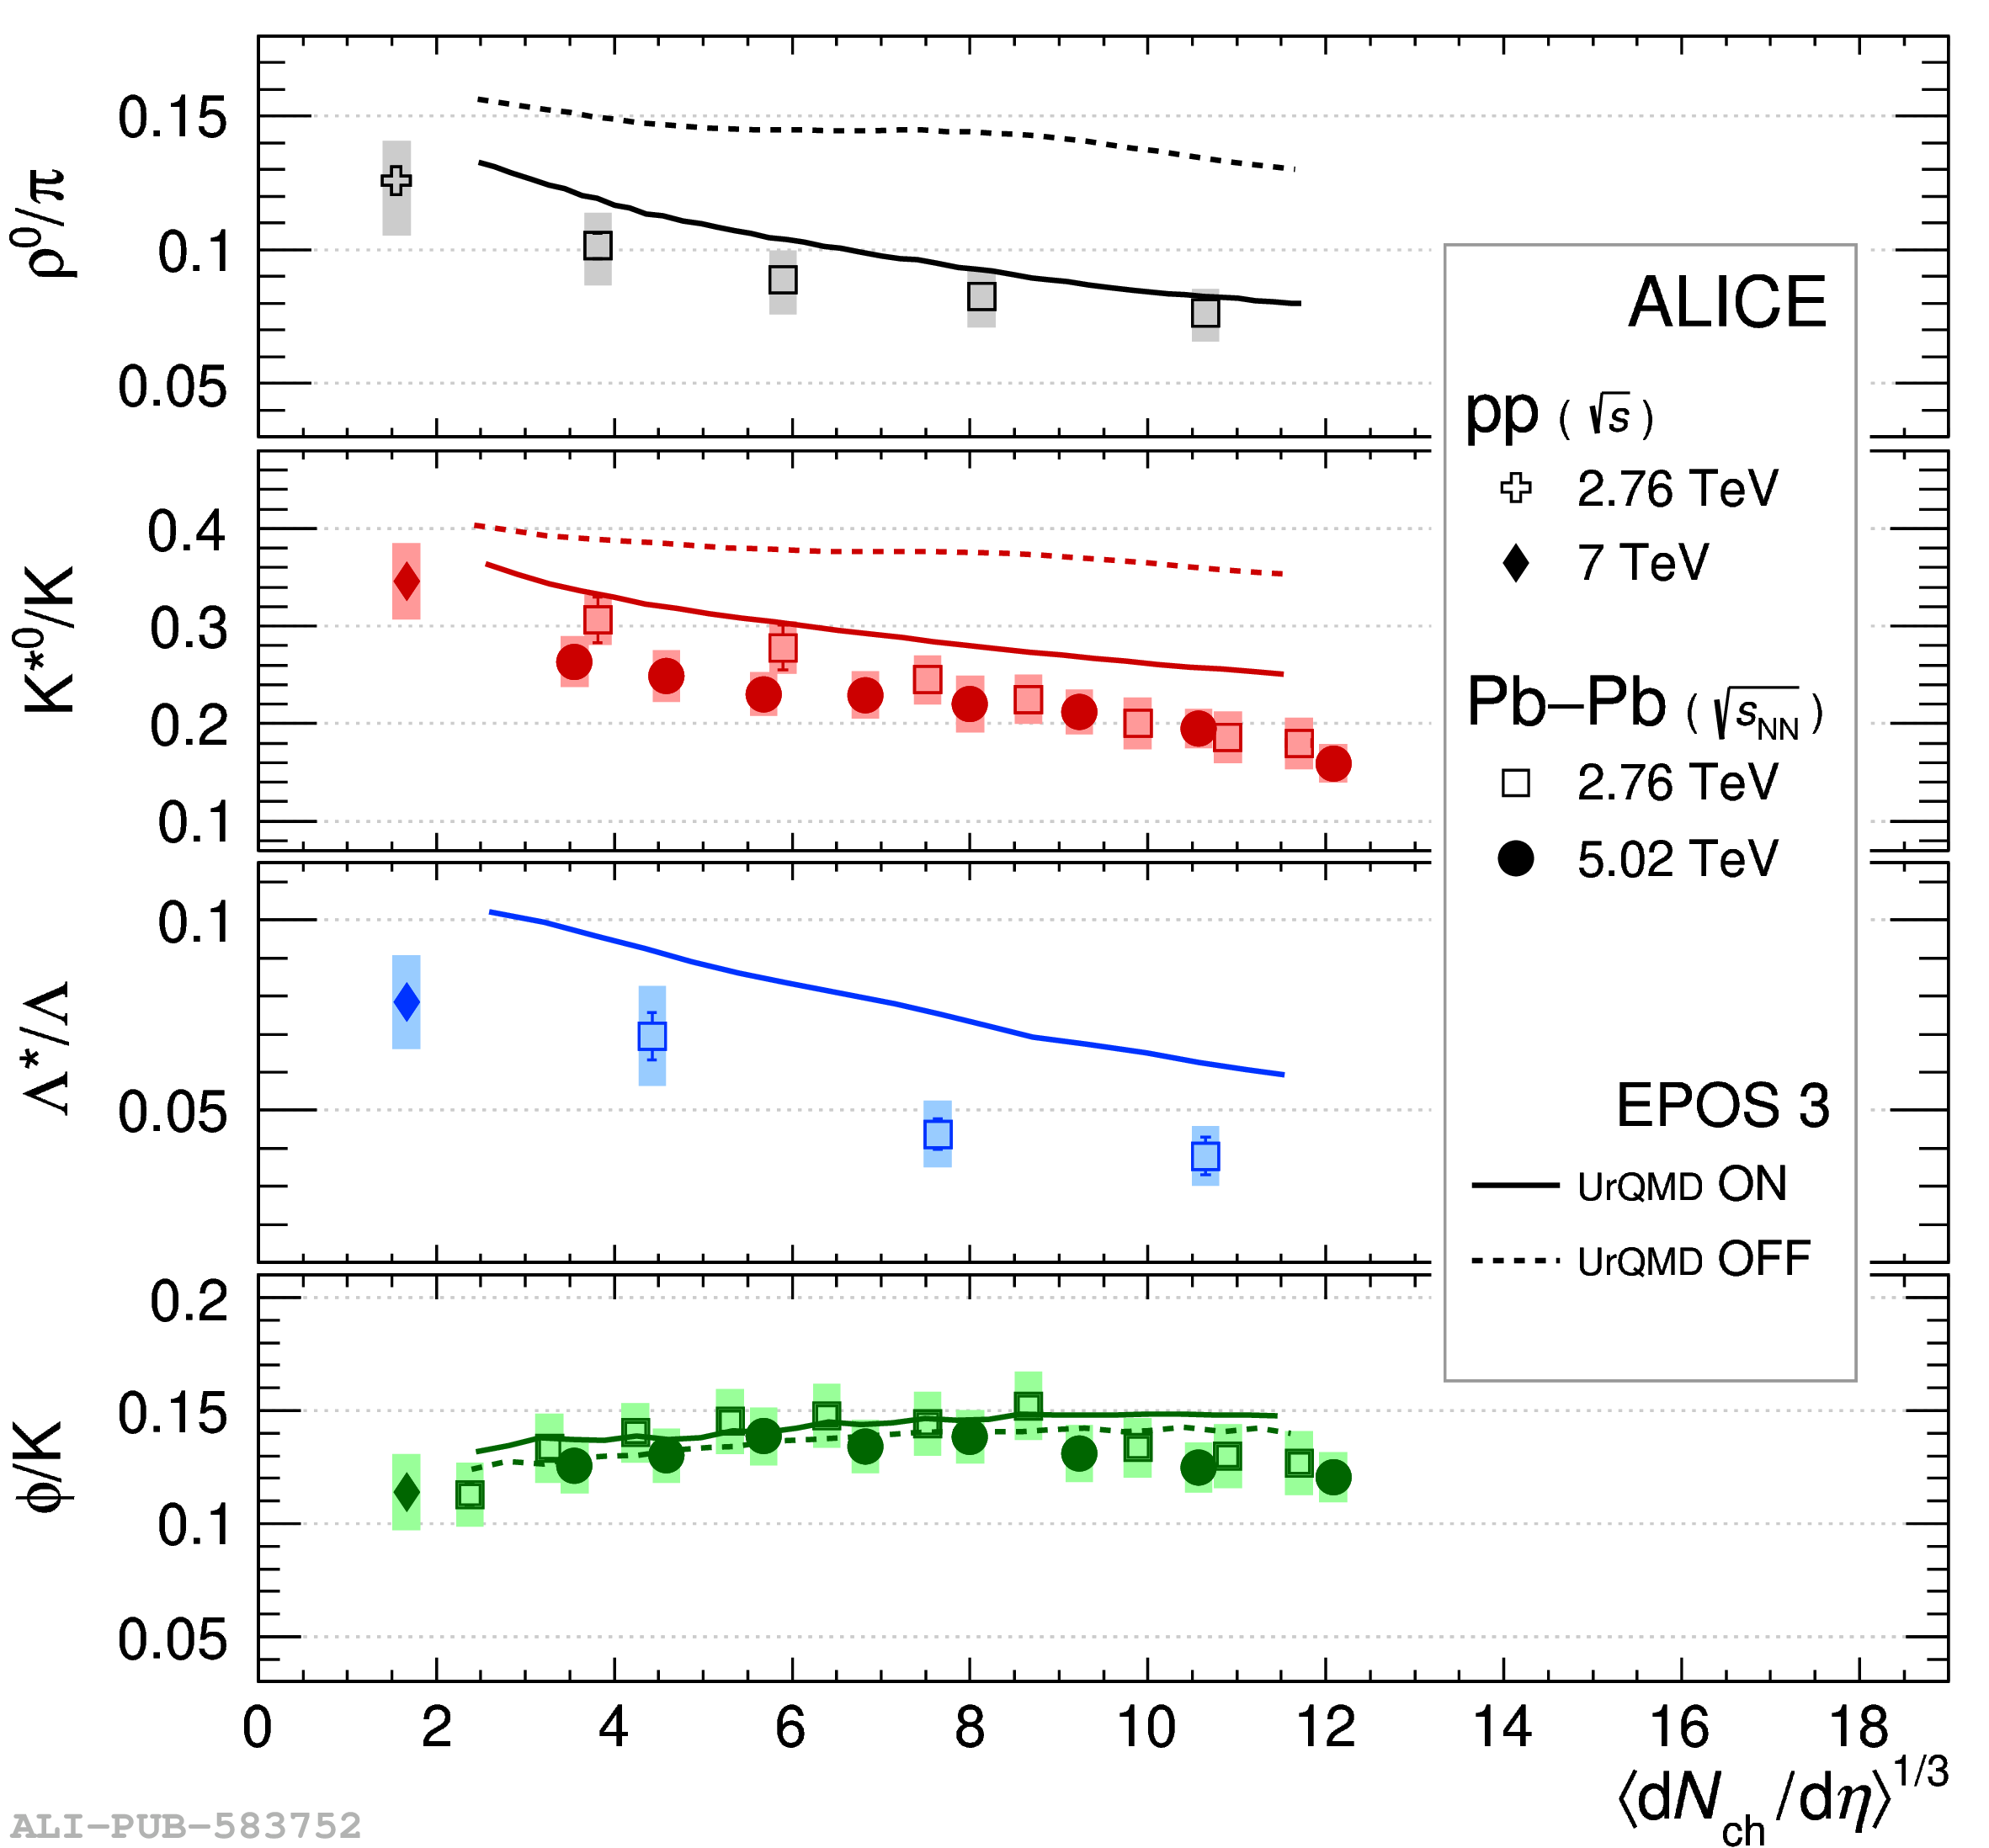
(Left) Ratios of midrapidity yields between resonances and ground-state hadrons of similar valence-quark content, as a function of $\langle$\dNchdeta$\rangle^{1/3}$. These are obtained for inelastic \pp{} collisions (\sqrtS{} = 2.76 \tev\ and 7 \tev ) and for \PbPb\ collisions (\sqrtSnn{} = 2.76 \tev  and 5.02 \tev ) ranging from peripheral to most central overlaps. Error bars and boxes represent the statistical and the total systematic uncertainty, respectively. Model predictions are from EPOS3 with and without UrQMD . (Right) Transverse-momentum distributions of \rmKstar{} at \sqrtSnn{} = 5.02 \tev  for central and peripheral collisions compared with predictions from EPOS3 (with and without UrQMD) and from a blast-wave model with a dedicated treatment of resonances (BW FastReso) .

Figure 42

(Left) Hadronic phase duration (time span between chemical and kinetic freeze-out) as a function of $\langle$\dNchdeta$\rangle^{1/3}$ calculated from the $\rho/\pi$, K$^*/$K and $\Lambda^*/\Lambda$ ratios in \PbPb\ collisions at \sqrtSnn{} = 2.76 \tev . The $\rho/\pi$ results are shifted horizontally by 0.1 units for visibility. (Right) Pion–kaon emission asymmetry for \PbPb\ collisions at \sqrtSnn{} = 2.76 \tev\ as a function of $\langle$\dNchdeta$\rangle^{1/3}$ . The shaded areas show predictions from the THERMINATOR 2 model with default and selected values of additional delay $\Delta\tau$ for kaons .

Figure 43

D-meson production in \PbPb\ collisions at \sqrtsNN = 5.02 TeV . (Left) \RAA\ in 0--10\% collisions; (right) $v_2$ in 30--50\% collisions. Model calculations implement charm-quark transport in a hydrodynamically expanding QGP (see text for references).

Figure 44

Data from Fig. \ref{Fig:HFTransport}compared with calculations from the LIDO  and LGR  models using several variations of charm-quark interactions and hadronisation; see text for details.

Figure 45

Nuclear modification factor \RAA\ for charged hadrons  in central and peripheral \PbPb{} collisions and NSD \pPb{} collisions (top), and for various particle species in central \PbPb{} collisions  (bottom). Isolated photons measured by CMS are also included for comparison .

Figure 46

Comparisons of the \pT-differential \RAA\ (upper panels) and $v_2$ (lower panels) measured for charged pions  and hadrons, prompt D mesons , non-prompt D$^0$ mesons (\RAA\ only ), and electrons from beauty-hadron decays ($v_2$ only ) in the 10\% most central (\RAA\,) and 30--50\% semi-central ($v_2$) Pb--Pb collisions at \sqrtsNN = 5.02 TeV with calculations using the DREENA-A  (left panels) and CUJET3.1  (right panels) models. A global normalisation uncertainty of 3\% on \RAA\ is not shown in the figure.

Figure 47

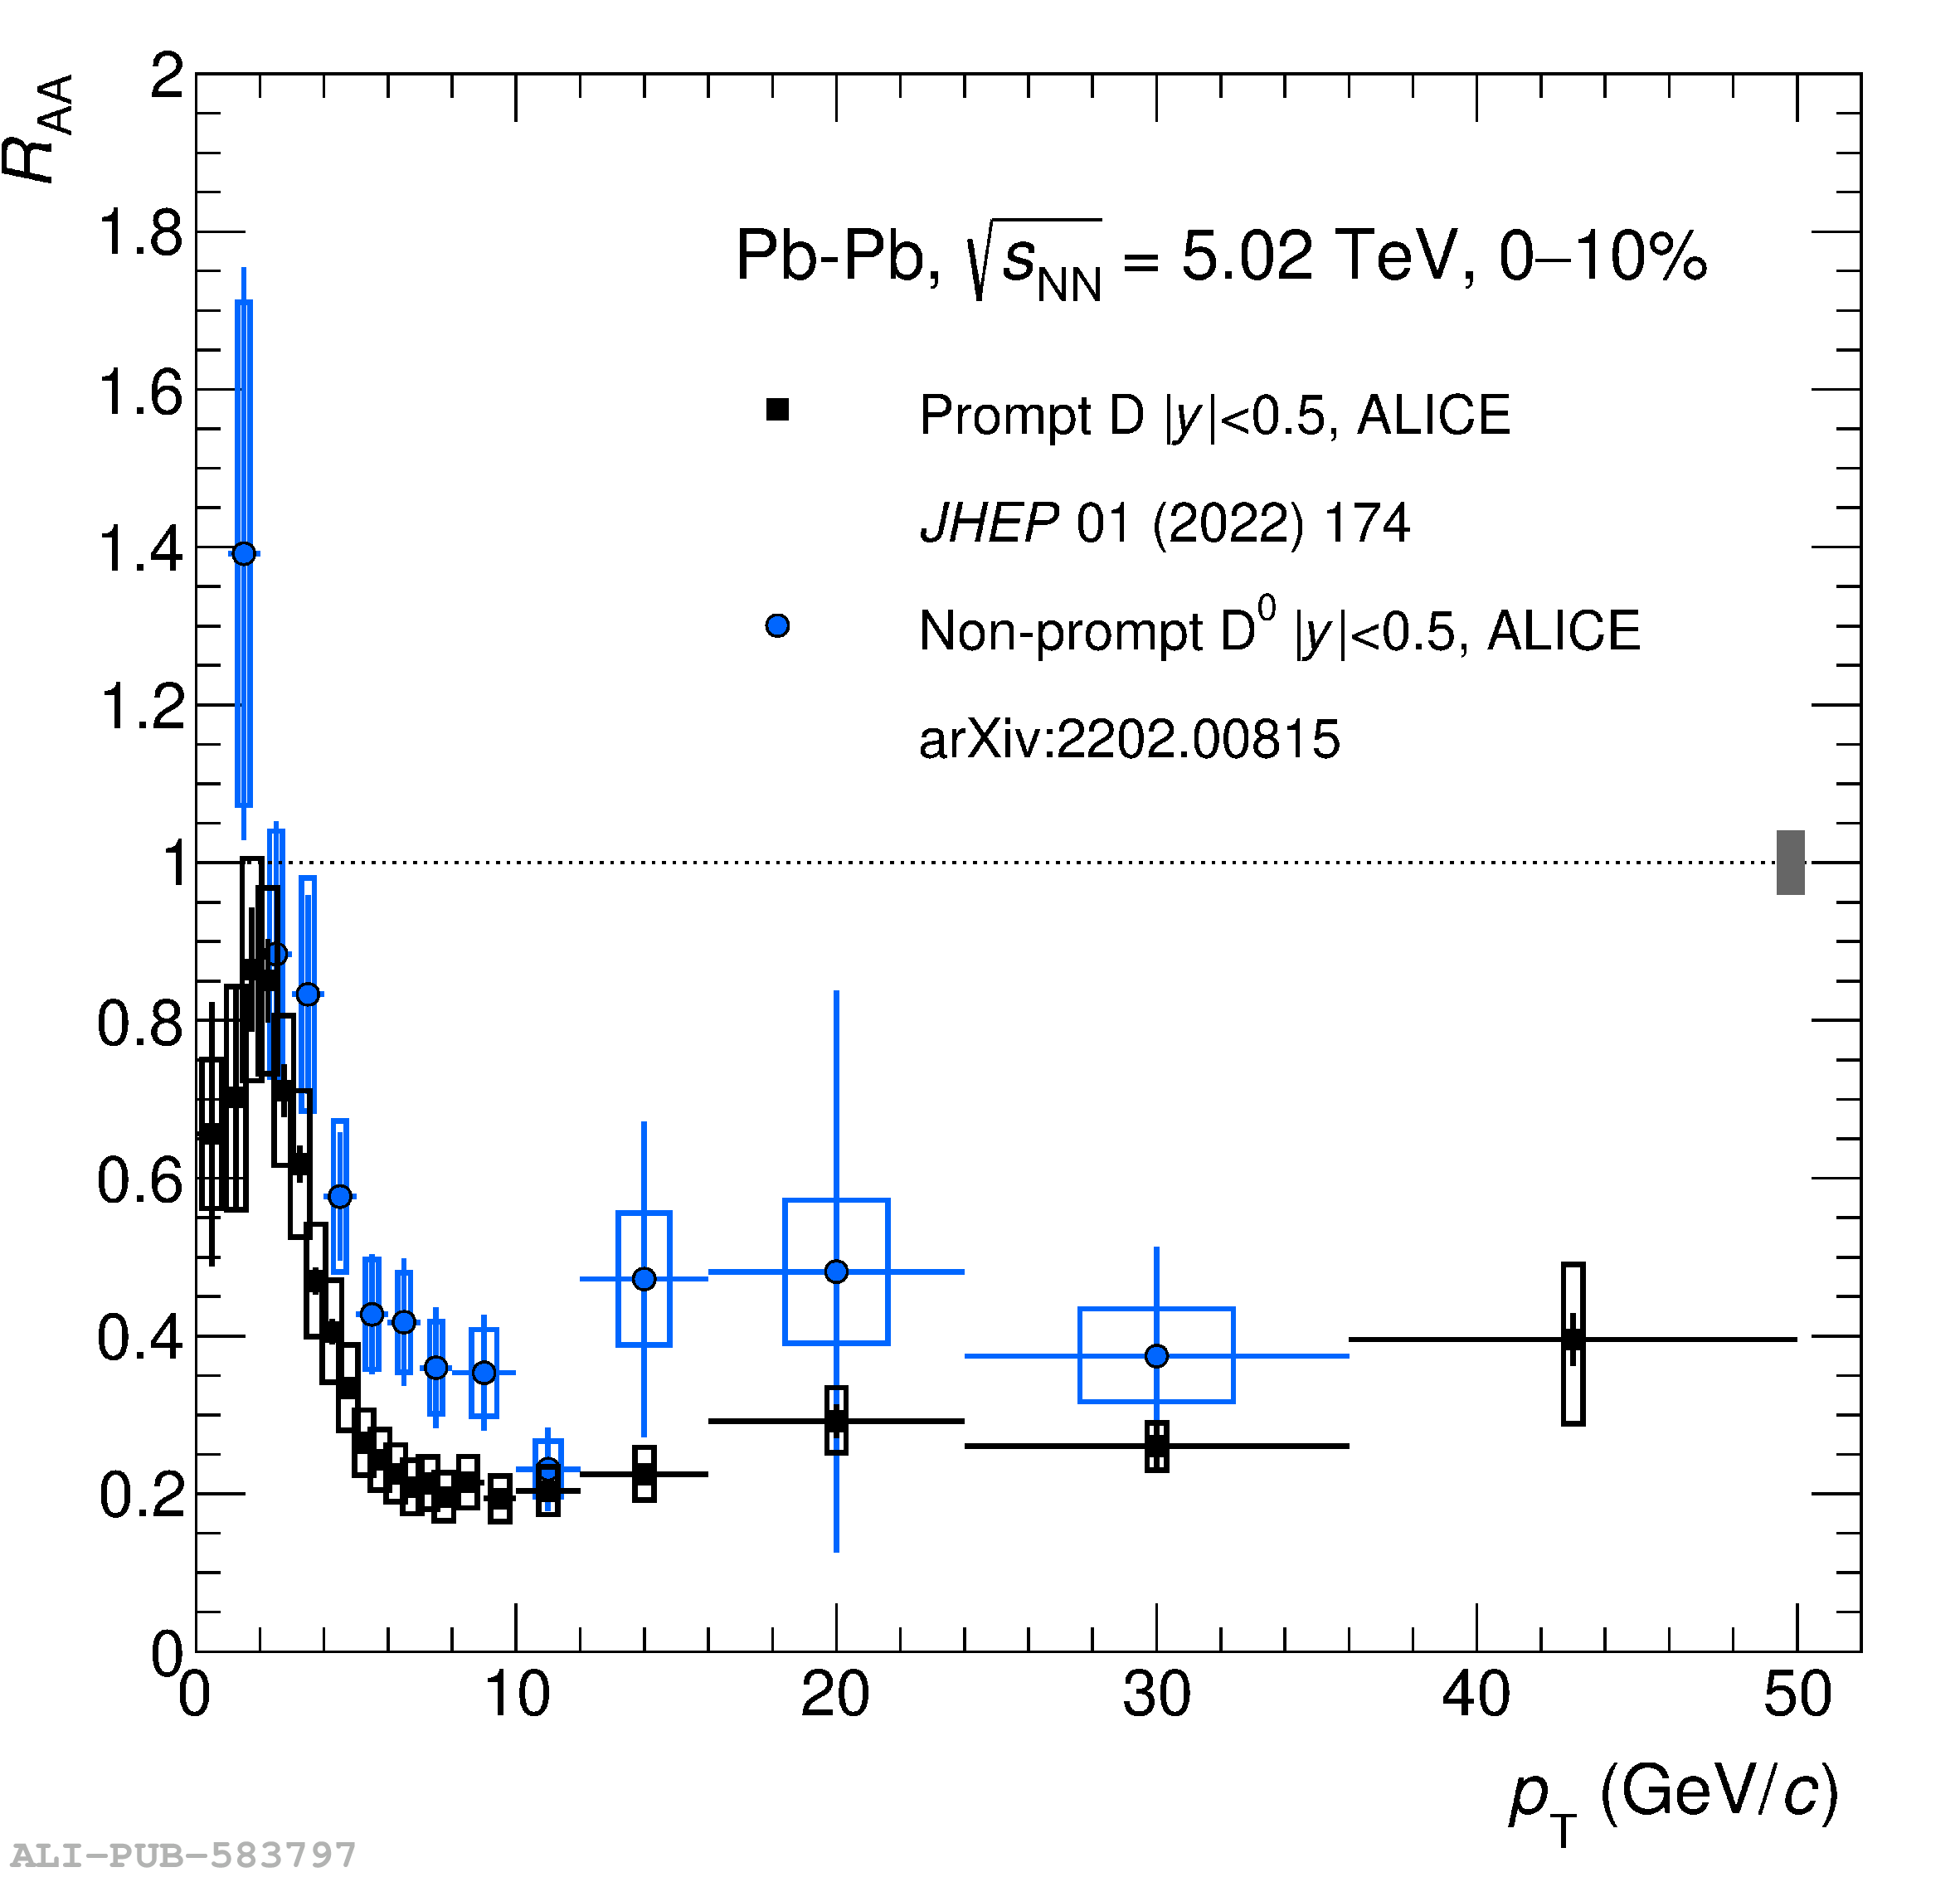
(Left) \RAA\ for prompt and non-prompt D mesons as a function of \pT\, in the 10\% most central \PbPb\ collisions at \sqrtsNN = 5.02 TeV . (Right) \RAA\ for prompt D mesons  and non-prompt J/$\psi$ mesons (CMS ) as a function of the collision centrality for Pb--Pb collisions at \sqrtsNN = 2.76 TeV, compared to a model calculation with mass-dependent energy loss .

Figure 48

(Top) Measurement of the \pT-differential \RAA\ for muons and electrons from heavy-flavour hadron decays at forward ($2.5 y 4$) and midrapidity ($|y| 0.8$), respectively, in $0-10\%$ Pb--Pb collisions at $\sqrt{s_{\rm NN}} = 5.02$ TeV , with comparison to MC@sHQ+EPOS2 calculations . Statistical (vertical bars) and systematic (open boxes) uncertainties are shown. The filled boxes centered at \RAA\ = 1 represent the normalisation uncertainty. (Bottom) \pT-differential \RAA\ of muons from heavy-flavour hadron decays is compared with MC@sHQ+EPOS2 calculations with pure collisional energy loss (dashed lines) and a combination of collisional and radiative energy loss.

Figure 49

Measurement of \RAA\ for charged hadrons (ALICE  and CMS ) and jets (ALICE  and ATLAS ) in central \PbPb\ collisions. A global normalisation uncertainty of 3\% on \RAA\ is not shown in the figure.

Figure 50

ALICE measurements of \RAA\ for charged hadrons  and jets  in central \PbPb\ collisions compared to calculations from JETSCAPE, JEWEL, and the hybrid model. A global normalisation uncertainty of 3\% on \RAA\ is not shown in the figure.

Figure 51

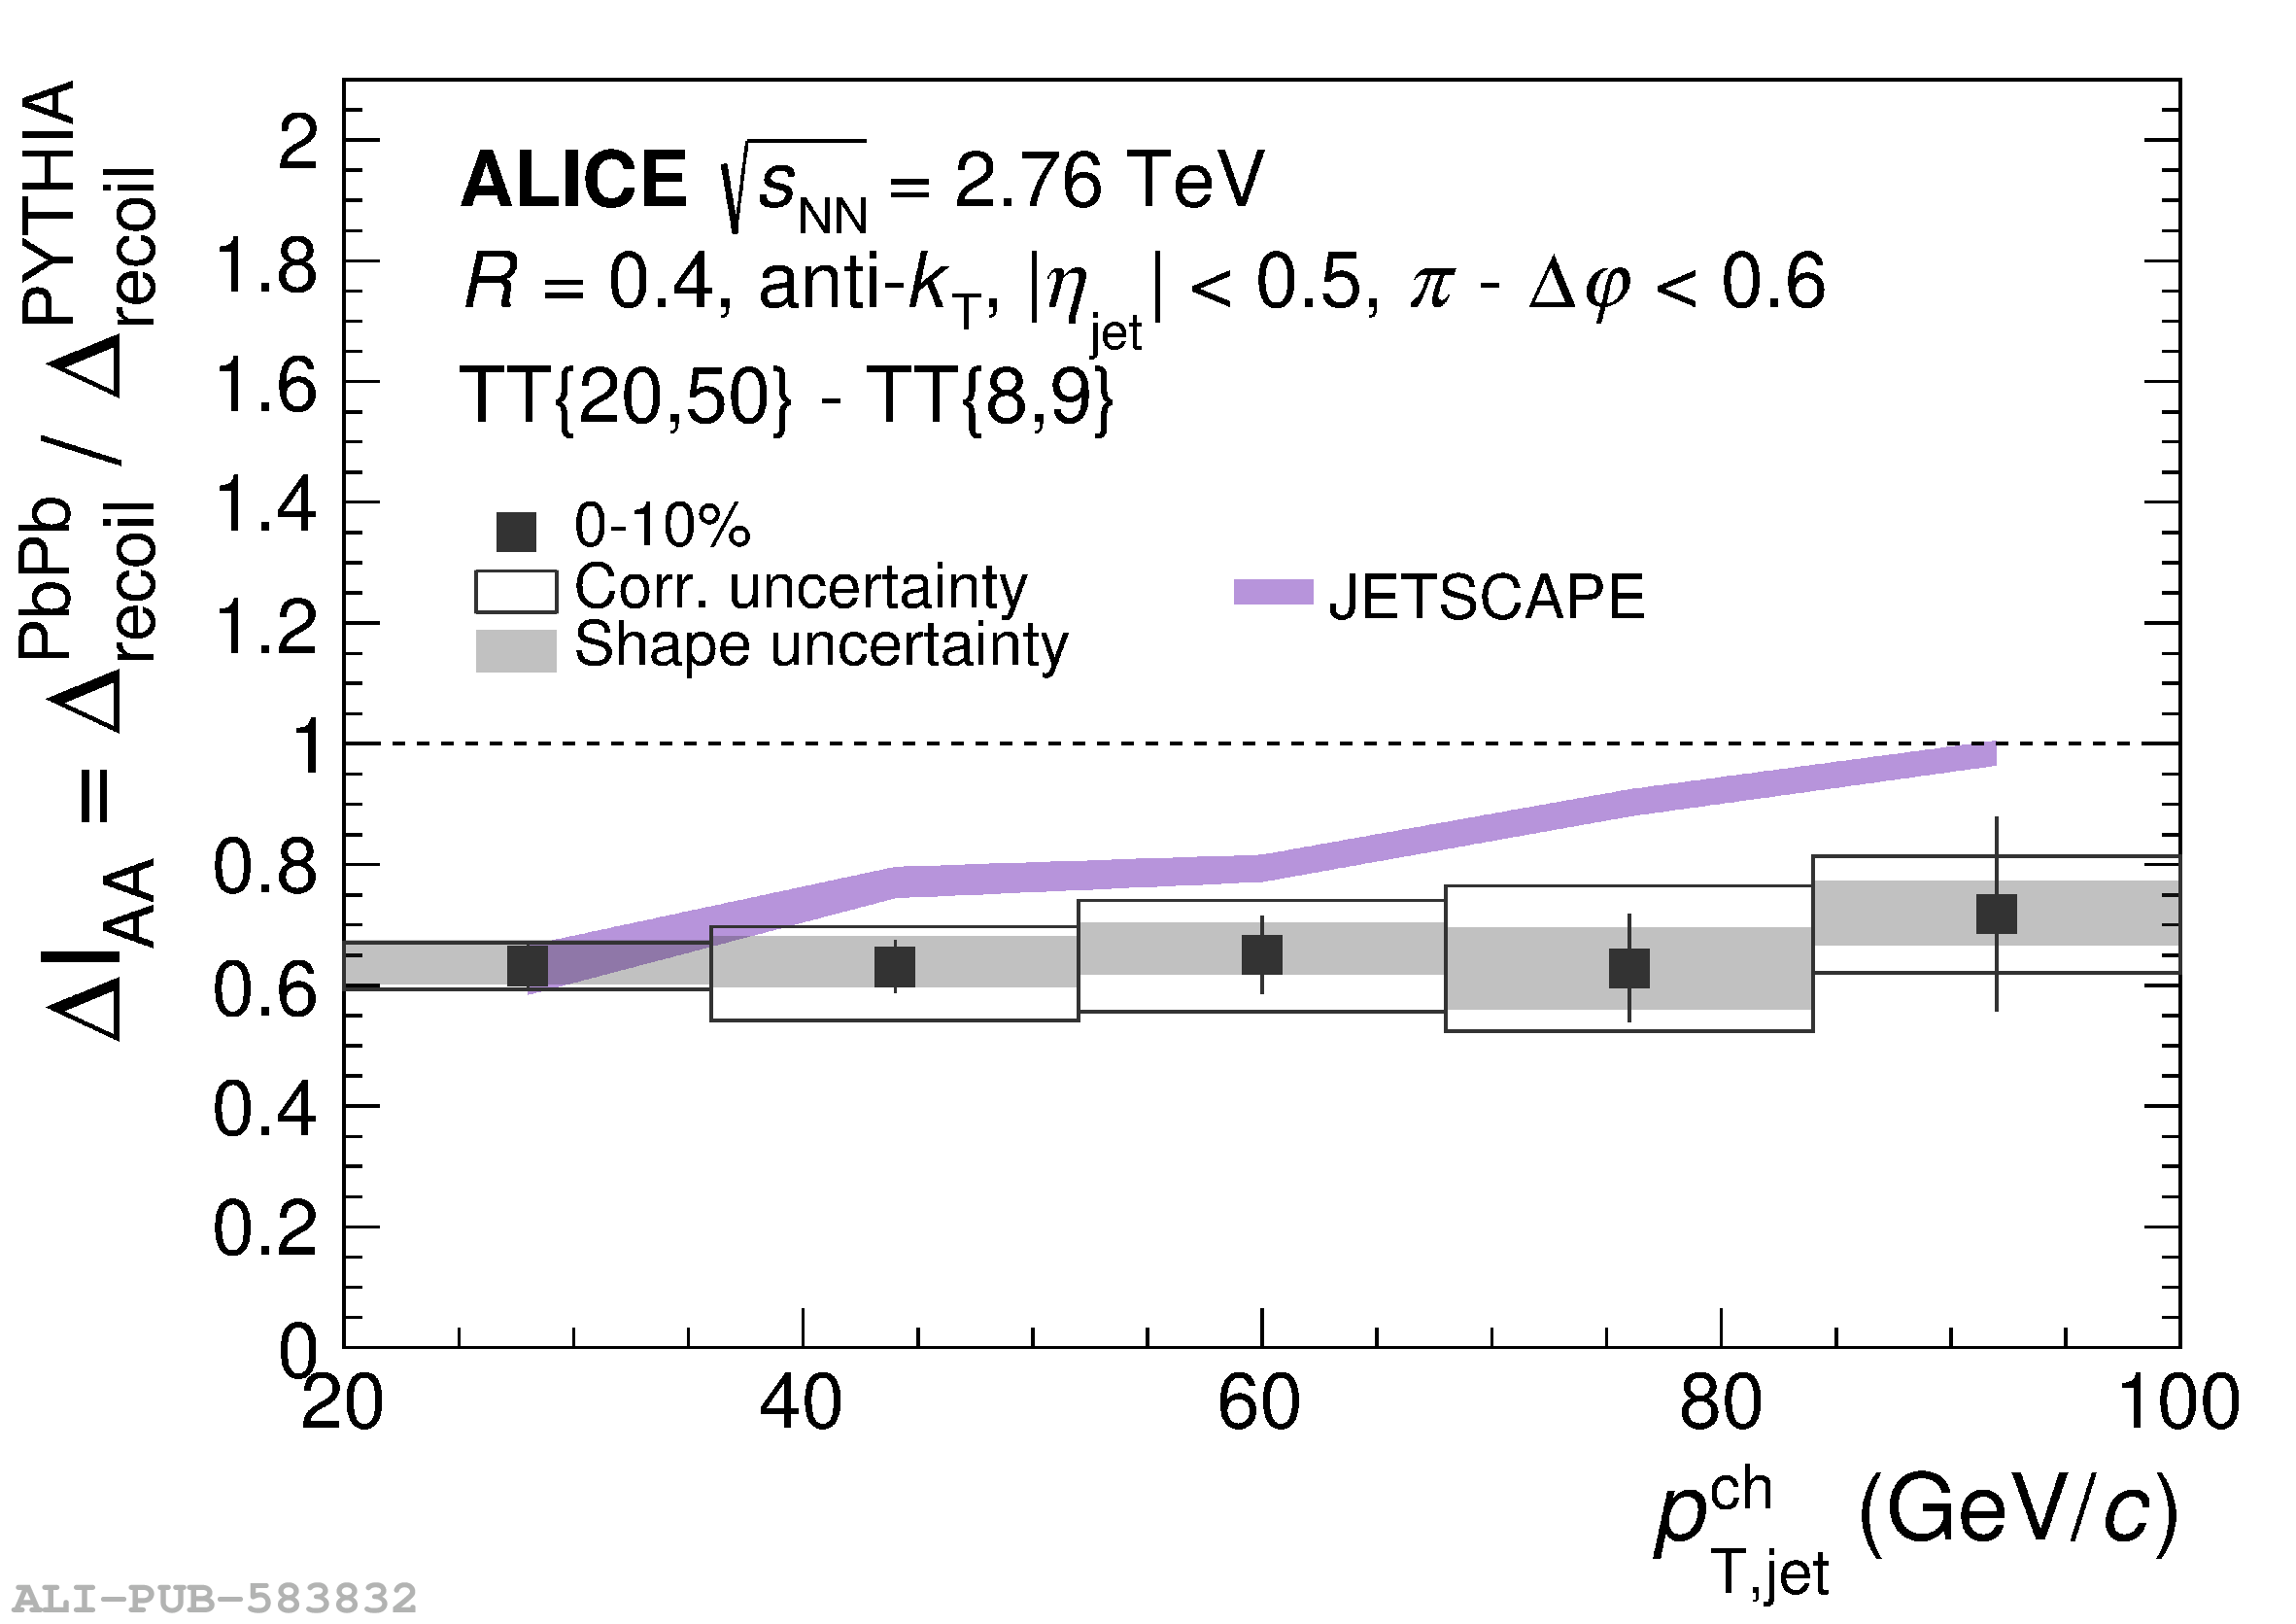
Semi-inclusive hadron+jet coincidence measurement for \PbPb\ collisions at \sqrtsNN = 2.76 TeV  compared to JETSCAPE expectations. The observable $\Delta_\mathrm{recoil}$ is defined in Eq. \ref{eq:DeltaRecoil}. The notation “${\rm TT}\{a,b\}$” refers to a trigger hadron within the interval $a< p_ and refers to the azimuthal separation between trigger hadron recoil jet. ratio of distribution that for collisions calculated with pythia6 event generator. distributions jets measured central pythia collisions.>< /p_>

Figure 52

Jet $z_{\rm g}$ (left) and $\theta_{\rm g}$ (right) in 0--10\% centrality for $R=0.2$ charged-particle jets . The ratio of the distributions in Pb--Pb and pp collisions is shown in the bottom panels and is compared to various jet quenching calculations.

Figure 53

(Left) Distribution of jet angularity for $R=0.2$ charged-particle jets in 0--10\% central \PbPb\ collisions compared to that for \pp\ collisions calculated with the PYTHIA6 event generator . (Right) Jet mass for $R=0.4$ charged-particle jets in 0--10\% central compared to PYTHIA calculations and various jet quenching models  Systematic uncertainties have not been assigned to the PYTHIA calculations in both panels.

Figure 54

ALICE measurement of h+jet acoplanarity in 0-10\% \PbPb collisions at \sqrtsNN = 2.76 TeV  compared to an embedded PYTHIA+\PbPb reference and JETSCAPE calculations, in pp and \PbPb collisions for charged-particle recoil jets with $R=0.4$ and $40\pTjet60$ \gev. See text for discussion of JETSCAPE calculations.

Figure 55

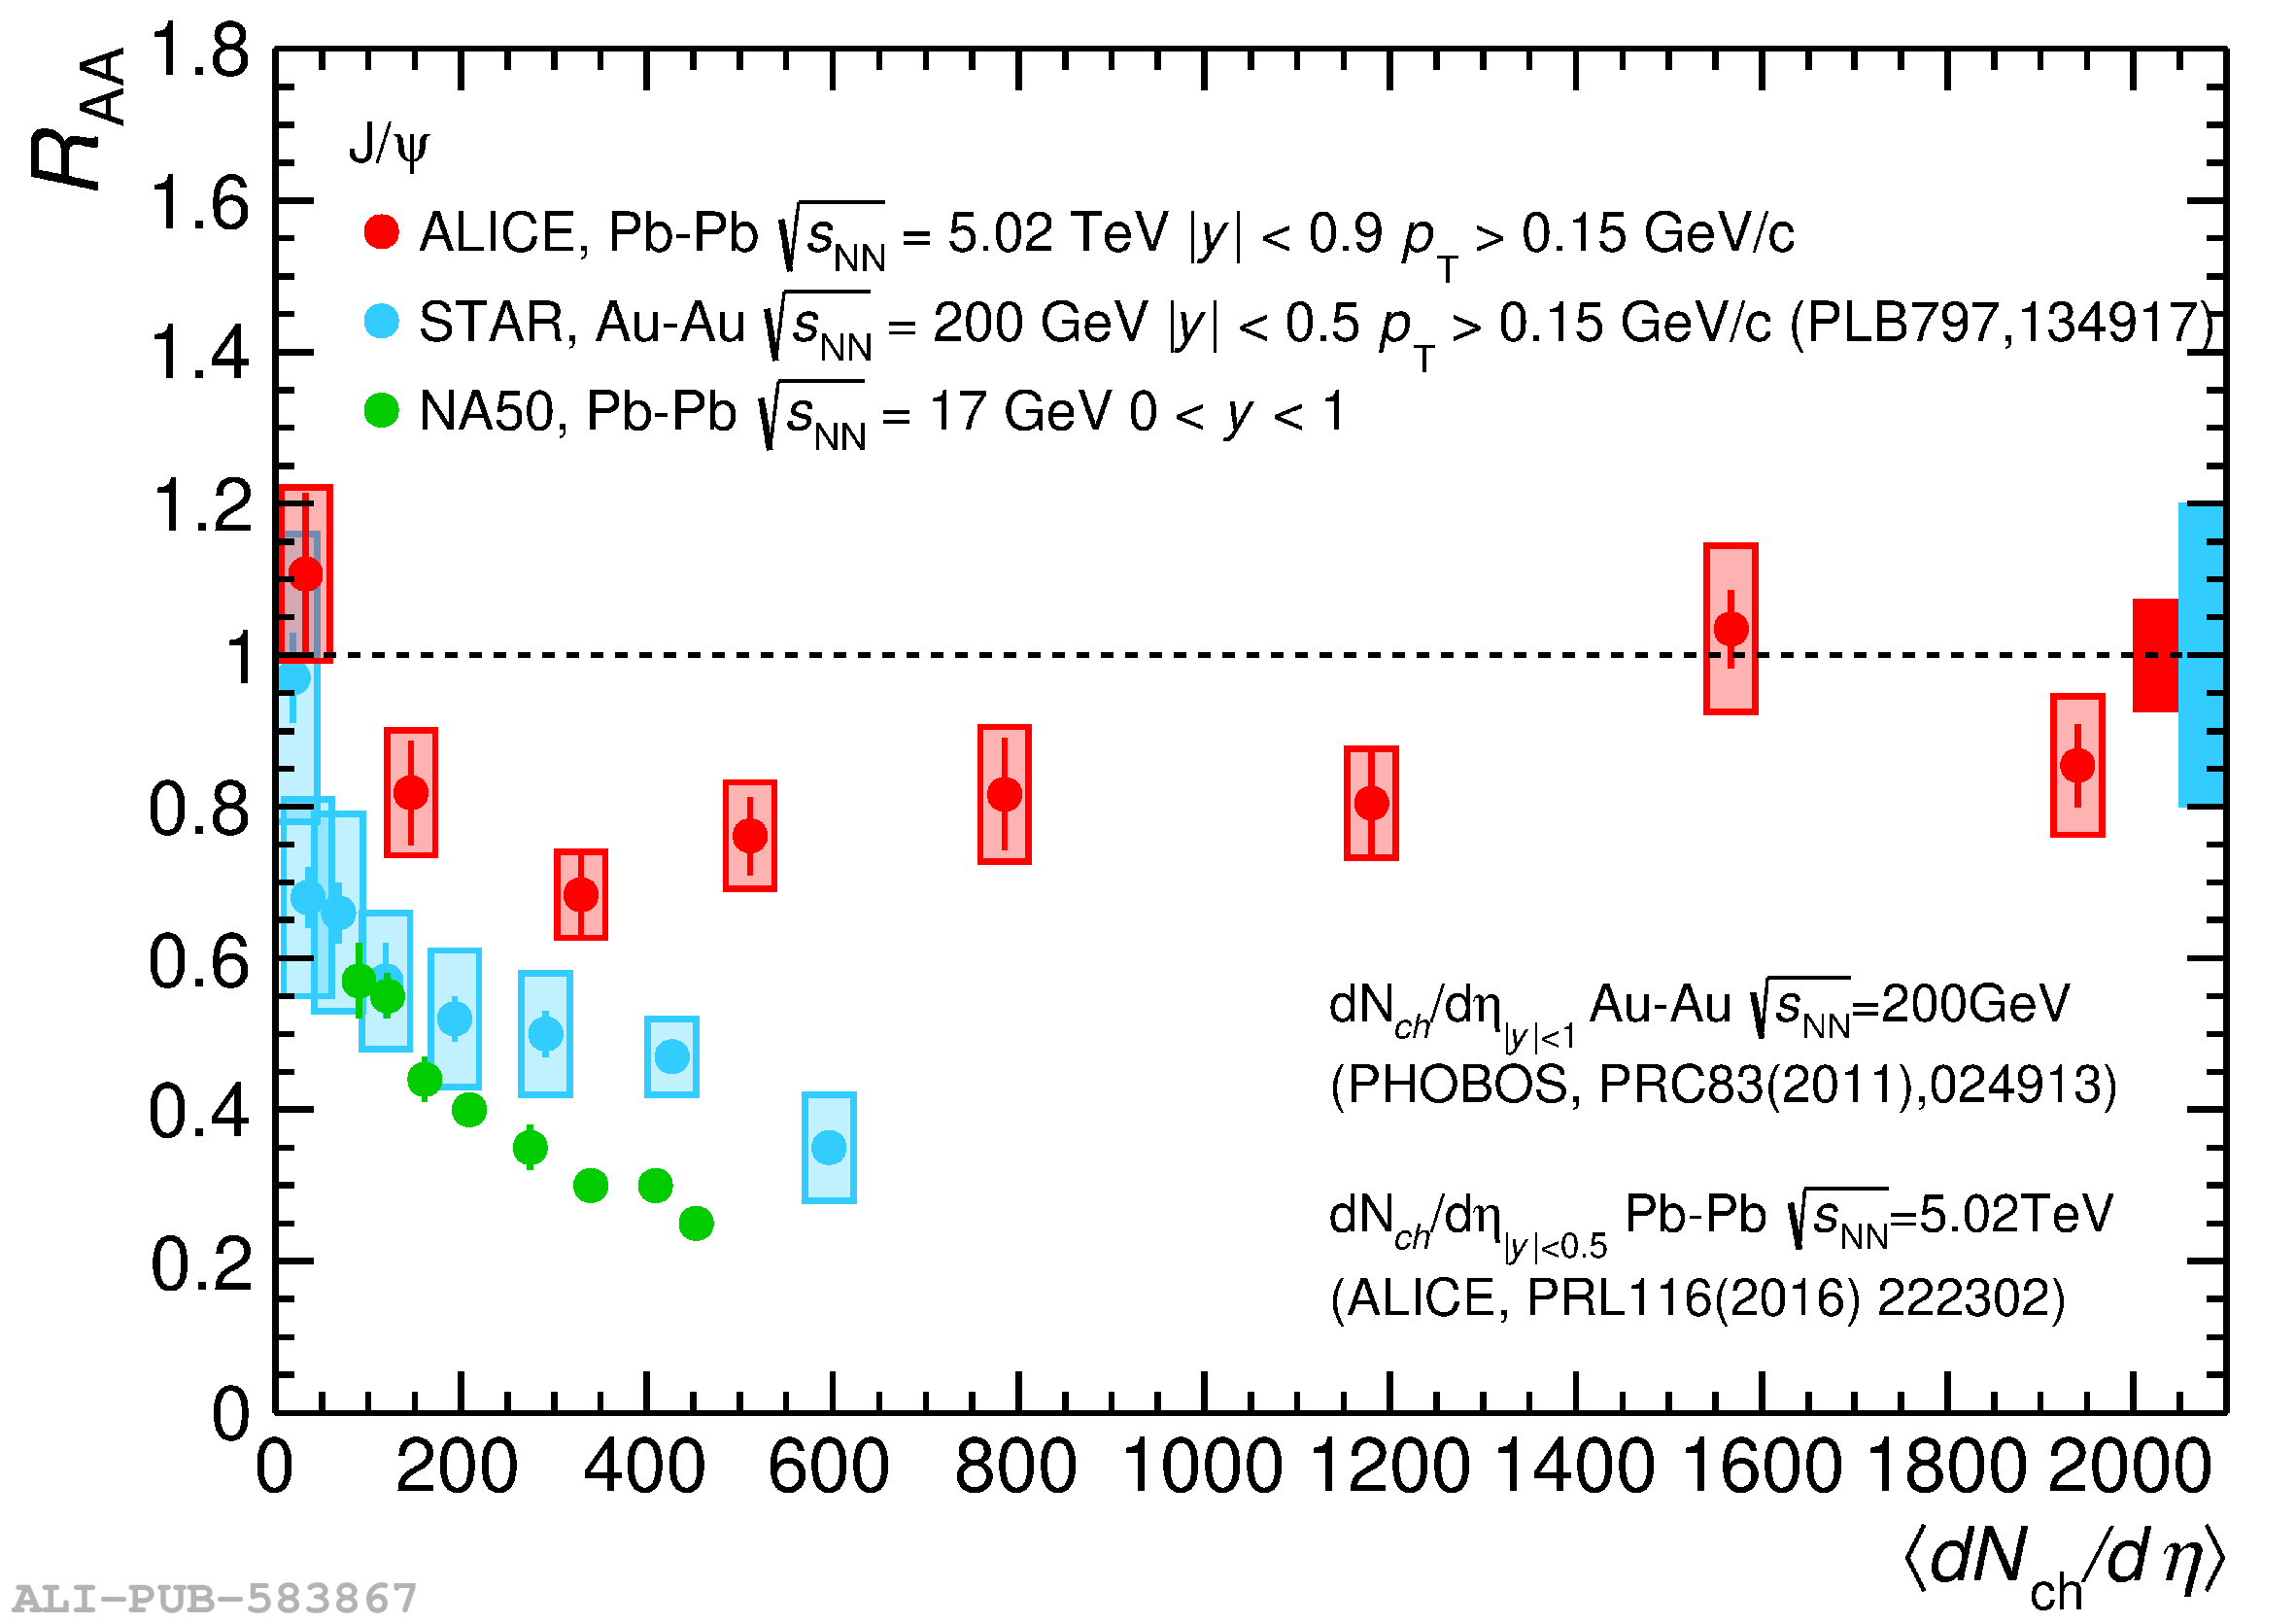
The nuclear modification factor as a function of the charged hadron multiplicity. For ALICE and STAR results, the selection $p_{\rm T}>0.15$ GeV/$c$ minimises the contribution of photoproduced J/$\psi$  . (Top) Comparison between SPS (NA50) , RHIC (STAR)  and LHC (ALICE)  results; (bottom) the ALICE results compared with theoretical calculations (SHM , Comovers , TM-TAMU , TM-Tsinghua ).

Figure 56

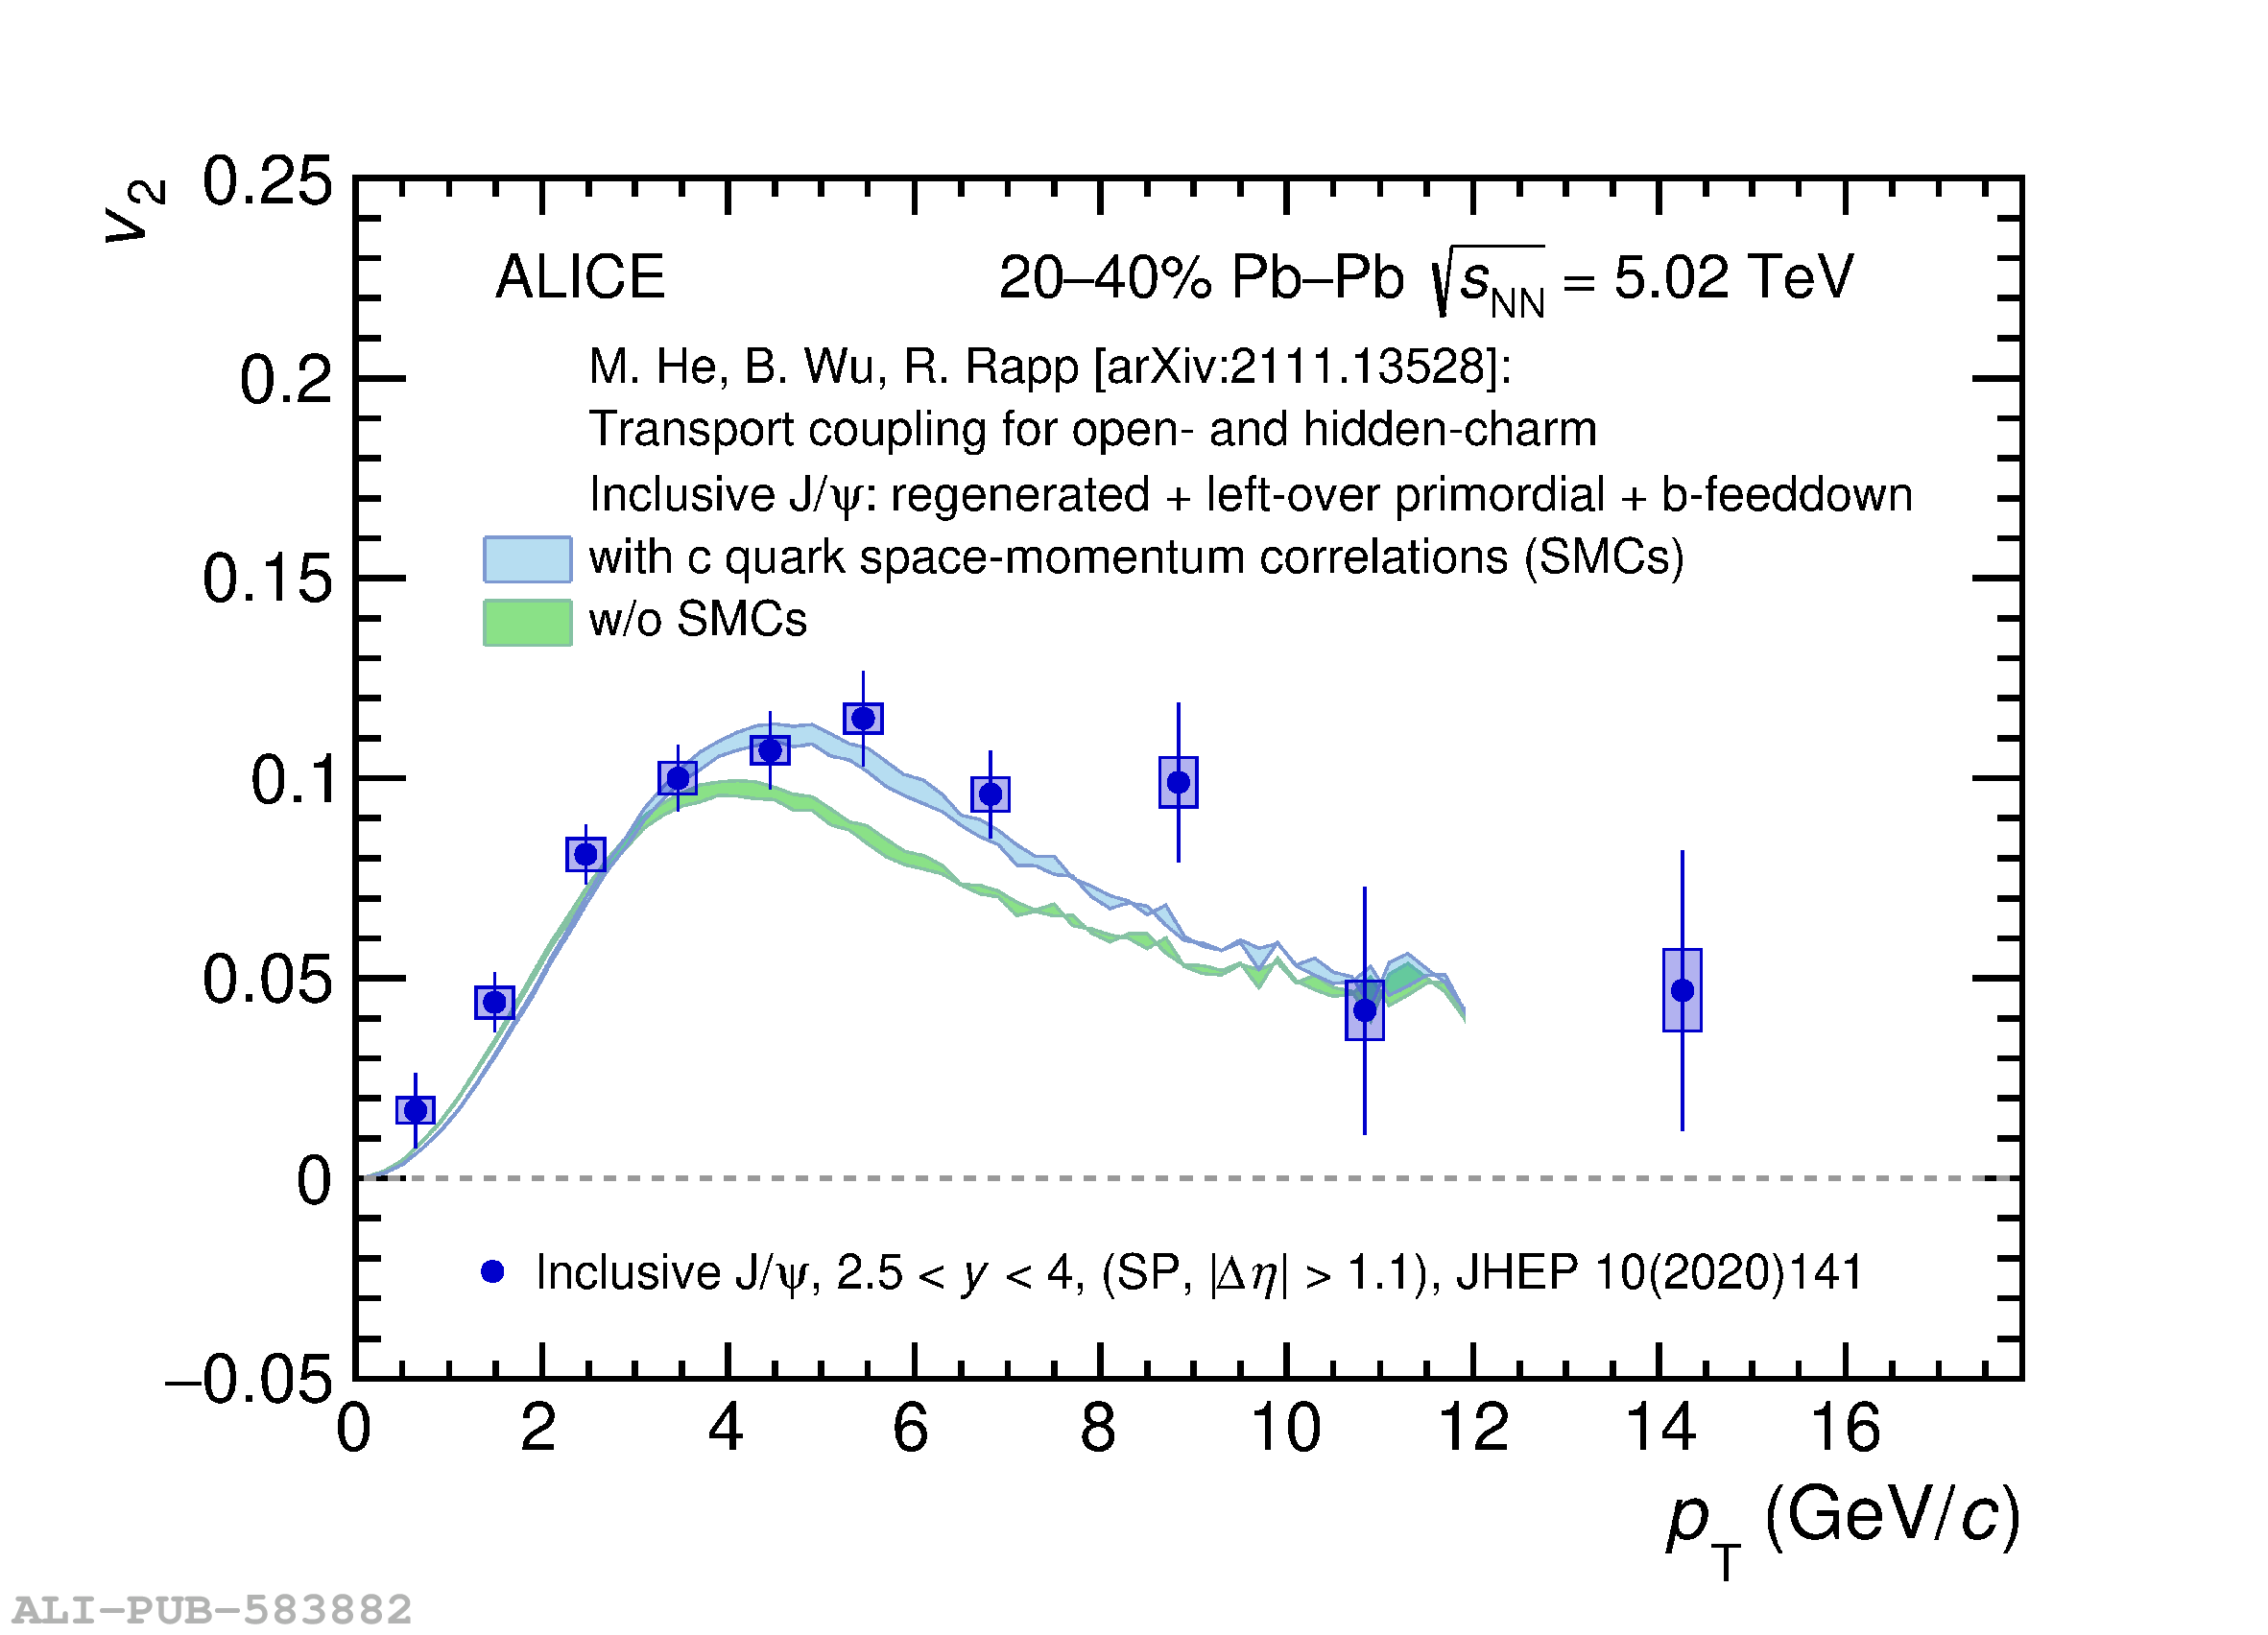
(Top) The nuclear modification factor as a function of the transverse momentum, for the central ($|y|0.9$) and forward ($2.5< y>4$) rapidity regions , compared to TM-TAMU and SHM model calculations (Bottom) The $p_{\rm T}$ dependence of the inclusive J/$\psi$ $v_{\rm 2}$, compared to TM-TAMU model calculations . < /y>

Figure 57

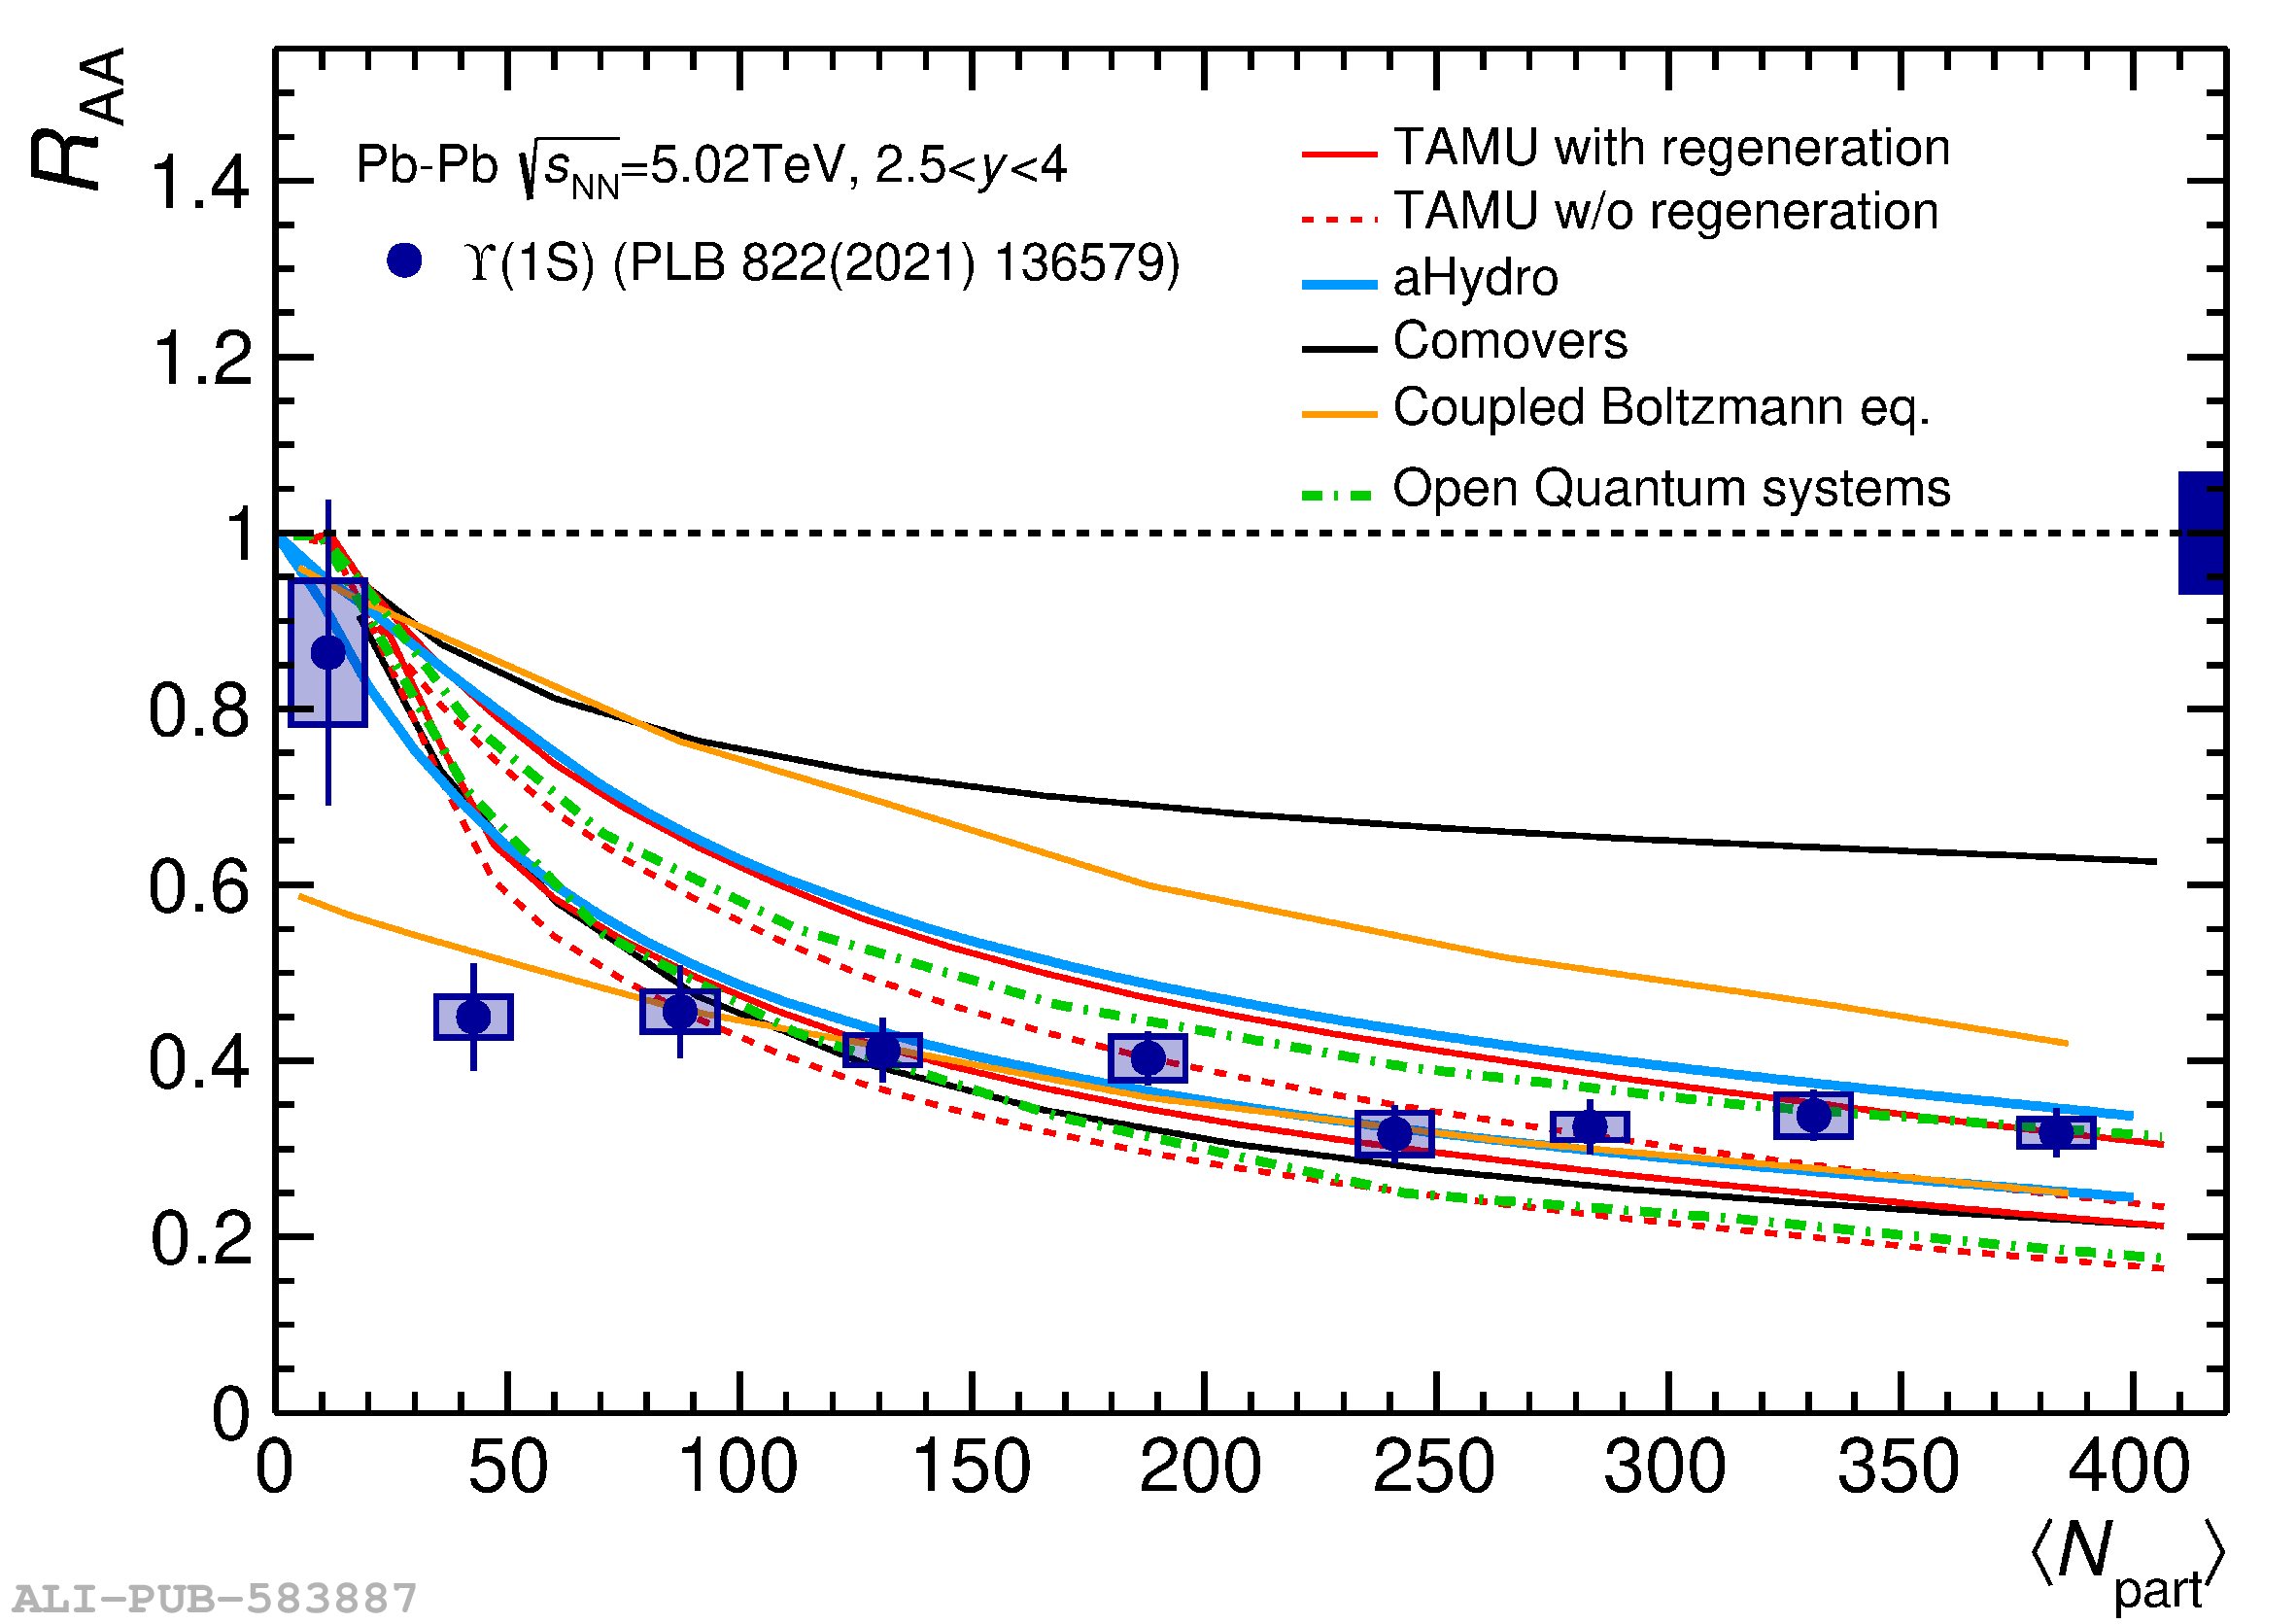
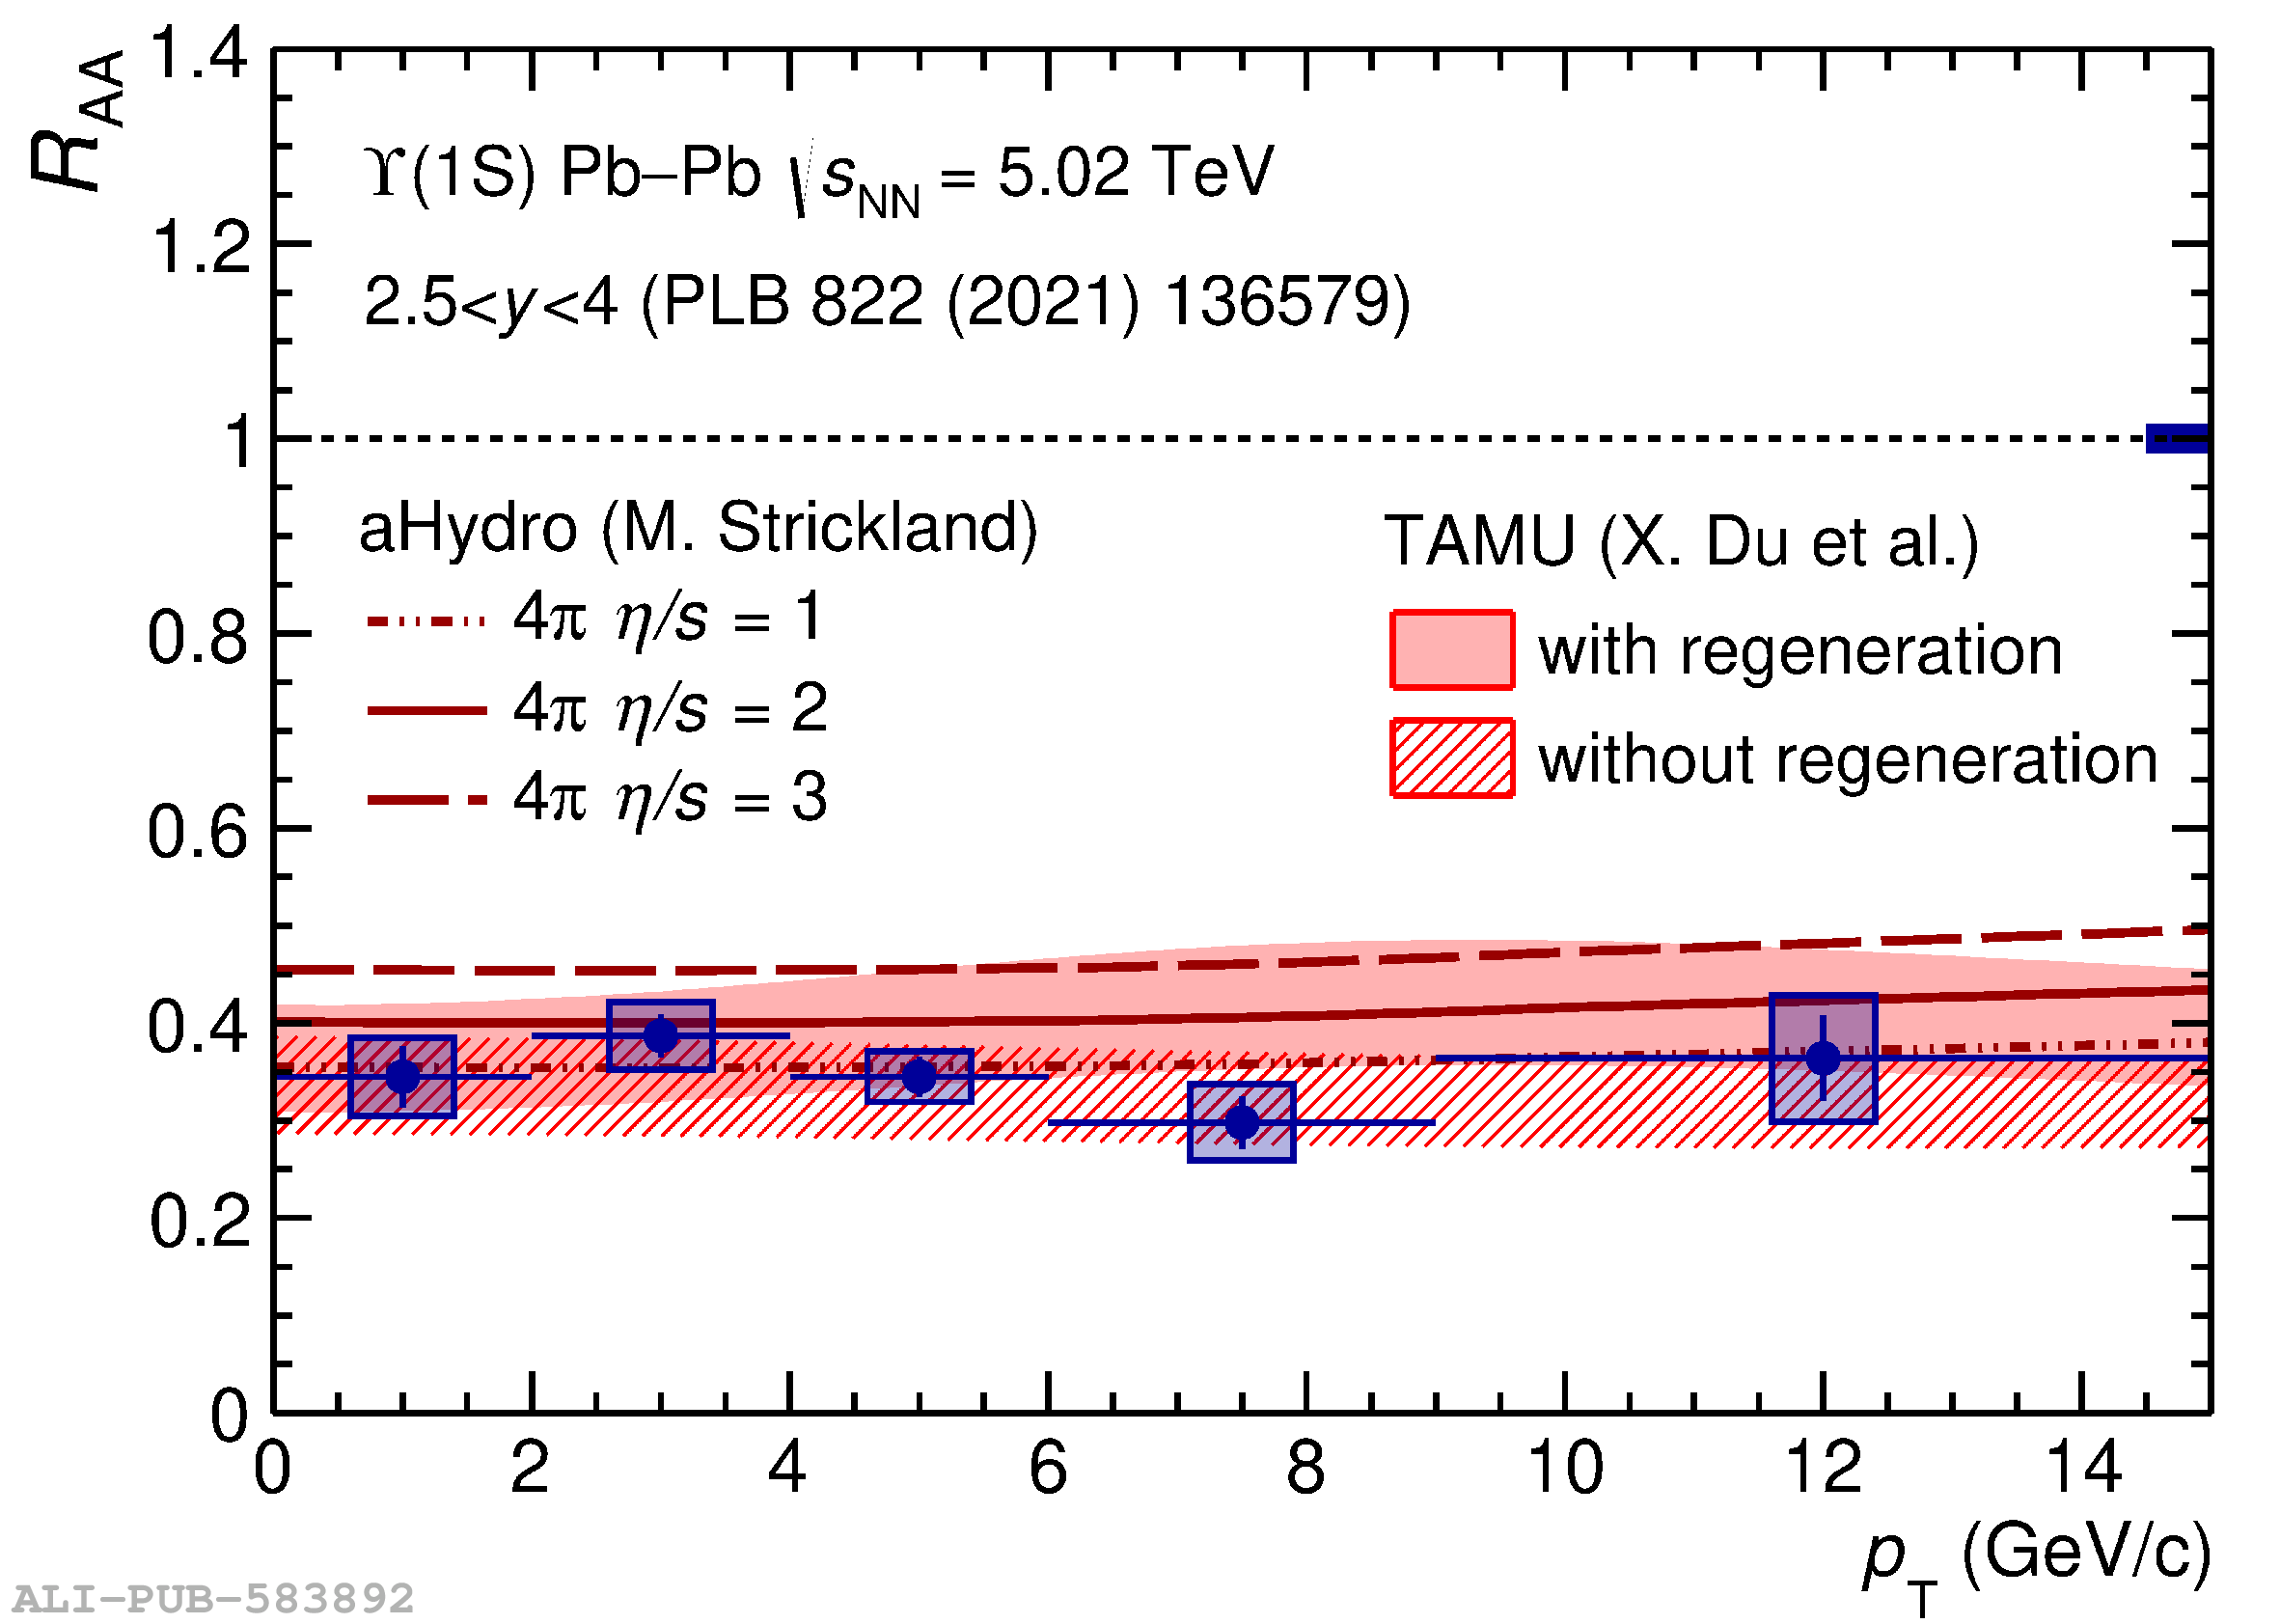
The nuclear modification factor for inclusive \upsone as a function of \Npart , compared to model calculations .

Figure 58

The transverse momentum (left, data from ALICE ) and rapidity (right, data from ALICE  and CMS ) dependence of the inclusive \upsone nuclear modification factor, compared to model calculations .

Figure 59

\jpsi (left) and \upsone (right) \RAA as a function of \pt in centrality-integrated \PbPb collisions at \fivenn in $2.5 y_{\mathrm{cms}} 4$ (blue circles) . Results are compared to the corresponding \RpA values obtained in \pPb collisions at \eightnn in $2.03 y_{\mathrm{cms}} 3.53$ (light gray circles) and $-4.46 y_{\mathrm{cms}} -2.96$ (dark gray circles) . The gray bands correspond to model calculations based on a pure nuclear shadowing scenario using EPS09LO as set of nuclear parton distribution functions (filled bands) . For the \jpsi case, a theory calculation based on a CGC approach coupled with a NRQCD production mechanism is also shown (dashed band) .

Figure 60

SJ/ψ (green symbols) and Sϒ(1S) (orange symbols) as a function of pT. See text for further details on the definition of this quantity.

Figure 61

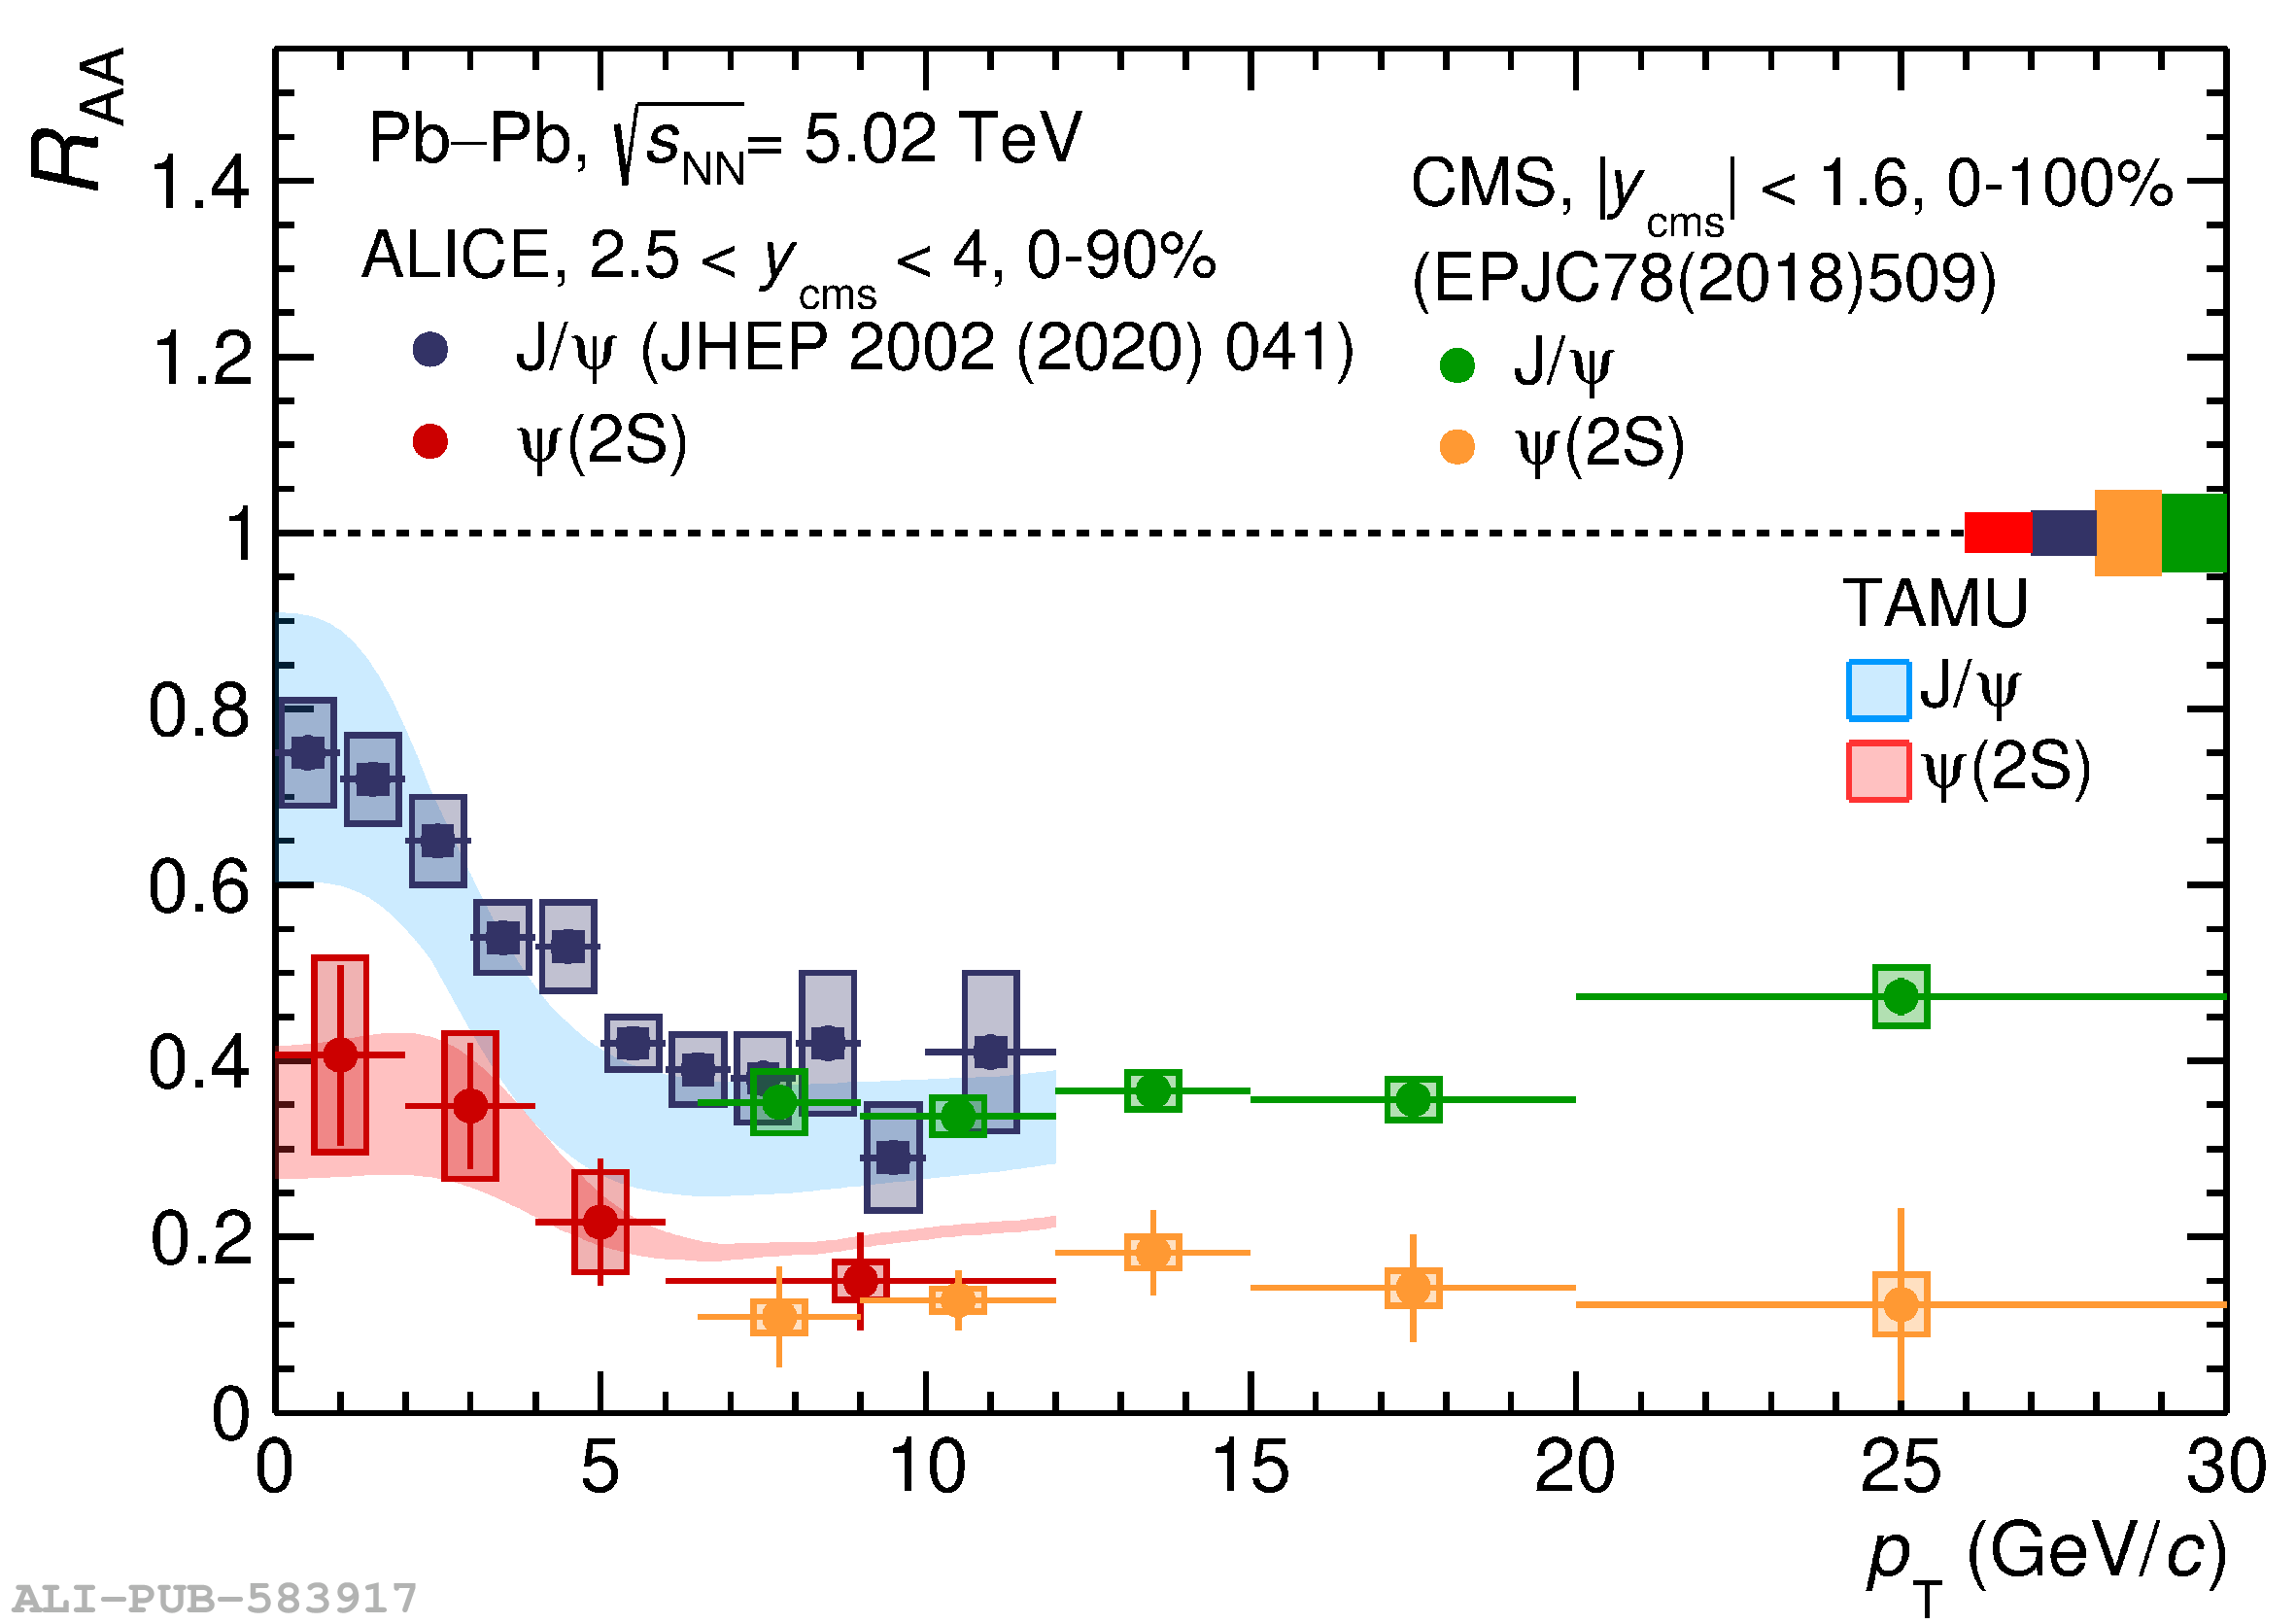
(Top) The nuclear modification factor for inclusive $\psi(2S)$ and J/$\psi$, measured in Pb--Pb collisions at $\sqrt{s_{\rm NN}}=5.02$ TeV as a function of $N_{\rm part}$ , in the range $2.5< y>4$. Predictions from the TM-TAMU  and SHM  models are also shown (Bottom) The $p_{\rm T}$ dependence of the $\psi(2S)$ $R_{\rm AA}$, measured by ALICE in $2.5< y>4$ for 0--90\% Pb--Pb collisions , compared with corresponding high-$p_{\rm T}$ results in $|y|1.6$ and 0--100\% centrality from CMS . Model comparisons are also shown. < /y>< /y>

Figure 62

The nuclear modification factor for inclusive $\Upsilon(2S)$ and $\Upsilon(1S)$ as a function of $N_{\rm part}$ , compared to model calculations .

Figure 63

The centrality dependence of inclusive J/$\psi$ $v_{\rm 2}$ for two transverse momentum regions , compared with the corresponding results for charged pions  .

Figure 64

The $p_{\rm T}$ dependence of inclusive J/$\psi$ $v_{\rm 2}$  compared with the corresponding results for prompt D mesons  and charged pions . The expected $v_{\rm 2}$ for open charm in the constituent quark approach, and for various values of the ratio $p_{\rm T}^{\rm q}/p_{\rm T}^{\rm D}$ are also shown.

Figure 65

The $p_{\rm T}$ dependence of $v_{\rm 2}$ for the centrality range 30--50\% in Pb--Pb collisions at $\sqrt{s_{\rm NN}}=5.02$ TeV. Results are shown for open and hidden charm (D-mesons and J/$\psi$), for open and hidden beauty (electrons from semi-leptonic beauty-hadron decays and $\Upsilon(1S)$), and for pions .

Figure 66

The pseudorapidity dependence of $\Delta v_1$ for charged particles (blue markers) and D mesons (orange markers) in mid-central Pb--Pb collisions at $\sqrt{s_{\mathrm{NN}}} = 5.02$ TeV . The data points for charged particles are scaled by a factor $10^3$. Statistical and systematic uncertainties are represented by the error bars and the boxes around each data point, respectively.

Figure 67

The $\sqrt{s_{\mathrm{NN}}}$ dependence of the upper limit for the magnitude of the magnetic field at freeze-out, estimated from the global polarisation results of $\Lambda$ and $\overline{\Lambda}$. The data points are extracted from the results reported in Refs. .

Figure 68

The centrality dependence of $\Delta \delta_1$ (a) and $\Delta \gamma_{1,1}$ (b), measured at RHIC  and LHC energies . Statistical and systematic uncertainties are represented by the error bars and the boxes around each data point, respectively. Comparison of the centrality dependence of $\Delta \delta_1$ (c) and $\Delta \gamma_{1,1}$ (d), measured at the highest LHC energy  and estimated with a blast wave  and the AVFD  models (see text for details).

Figure 69

(Top) The dependence of $\Delta \gamma_{1,1}$ on $v_2$ for shape selected events together with a linear fit (dashed lines) for various centrality classes. (Bottom) The centrality dependence of the CME fraction, $f_{\mathrm{CME}}$, extracted from the slope parameter of fits to data and MC-Glauber, MC-KLN CGC, and EKRT models, respectively. The dashed lines indicate the physical parameter space of the CME fraction, while the points are slightly shifted along the horizontal axis for better visibility. Figures from Ref. .

Figure 70

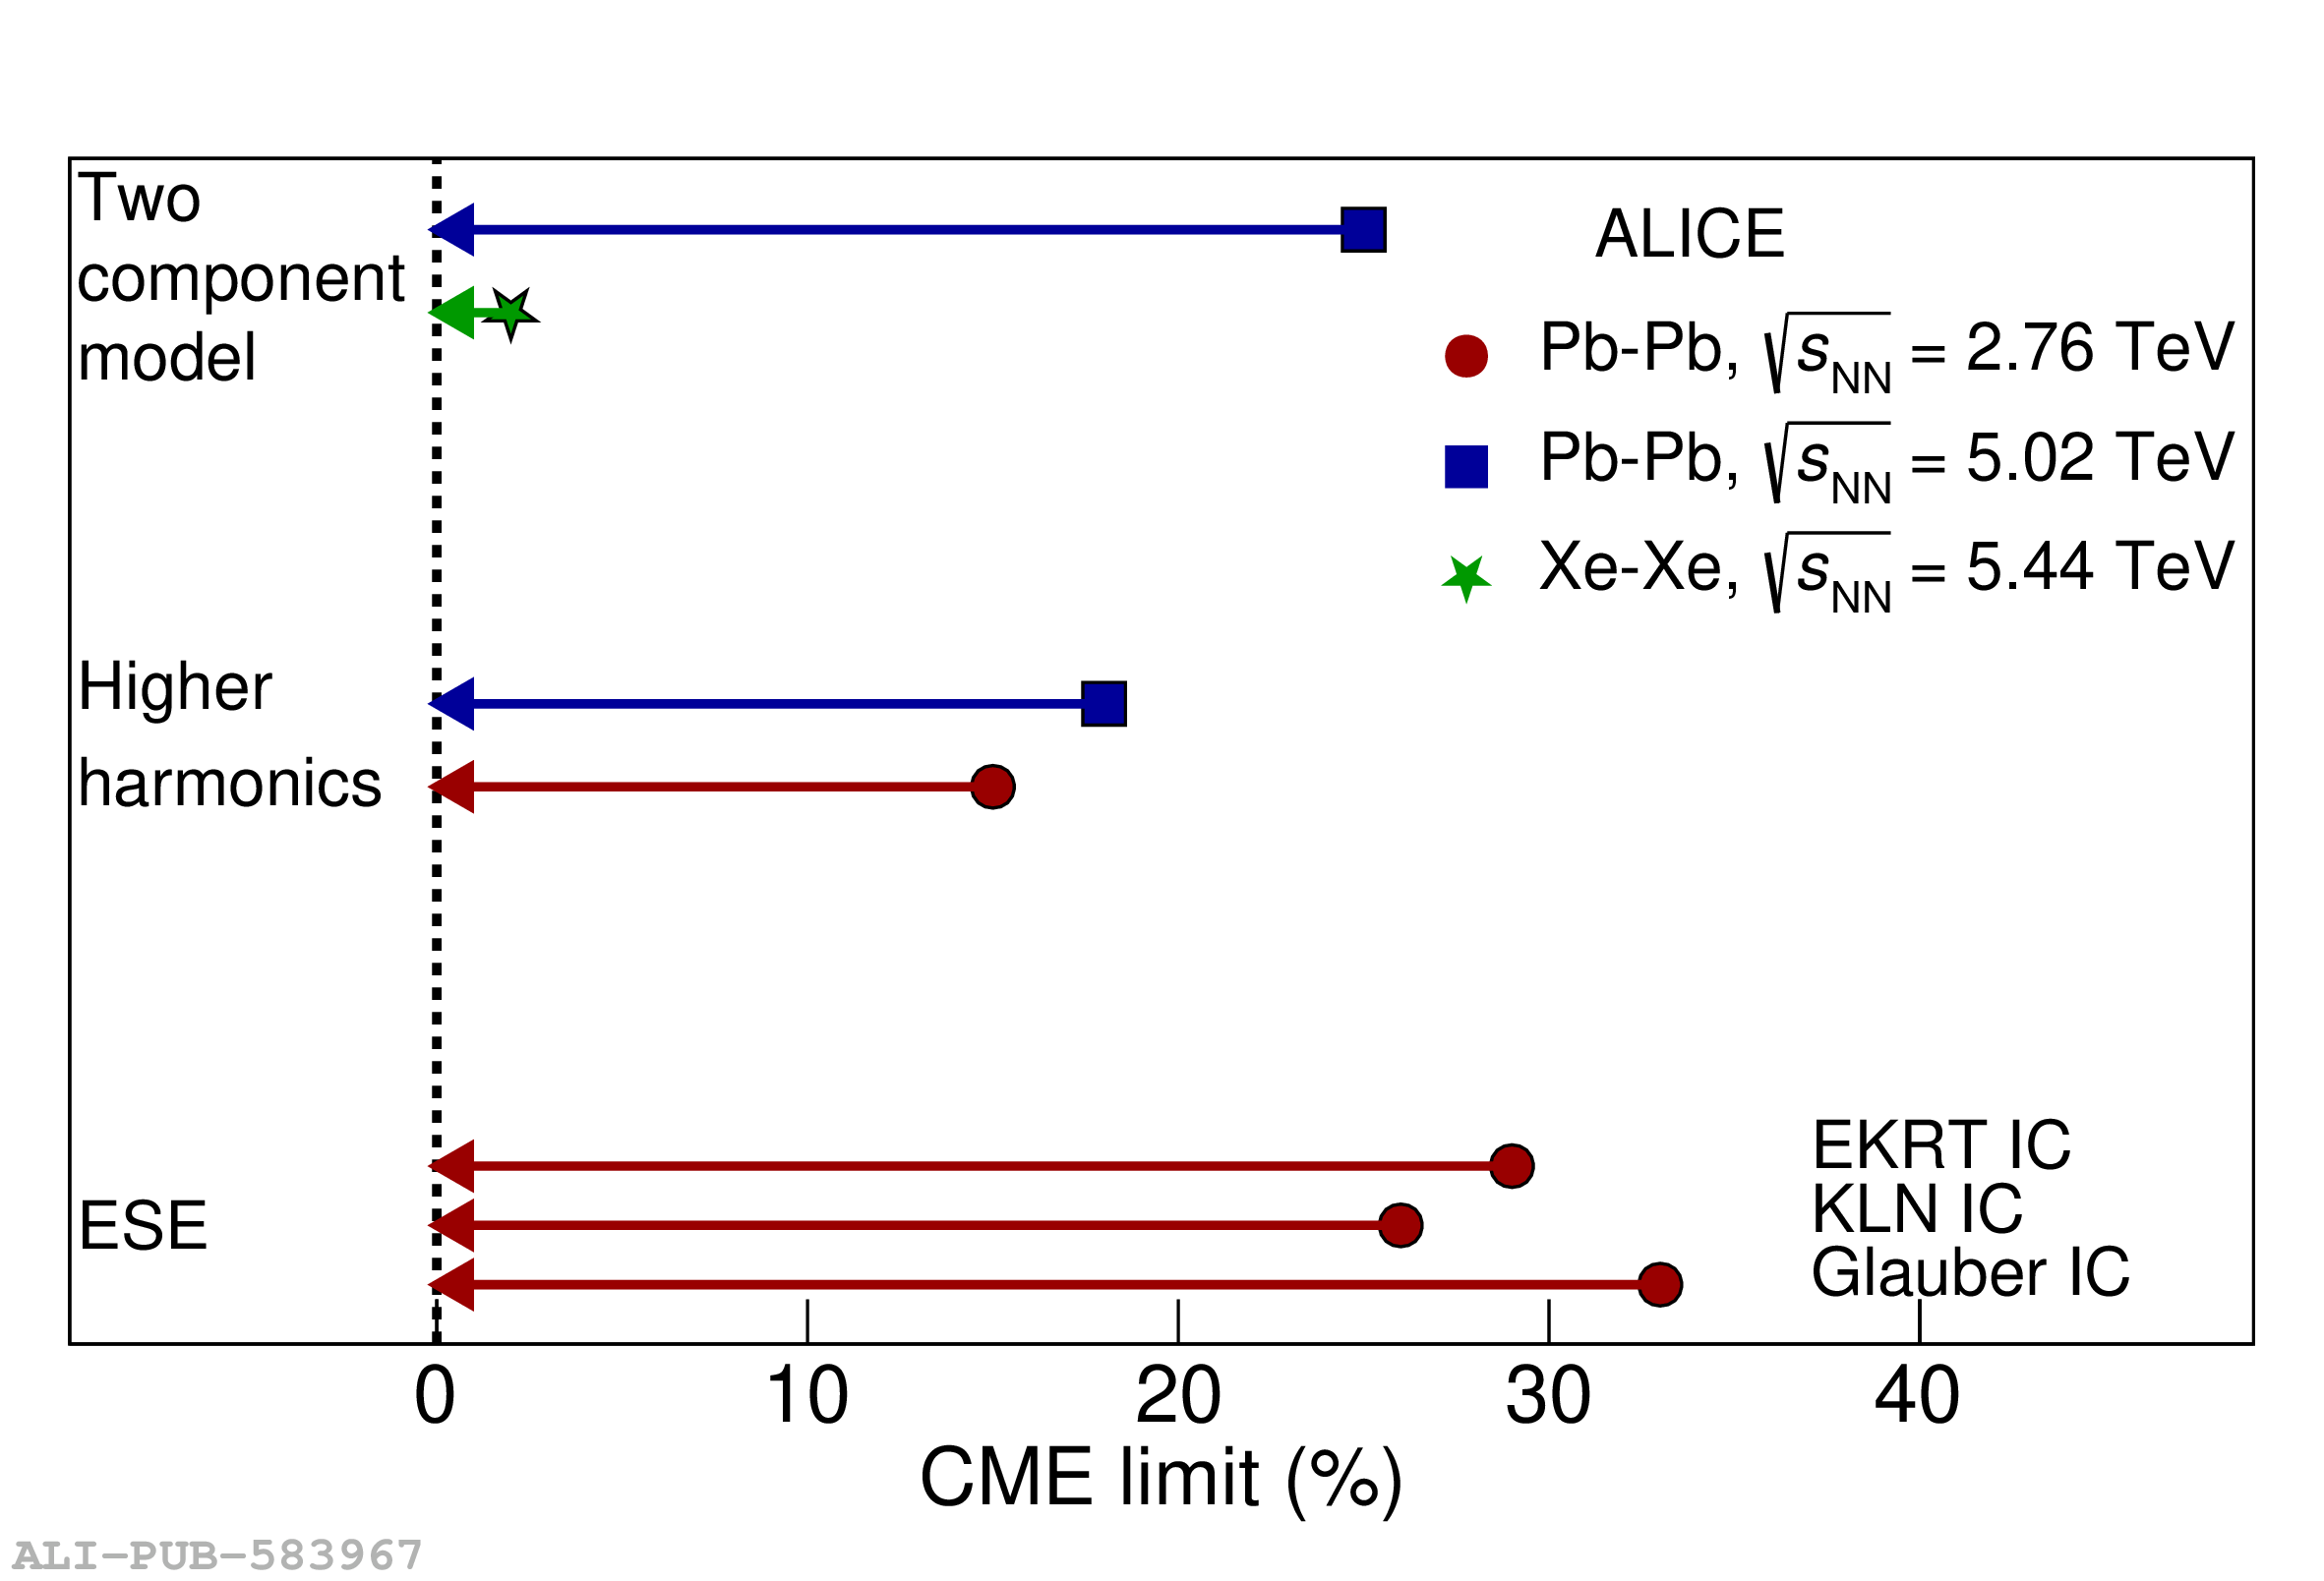
Summary of the results for the CME limit obtained from different analyses performed at various LHC energies and colliding systems integrated over centralities (see text for details).

Figure 71

The pseudorapidity dependence of the results for the second (left) and third harmonic (right) for positive (red squares) and negative (blue circles) particles measured in the 20--60$\%$ centrality interval of Pb--Pb collisions at $\sqrt{s_\mathrm{{\rm NN}}} = 2.76$ TeV .

Figure 72

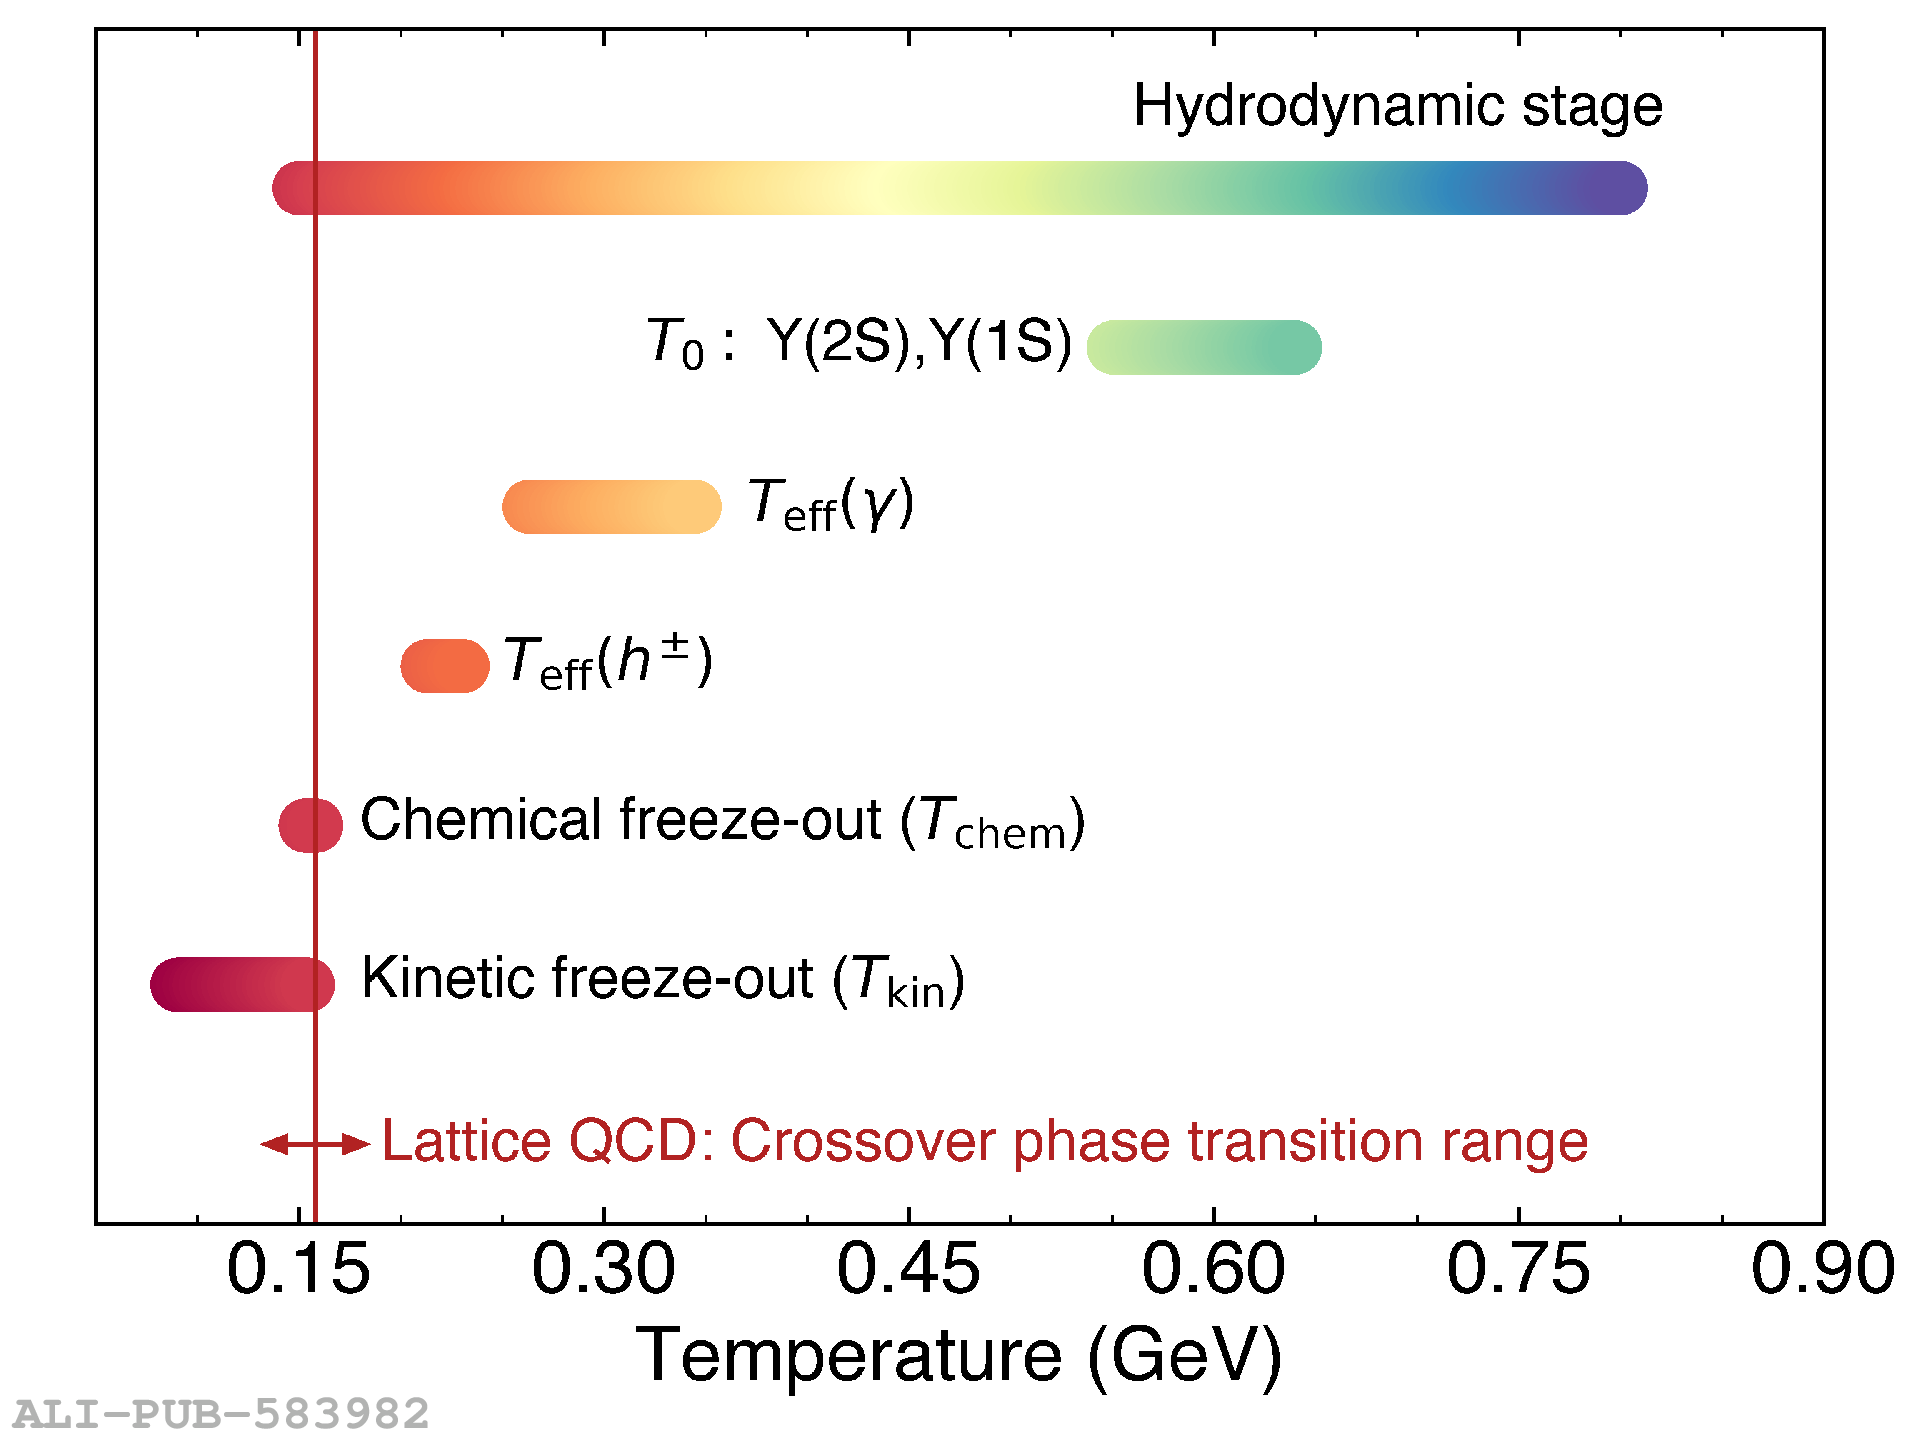
The temperatures ranges probed by central heavy-ion collisions at the LHC derived from ALICE measurements shown throughout the chapter. The region to the right of the red line represents the QGP phase, while the left is the hadronic phase. A lattice QCD calculation for the pseudocritical temperature $T_{\mathrm{pc}}$ and crossover temperature range where the QGP and hadron gas coexist (denoted by the arrows) is also shown .

Figure 73

The temperature dependence of the shear (top panel) and bulk (bottom) viscosities over entropy density in the QGP phase constrained by the ALICE measurements shown in Secs. \ref{sec:MacroscopicProperties}, \ref{sec:QGPevolution}, and \ref{sec:Quarkonium} from various hydrodynamic models described in the text. Limits from pQCD , AdS/CFT , and AdS/Non-Conformal Holographic  approaches are also shown. The ranges on the right of the plot represent 90\% posterior intervals from the Bayesian analyses.

Figure 74

The temperature dependence of the spatial charm diffusion coefficient $D_{\rm s}$ in the QGP phase constrained by the ALICE measurements shown in Sec. \ref{sec:PartonInteractions} from various transport models described in the text. The range on the right of the plot represents a 90\% posterior interval from the Bayesian analysis at $T=0.4$ GeV. Limits from pQCD , and AdS/CFT , are also shown.

Figure 75

The temperature dependence of $\hat{q}/T^{3}$ for gluons at an energy of 20 GeV in the QGP phase from various models that describe the ALICE data (see text for details). The range on the right of the plot represents a 90\% posterior interval from the Bayesian analysis at $T=0.3$ GeV.

Figure 76

Ratios of multiplicity-selected transverse-momentum distributions of charged particles for pp collisions (top)  and p--Pb collisions (bottom)  to inelastic (INEL) pp collisions, shown in logarithmic scale. For pp collisions, the forward-rapidity event selection is done using the V0M multiplicity estimator ($-3.7 \eta -1.7$, $2.8 \eta 5.1$), while the midrapidity event selection is done using the SPD tracklets in $|\eta|0.8$. For p--Pb collisions, the forward-rapidity event selection is done using the A-side of the V0 multiplicity estimator ($2.8 \eta 5.1$), corresponding to the Pb-going side, while the midrapidity event selection is done using the first layer of the SPD. The horizontal dashed lines denote the integrated charged-particle multiplicity density ratios as a reference. For this figure, the pp high-multiplicity event classes correspond to 0--1\% (V0M-based, forward-rapidity selection) and 0.009--0.088\% (SPD-based, midrapidity selection) and the low-multiplicity pp event classes correspond to 70--100\% (V0M) and 49.5--100.0\%, where percentiles are defined with respect to the total pp INEL$>$0 cross section. For all event selections, the p--Pb high-multiplicity and low-multiplicity event classes correspond to 0--5\% and 70--100\%, respectively, with percentiles defined with respect to the total visible V0A cross section.

Figure 77

Mean number of Multiple Parton Interactions, $\langle N_{\rm{MPI}}\rangle$, as a function of mean charged particle multiplicity at midrapidity, $\langle {\rm d}N_{\rm{ch}}/\rm{d}\eta \rangle_{|\eta|0.5}$, for different event selections, calculated with the PYTHIA 8.2 model (Monash 2013 tune) .

Figure 78

(Left) $Q_{\rm{pPb}}$ at high transverse momenta calculated using various multiplicity selections (points) and predicted with the Q-PYTHIA model (curves) . (Right) $Q_{\rm{pPb}}$ calculated with the hybrid method. Spectra are calculated in event classes based on the ZNA energy (neutron ZDC on the A side, Pb-going) and $N_{\rm{coll}}$ is obtained assuming $N_{\rm{part}}$ scaling at midrapidity. Figure from .

Figure 79

(Left) $p_{\rm T}$-integrated yield ratios to pions ($\pi^+$ + $\pi^-$) and $p_{\rm T}$-integrated yield ratios between resonance and corresponding ground state as a function of $\langle {\rm d}N_{\rm{ch}}/\rm{d}\eta\rangle$ measured in $|\eta| 0.5$ in pp collisions at $\sqrt{s} = 7$ and 13 TeV , p--Pb collisions at $\sqrt{s_{\rm{NN}}} = 5.02$ TeV  and at $\sqrt{s_{\rm{NN}}} = 8.16$ TeV , Xe--Xe collisions at $\sqrt{s_{\rm{NN}}} = 5.44$ TeV  and Pb--Pb collisions at $\sqrt{s_{\rm{NN}}} = 2.76$ TeV  and at $\sqrt{s_{\rm{NN}}} = 5.02$ TeV . (Right) Ratios involving $\rho$ mesons, $\rm K^*$, $\Sigma^{*\pm}$, $\Lambda(1520)$ and $\Xi^{*}$. All yields are obtained at midrapidity, i.e.\,$|y|0.5$. Theerror bars show the statistical uncertainty, whereas the empty and dark-shaded boxes show the total systematicuncertainty and the contribution uncorrelated across multiplicity bins, respectively.

Figure 80

$p_\mathrm{T}$-integrated yield ratios to protons or charged pions (particles + antiparticles) as a function of $\langle {\rm d}N_{\rm{ch}}/\rm{d}\eta\rangle$ measured in $|\eta| 0.5$ in pp collisions , p--Pb collisions  and Pb--Pb collisions  for nuclei (left) and for $\rm{D}^{0}$ and $\rm{J}/\psi$ mesons (right). All yields are obtained at midrapidity, i.e.\,$|y|0.5$. The error bars show the statistical uncertainty, whereas the empty and dark-shaded boxes show the total systematicuncertainty and the contribution uncorrelated across multiplicity bins, respectively.

Figure 81

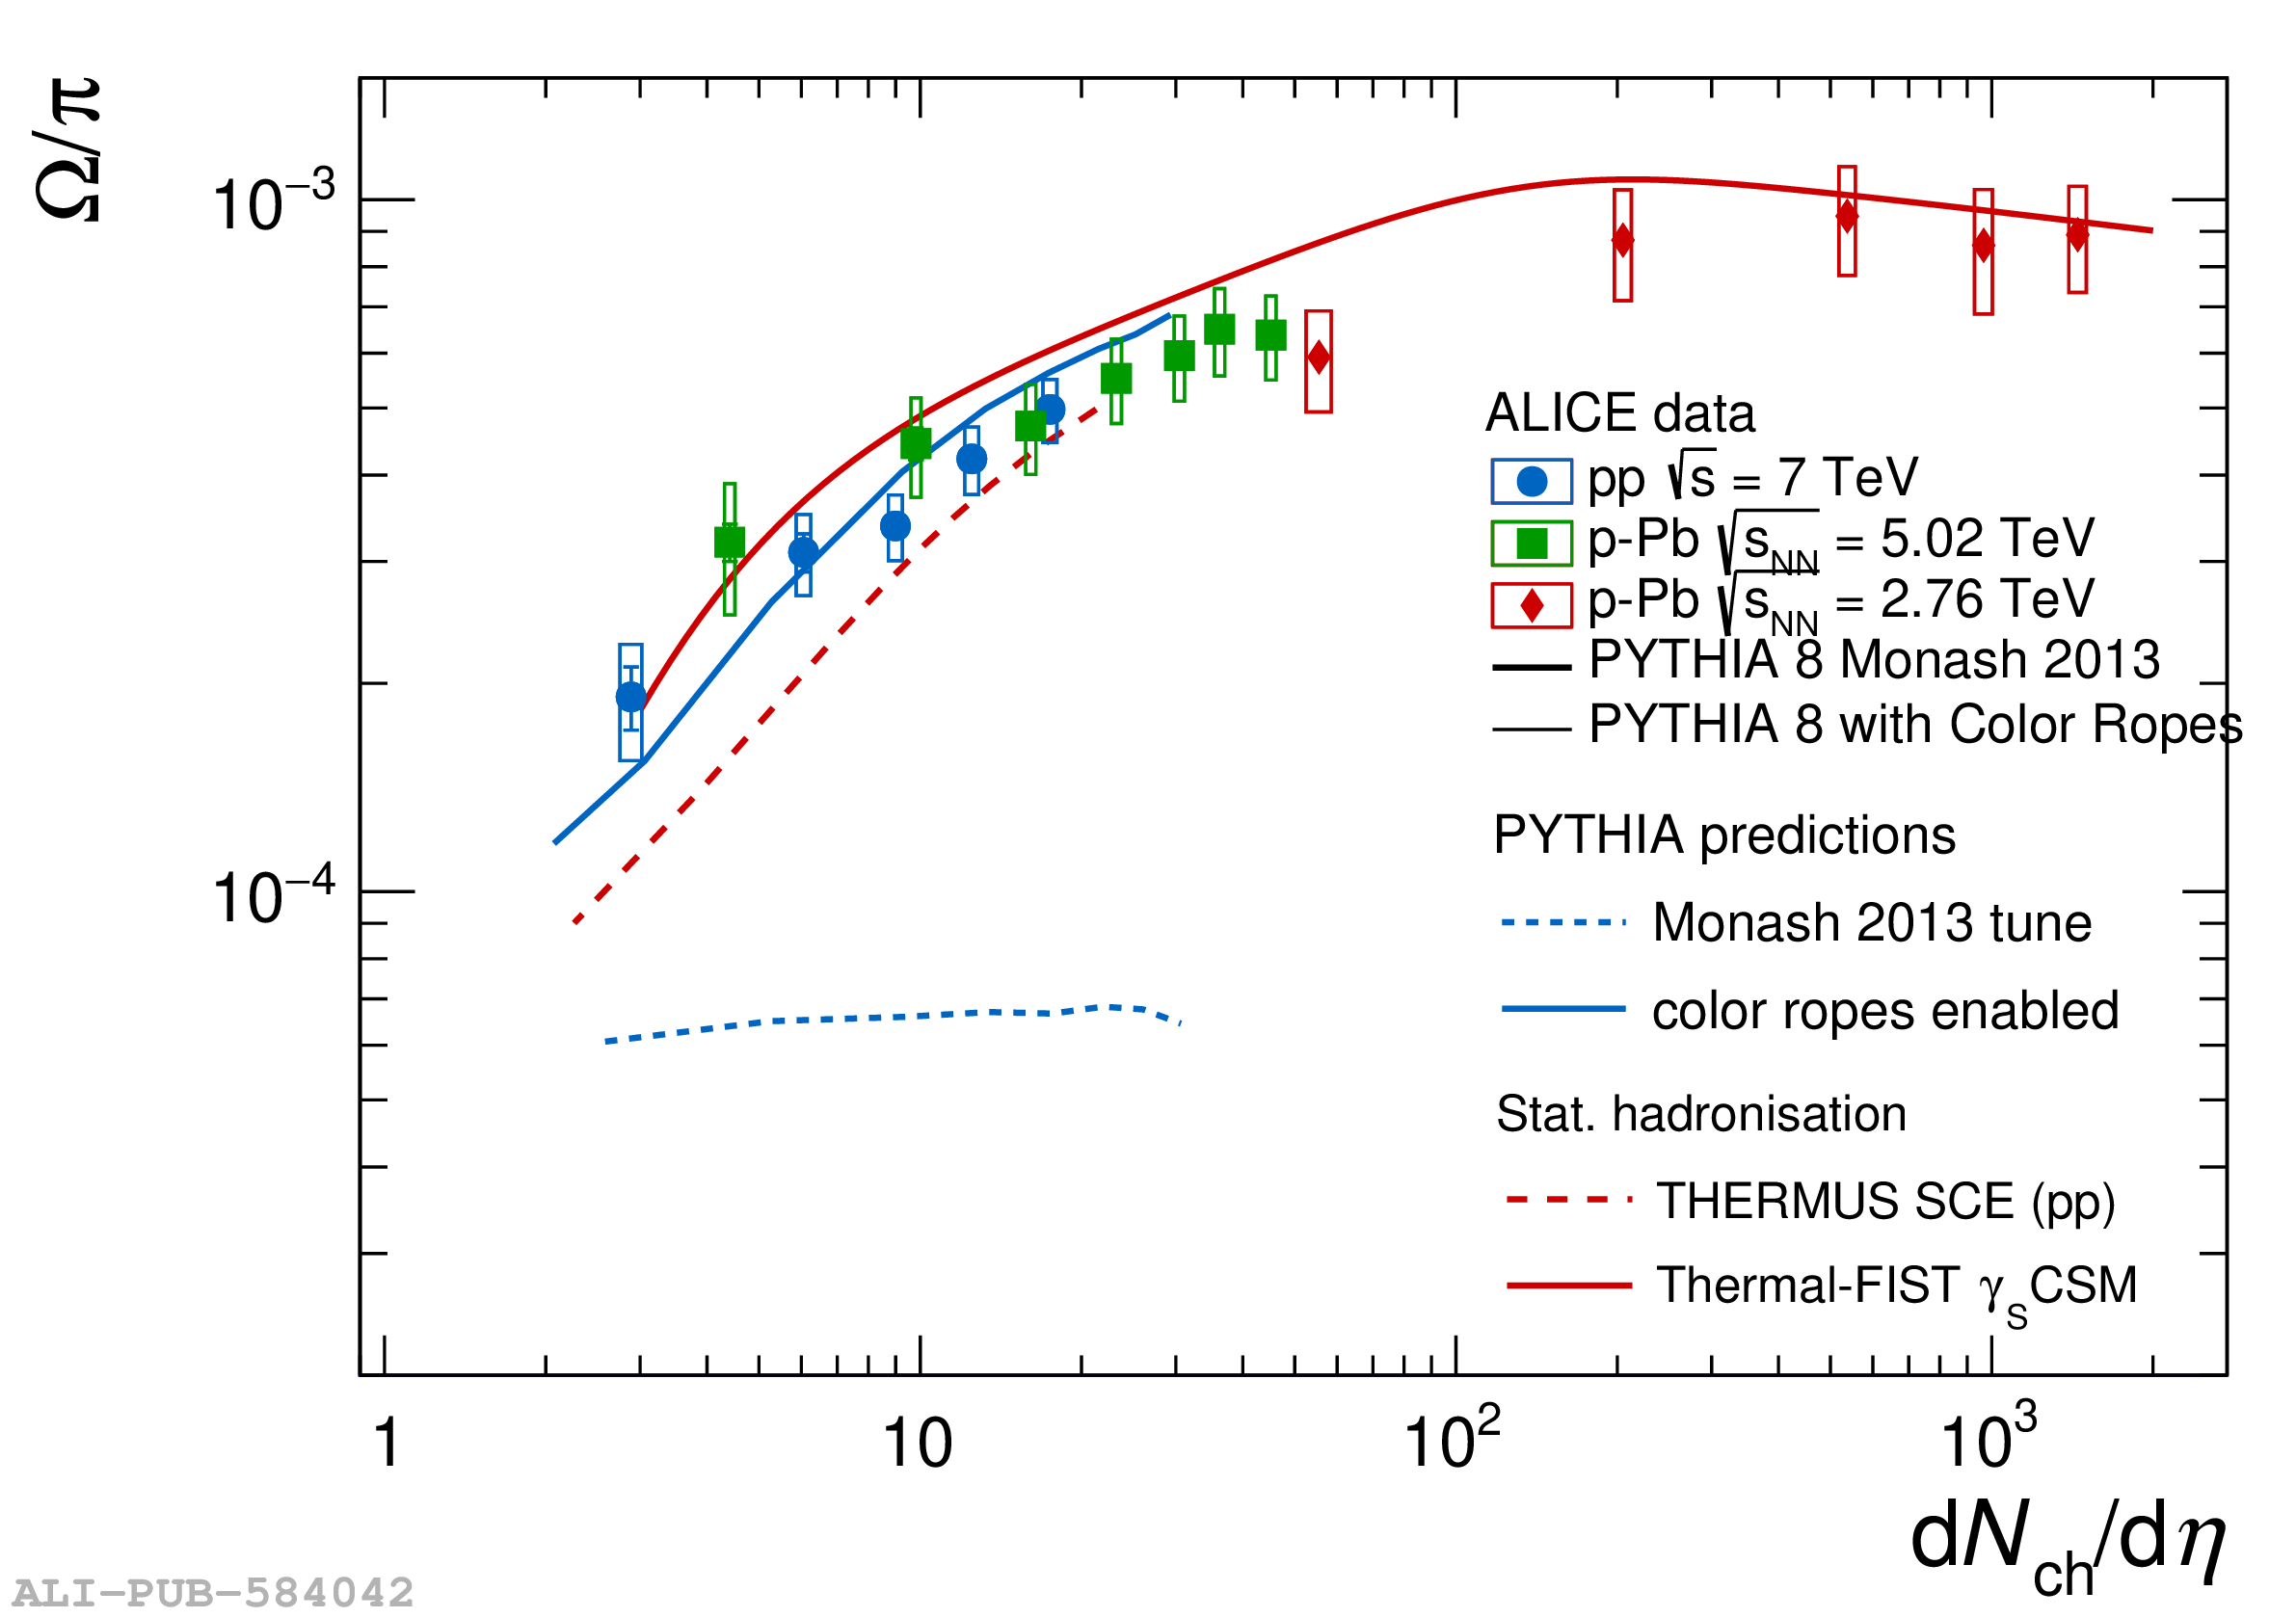
Selected measurements from the previous figures compared to different theoretical models. (Top left) $p_{\rm T}$-integrated ratio of p$/\pi$ as a function of $\langle {\rm d}N_{\rm ch}/{\rm d}\eta \rangle$ at midrapidity. (Top right) $p_{\rm T}$-integrated ratio of $\phi/\pi$ as a function of $\langle {\rm d}N_{\rm ch}/{\rm d}\eta \rangle$ at midrapidity (Bottom left) $p_\mathrm{T}$-integrated ratio of $\Omega/\pi$ as a function of $\langle {\rm d}N_{\rm ch}/{\rm d}\eta \rangle$ at midrapidity compared to PYTHIA 8.2 (Monash 2013 tune)  and PYTHIA colour ropes model . (Bottom right) $p_{\rm T}$-integrated ratio of $(\rm{J}/\psi)/\pi$ as a function of $\langle {\rm d}N_{\rm ch}/{\rm d}\eta \rangle$ at midrapidity.

Figure 82

(Left) Transverse-momentum dependence of $\Lambda/\rm{K}^{0}_{S}$ at midrapidity for high- and low-multiplicity proton--proton collisions at 13 TeV  drawn together with $\Lambda_{\rm c}/\rm{D}^{0}$ ratios . (Right) Multiplicity dependence of the $\Lambda/\rm{K}^{0}_{S}$ and $\Lambda_{\rm c}/\rm{D}^{0}$ ratios at midrapidity in selected transverse-momentum intervals in pp collisions at 13 TeV.

Figure 83

Associated yield per trigger particle in $\Delta \varphi$ and $\Delta \eta$ for pairs of charged particles with $2 p_{\rm T,trig} 4$ GeV/{\it c} and $1 p_{\rm T,assoc} 2$ GeV/{\it c} in p--Pb collisions at $\sqrt{s_{\rm NN}} = 5.02$ TeV for the 0--20\% multiplicity class, after subtraction of the associated yield obtained in the 60--100\% event class under the assumption that the latter multiplicity class is completely dominated by non-flow correlations . A clear double-ridge signal spanning a large range in $\Delta\eta$ can be seen on the near-side $|\Delta\varphi| \approx 0$ and on the away-side $|\Delta\varphi| \approx \pi$, indicative of the possibility of a collective behaviour in p--Pb collisions.

Figure 84

Multiplicity dependence of $v_n\{m\}$ in pp, p--Pb and Pb--Pb collisions  Statistical uncertainties are shown as vertical lines and systematic uncertainties as filled boxes The results of two-particle cumulants $v_n\{2\}$ in all collision systems are shown together in panel (a) The same results together with the four-particle cumulant $v_2\{4\}$ and comparison to models are reported individually in Pb--Pb (b), p--Pb (c) and pp collisions (d) Data are compared with PYTHIA 8.210 (Monash 2013 tune)  simulations of pp collisions at $\sqrt{s} = 13$ TeV, and the same simulations with string shoving mechanism with the string amplitude of the shoving force $g=10$. Data are further compared to IP-Glasma+MUSIC+UrQMD  calculations of pp collisions at $\sqrt{s} = 13$ TeV and p--Pb and Pb--Pb collisions at $\sqrt{s_{\rm{NN}}} = 5.02$ TeV, and iEBE-VISHNU calculations of pp collisions at $\sqrt{s} = 13$ TeV with HIJING initial conditions and parameter set IV . The width of the bands represent the statistical uncertainty of the model.

Figure 85

(Left) Transverse-momentum dependence of $v_2$ of hadrons, pions, kaons, protons, J$/\psi$, electrons from heavy-flavour hadron decays and inclusive muons in the 0--20\% multiplicity class of p--Pb collisions at $\sqrt{s_{\rm NN}} = 5.02$ TeV and $8.16$ TeV after subtraction of the low-multiplicity class . The muons at $p_{\rm T}1.5$ GeV/$c$ are dominated by decays of light hadrons, while they predominantly originate from heavy-flavour hadron decays at $p_{\rm T}>2$ GeV/$c$. The results of J$/\psi$ are combined results from p--Pb collisions at $\sqrt{s_{\rm NN}} = 5.02$ and 8.16 TeV. The data is plotted at the average-$p_{\rm{T}}$ for each considered $p_{\rm{T}}$ interval and particle species under study. Error bars show statistical uncertainties while boxes denote systematic uncertainties. The bands illustrate the CMS measurements for $\rm K^0_S$ and $\Lambda$ . (Right) Data of light hadrons are compared to the IP-Glasma+MUSIC+UrQMD  calculations and iEBE-VISHNU calculations with the coalescence and fragmentation model . The width of the bands represents the statistical uncertainty of the models.

Figure 86

The nuclear modification factor for \jpsi and $\psi(\rm 2S)$ production in \pPb collisions at $\snn=8.16$ TeV . Data are compared with two model calculations that include final state effects .

Figure 87

The double ratio between the $\psi(\rm 2S)$ and \jpsi cross sections in \pPb and pp collisions at $\snn=5.02$ and 8.16 TeV , shown as a function of $\langle N_{\rm coll}\rangle$ for the backward (Pb-going) rapidity region and compared to the comover model results . The boxes around unitycorrespond to the global systematic uncertainty on the ratio between the $\psi(\rm 2S)$ and \jpsi cross sections in pp collisions.

Figure 88

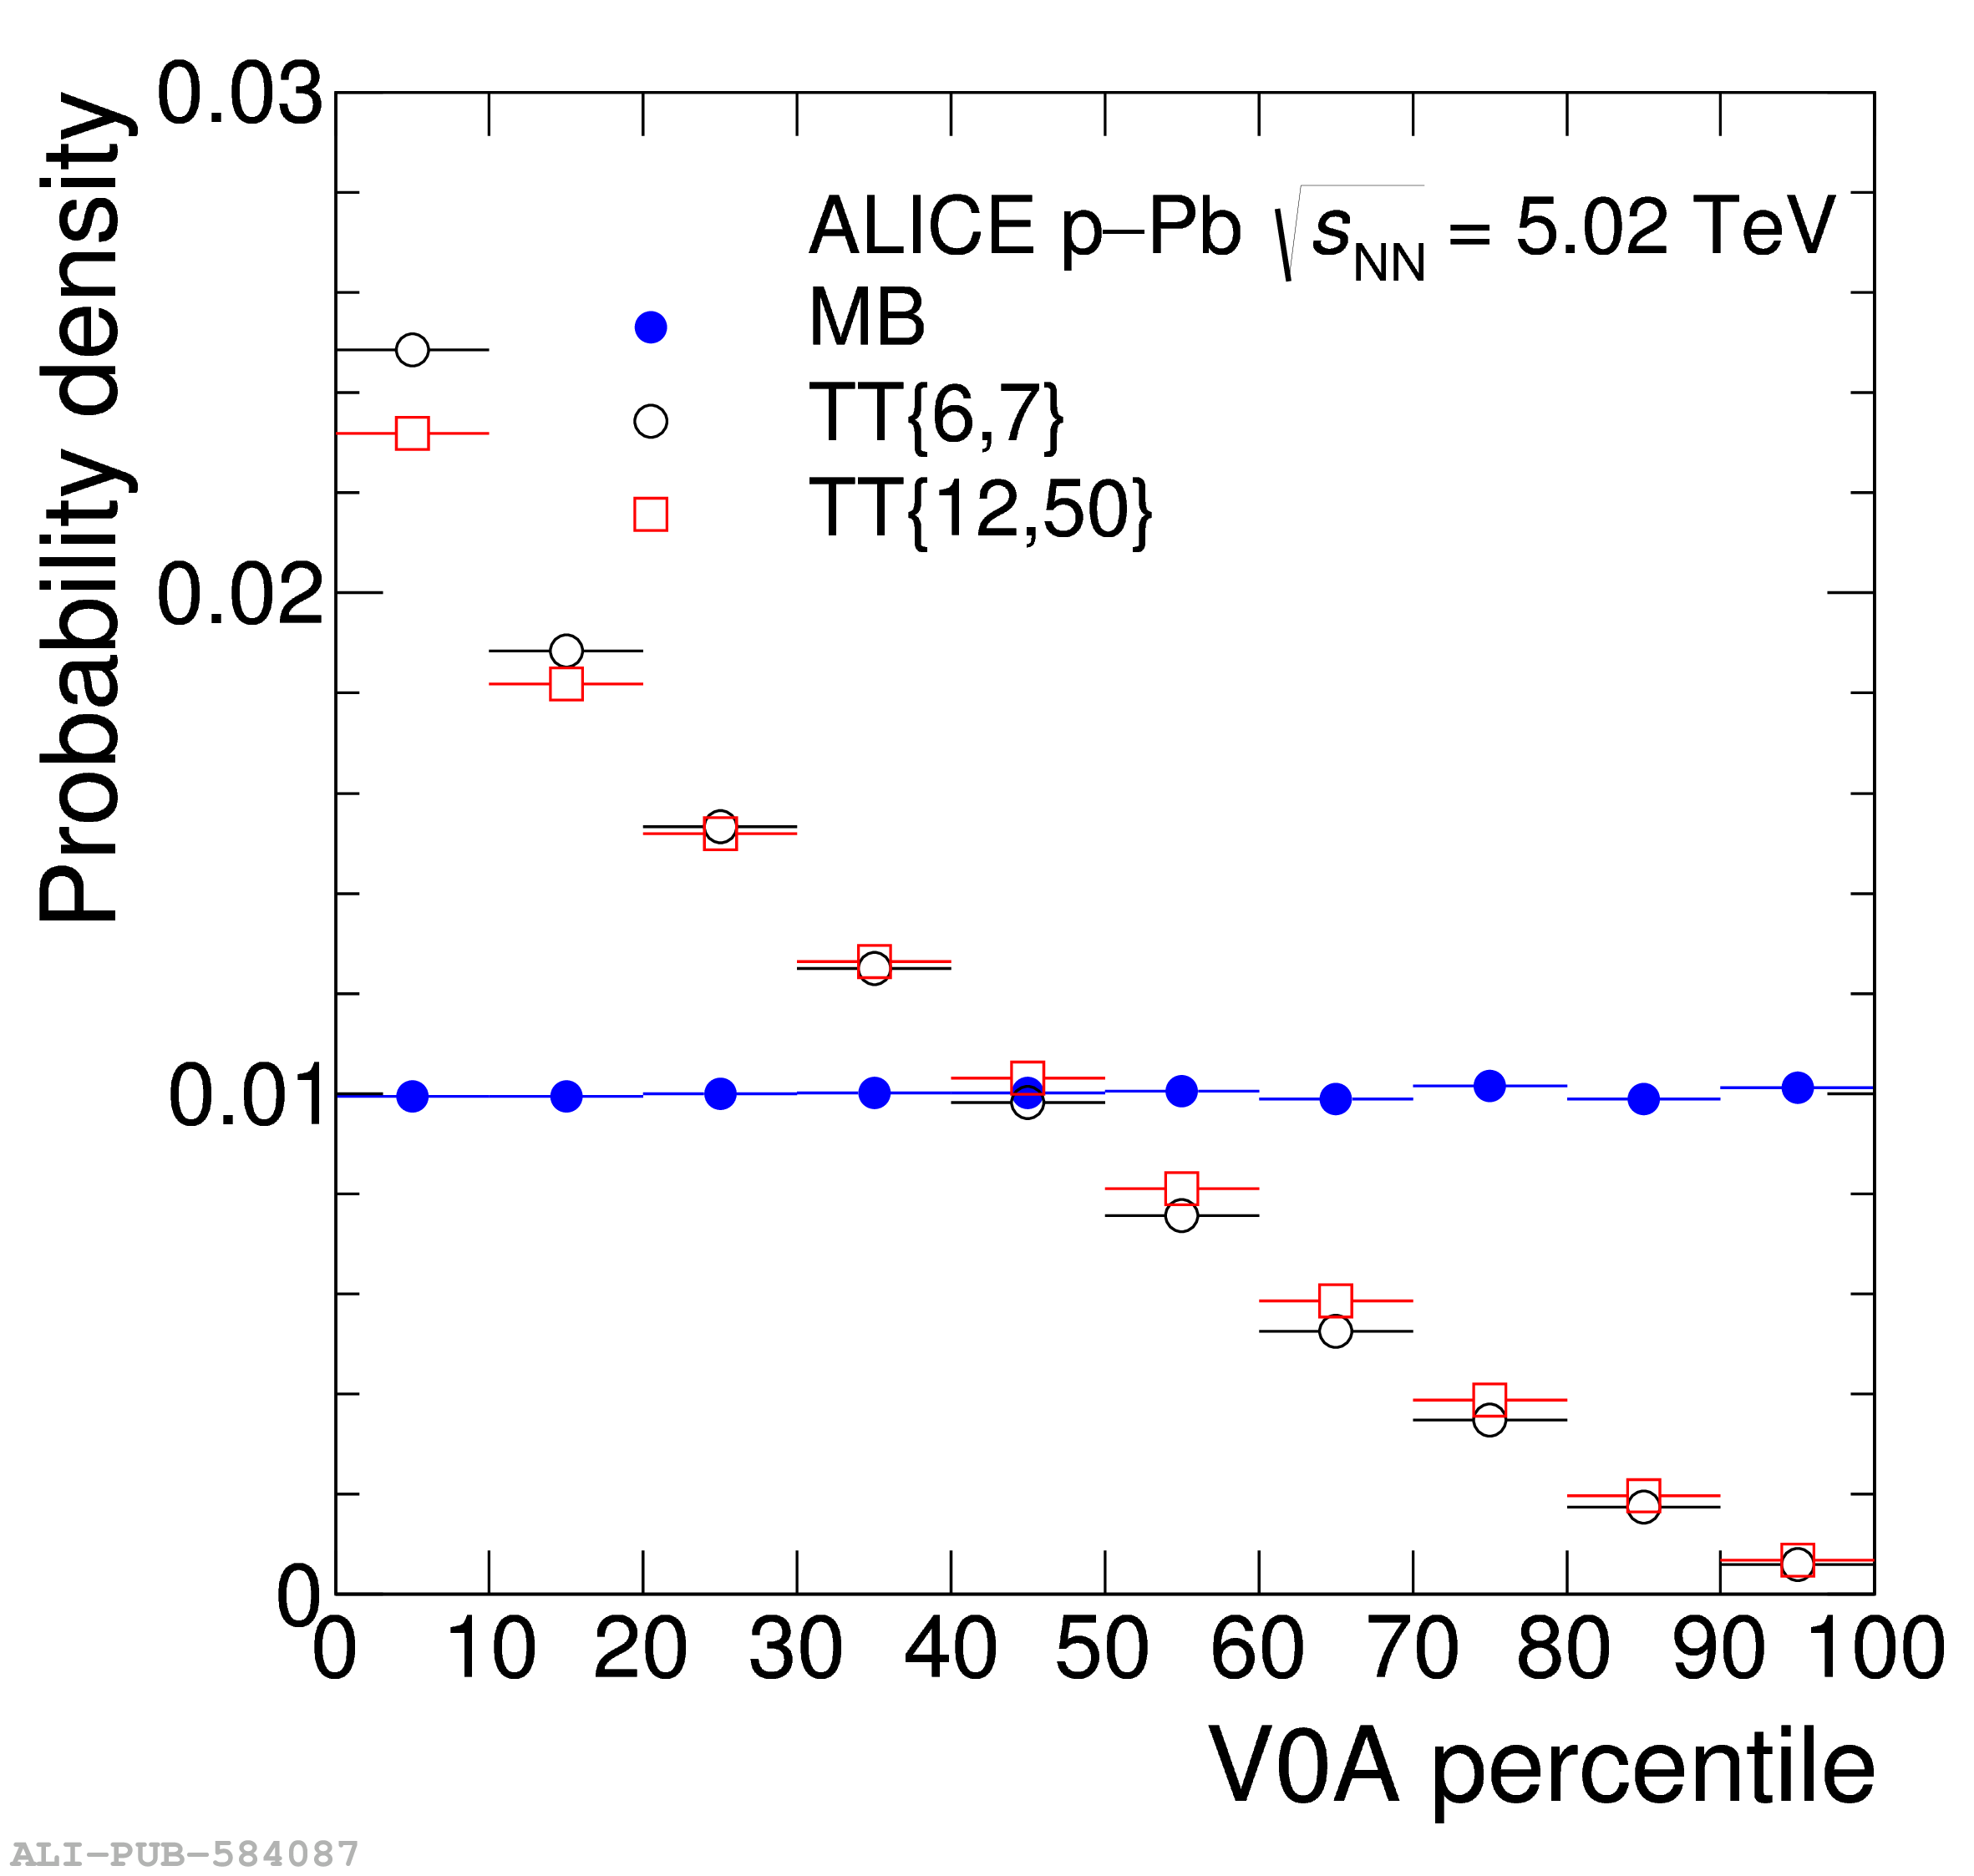
Probability distribution of EA (V0A) in \pPb\ events, in decile bins . Blue: MB events; red and black: events selected by presence of a high-\pT\ charged track in the central region. See text for details.

Figure 89

Inclusive hadron production in \pPb\ collisions (Top) Inclusive yield ratio \RpPb\ for MB \pPb\ collisions, for charged hadrons , \pizero , and prompt D mesons . (Bottom) Inclusive yield ratio \QpPb\ for EA-selected \pPb\ collisions (0--10\% ZNA), for inclusive charged hadrons  and prompt D mesons . Global normalisation uncertainties of 4\% for \RpPb\ and 7\% for \QpPb\ are not shown in the figure.

Figure 90

Ratio of semi-inclusive recoil jet distributions, \Drecoil, for high-EA and low-EA \pPb\ collisions , using V0A. Charged-particle jets are reconstructed with anti-\kT, $R=0.4$. Vertical lines show the statistical error Grey boxes show the systematic uncertainty of the ratio, which accounts for correlated uncertainty in numerator and denominator. The red line indicates the ratio for a \pT-shift of the high-EA distribution of $-0.4$\,\gev, corresponding to the 90\% CL limit in medium-induced energy transport out of the jet cone from this measurement.

Figure 91

The ratio of the $\rm Z^0$-boson yield measured by ALICE  and ATLAS  in \PbPb collisions at \fivenn and free-nucleon PDF (CT14) predictions. The ratios are compared to theoretical calculations including EPPS16 parameterisation of the nuclear modification effects.

Figure 92

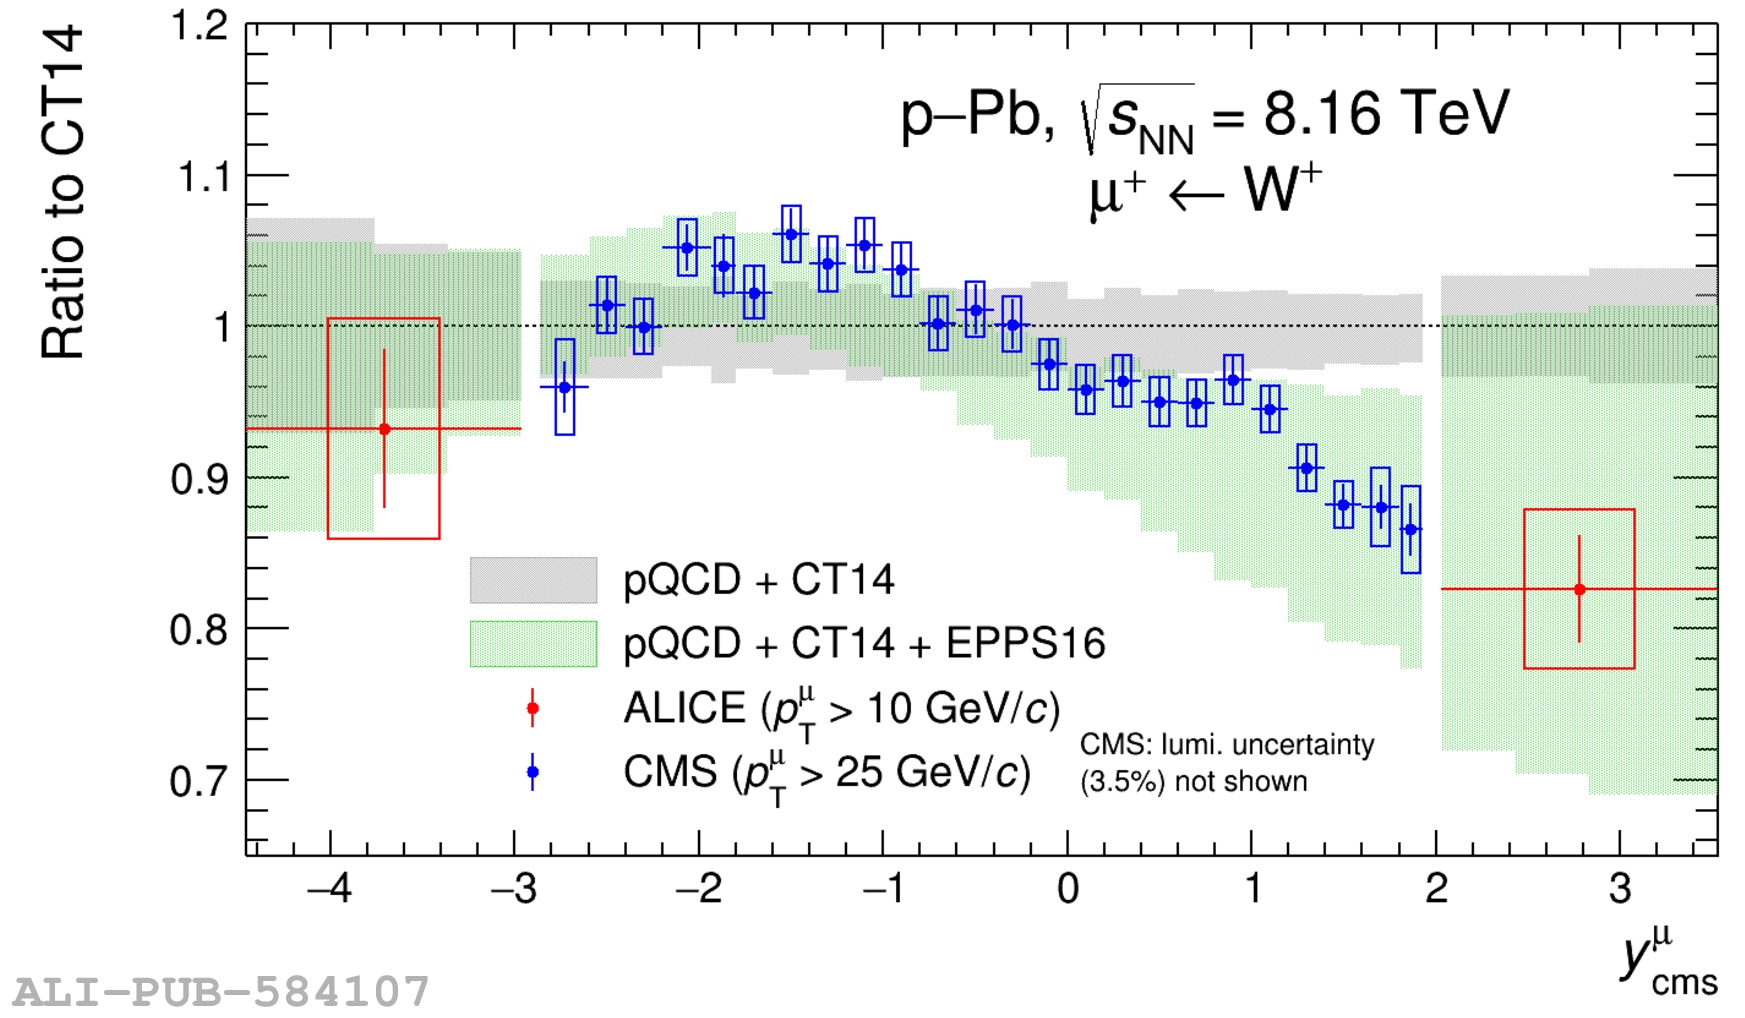
The ratio of $\rm W^+$-boson cross section measured in \pPb collisions at \eightonesixnn to the free-nucleon PDF (CT14) predictions for ALICE  and CMS  data. The ratios are compared to theoretical calculations including nuclear PDF modification effects (CT14 + EPPS16).

Figure 93

Cross section of exclusive $\jpsi$ photoproduction off protons as a function of $W_{\gamma p}$ energy measured by ALICE in \pPb UPC , compared to HERA  and LHCb  results and theoretical models .

Figure 94

(Top) Cross section of coherent $\jpsi$ production measured by ALICE in \PbPb UPC at \fivenn as a function of rapidity  and (Bottom) $|t|$-differential $\jpsi$ photoproduction cross section extracted from the $p_{\rm T}^2$ distribution of coherent \jpsi at midrapidity (right panel) . The data are compared to various theoretical models.

Figure 95

Coherent $\jpsi$ photoproduction cross section measured by ALICE in hadronic \PbPb collisions as a function of $N_{\rm part}$ . Results are compared with theoretical calculations from Ref.  (GG-hs), Ref.  (S2 and S3 scenarios within the IIM and GBW dipole models) and from Ref.  (VDM).

Figure 96

(Top) The coherent $\rho$ photoproduction cross section as a function of rapidity compared to theoretical calculations . (Bottom) $A$-dependence of the coherent $\rho$ photoproduction cross section with a power-law fit shown by the band and general expectations for several extreme cases discussed in the text .

Figure 97

Heavy-ion d$N_{\rm ch}/$d$\eta$ data (at midrapidity)  scaled by the degrees of freedom from a variety of initial state models. The dotted lines are to guide the eye. The circular markers represent d$N_{\rm ch}/$d$\eta$ divided by the number of participating nucleons in the MC Glauber nucleon model , diamonds use the number of constituent quarks from the MC Glauber constituent quark model , squares the entropy from T$_{\rm{R}}$ENTo , and stars the gluons from IP-Glasma .

Figure 98

Comparisons of ALICE $v_2\{4\}/v_2\{2\}$ results from  to $\varepsilon_{2}\{4\}/\varepsilon_{2}\{2\}$ from the same initial state models shown in the previous figure:the MC Glauber nucleon model , the MC Glauber constituent quark model , T$_{\rm{R}}$ENTo , and IP-Glasma .

Figure 99

Centrality dependence of $\rho \left(v_{\rm 2}^{2}, [ p_{\rm T} ] \right)$ in Pb--Pb collisions at $\sqrt{s_{\rm NN}} = 5.02$ TeV . The statistical (systematic) uncertainties are shown with vertical bars (filled boxes). The initial state estimations are represented by lines in the figures, while IP+Glasma+MUSIC+UrQMD , v-USPhydro , Trajectum , and JETSCAPE  hydrodynamic model calculations are shown with hatched bands.

Figure 100

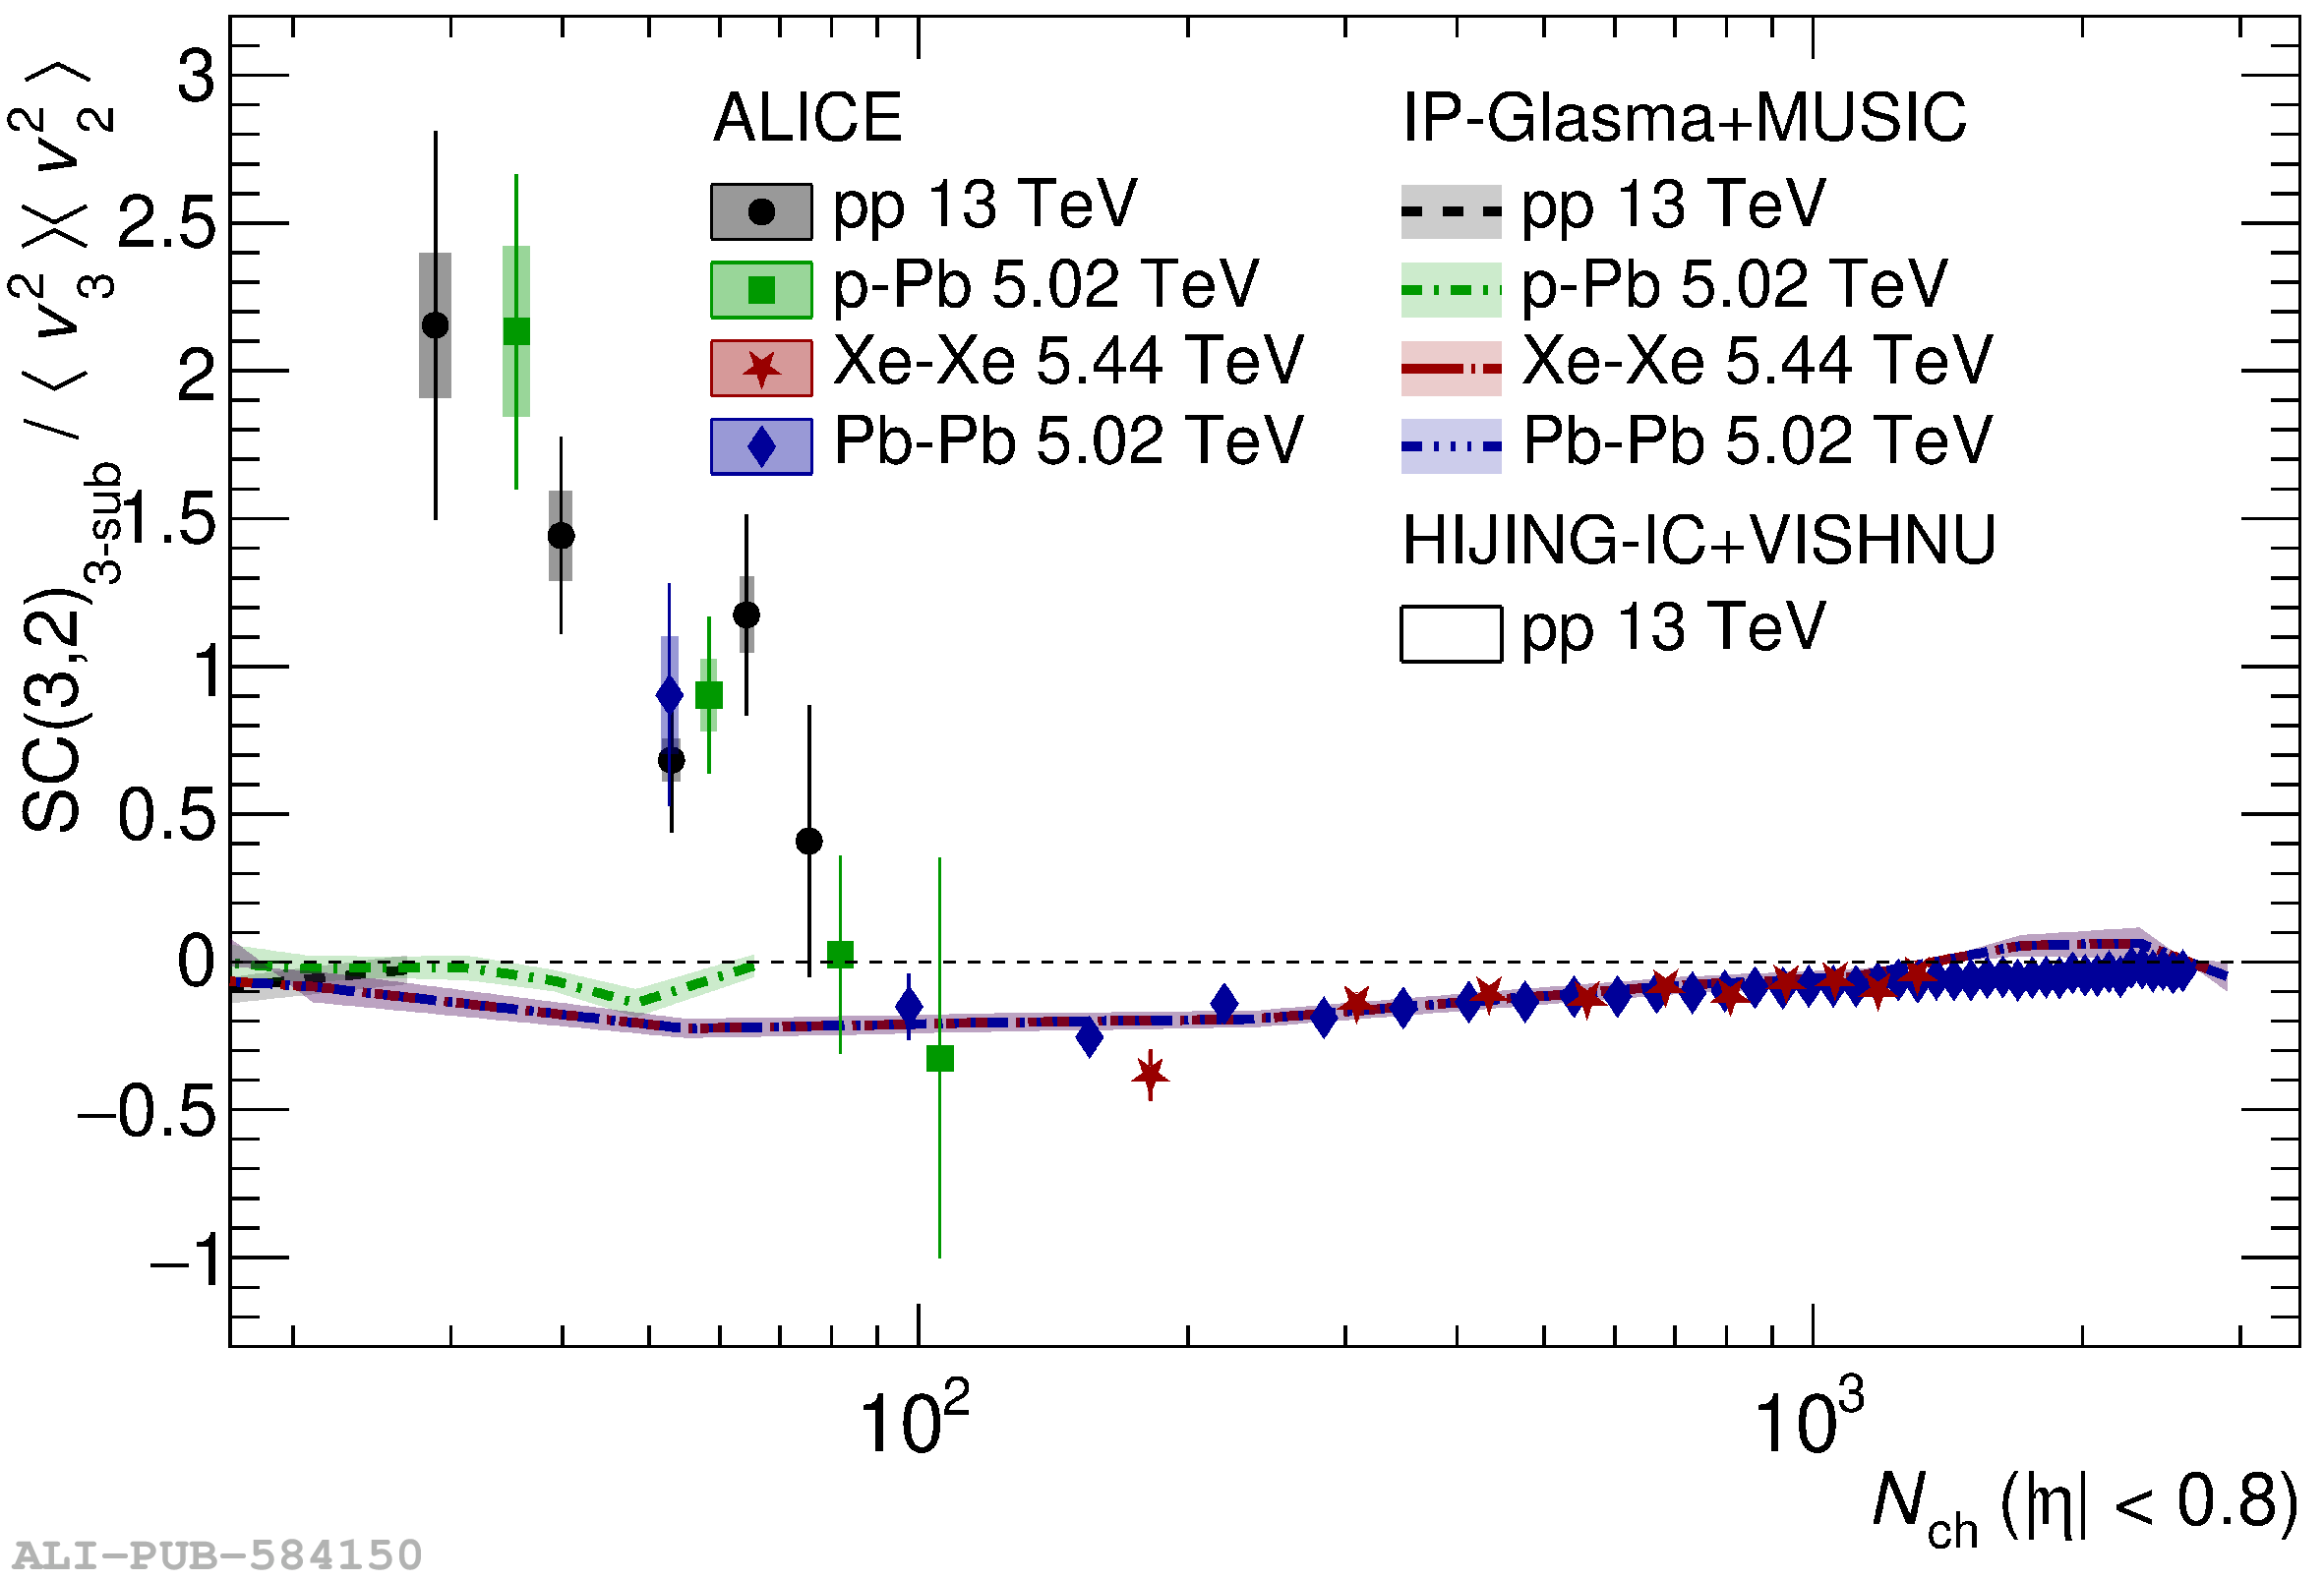
Normalised Symmetric Cumulants of the second and third orders from a variety of collisions as a function of the number of charged hadrons . They are compared to predictions from the IP-Glasma+MUSIC model .

Figure 101

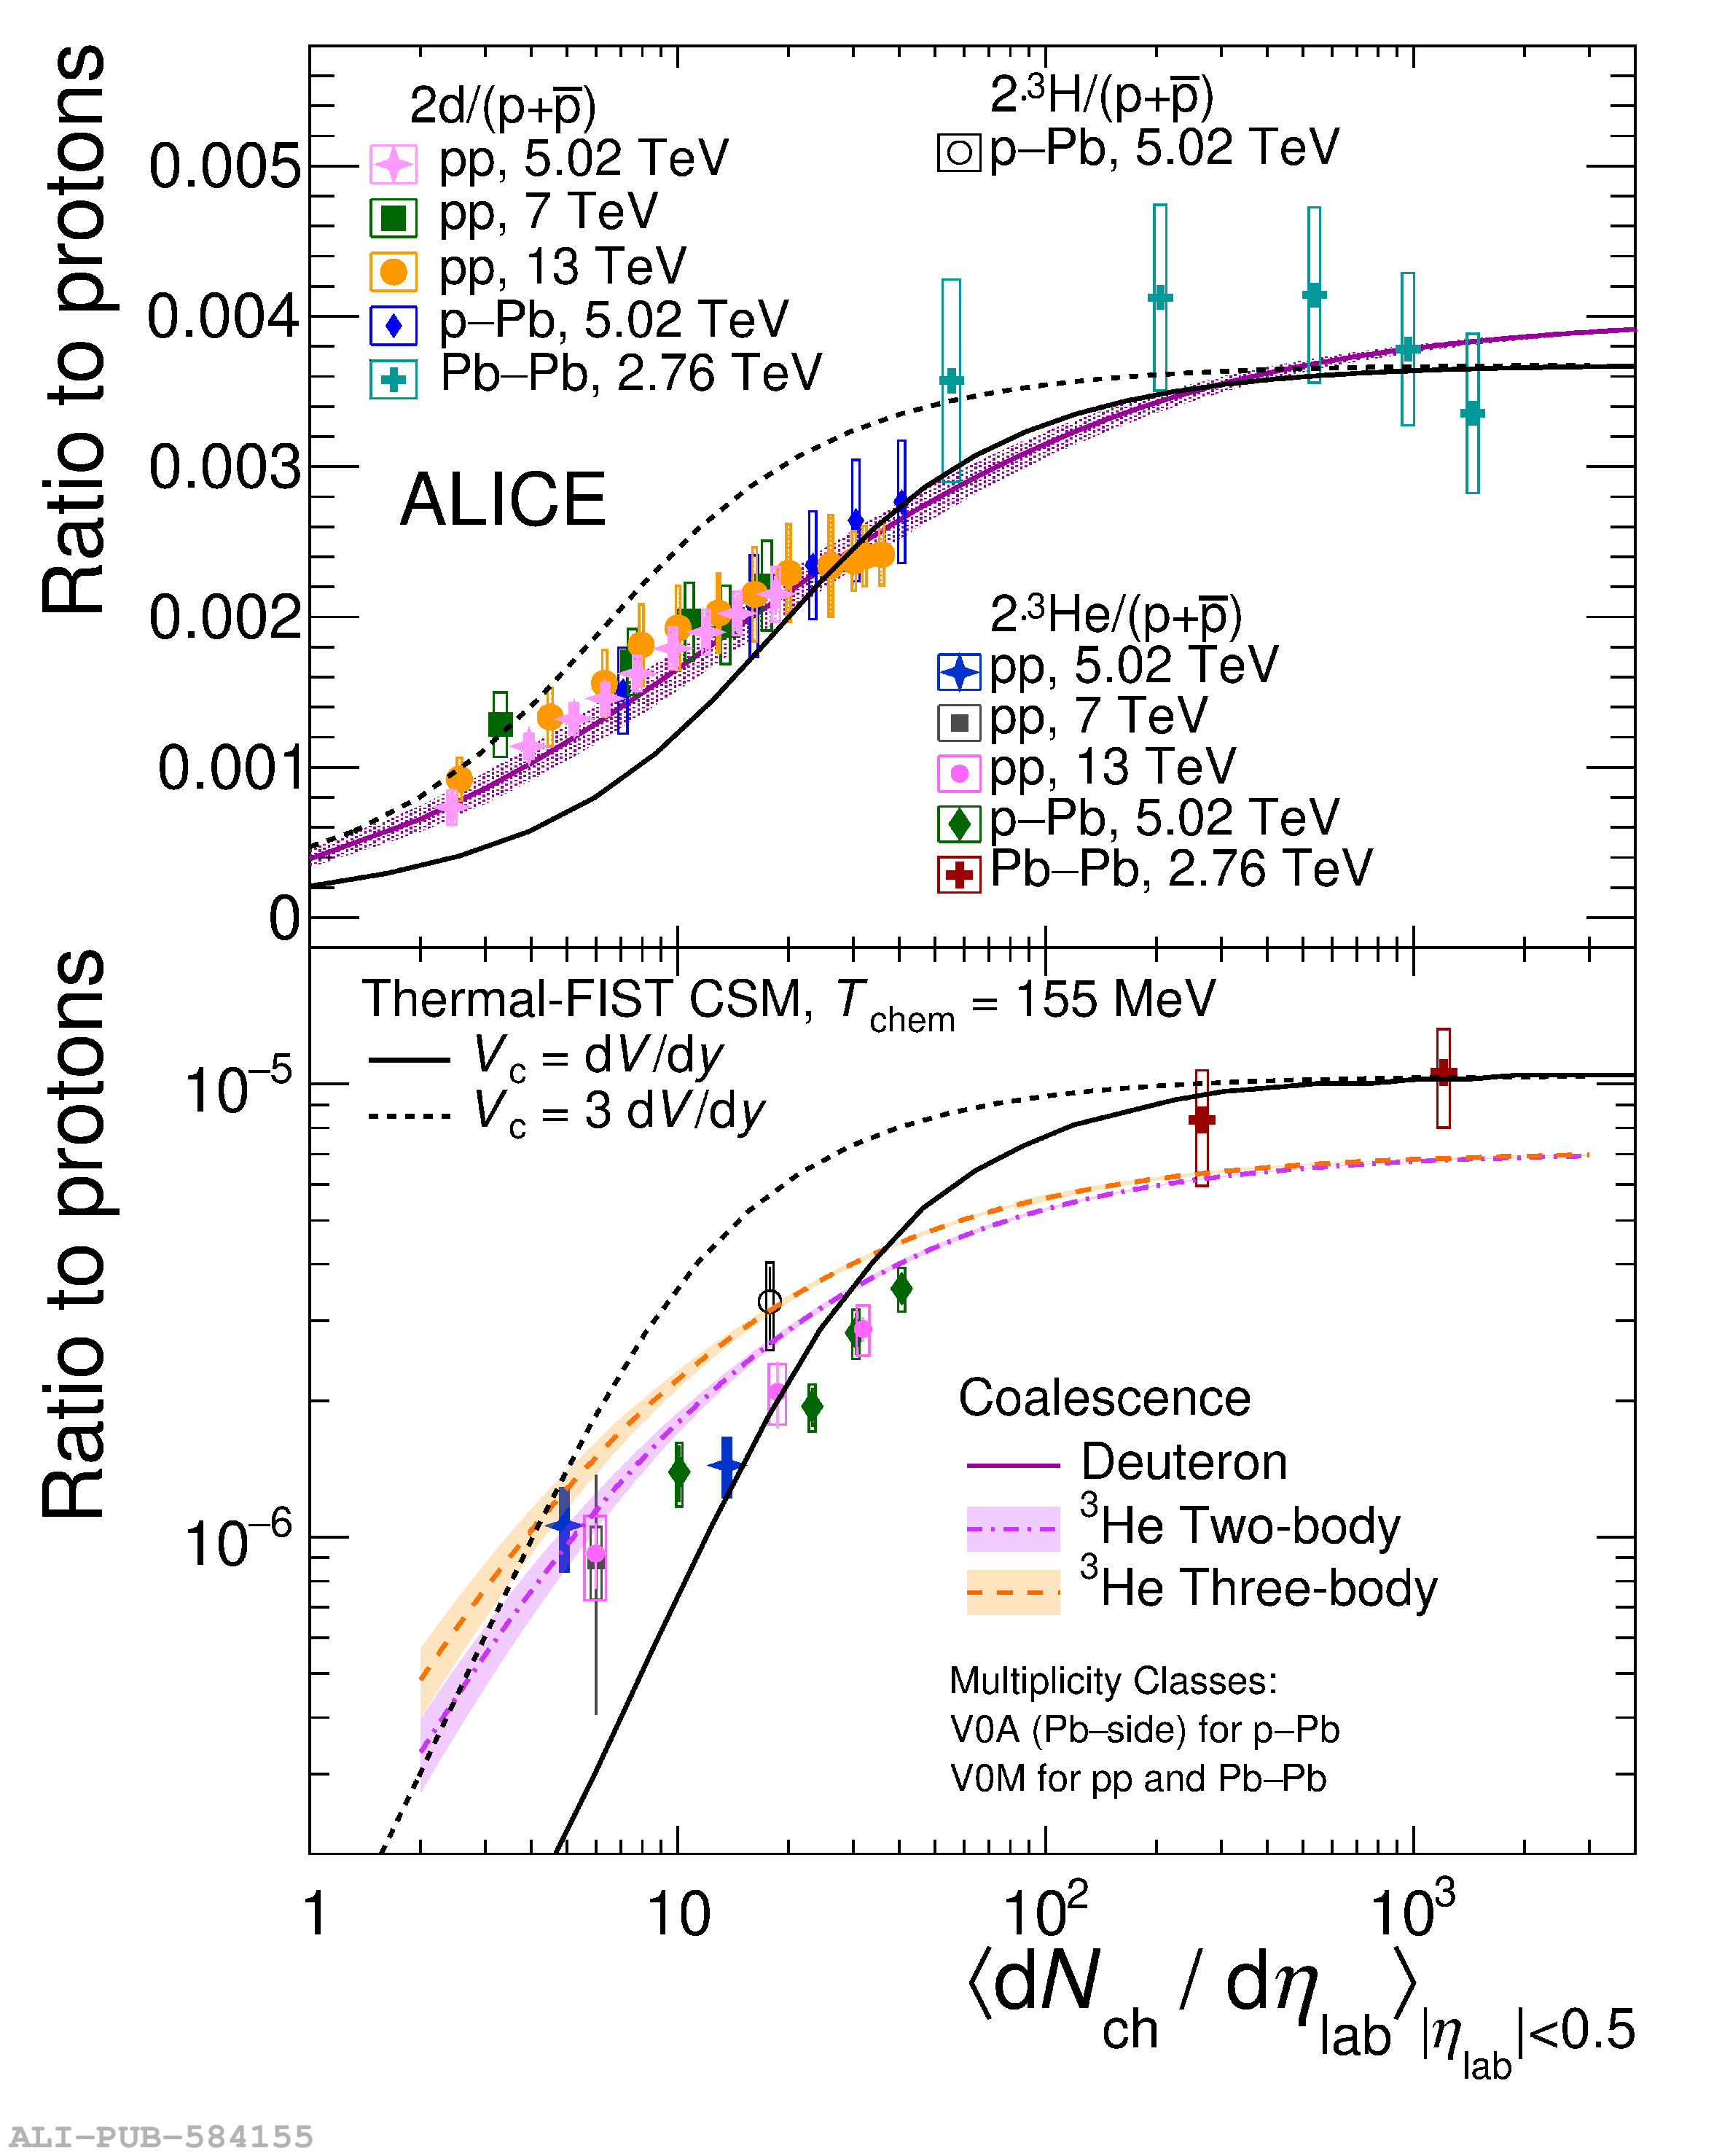
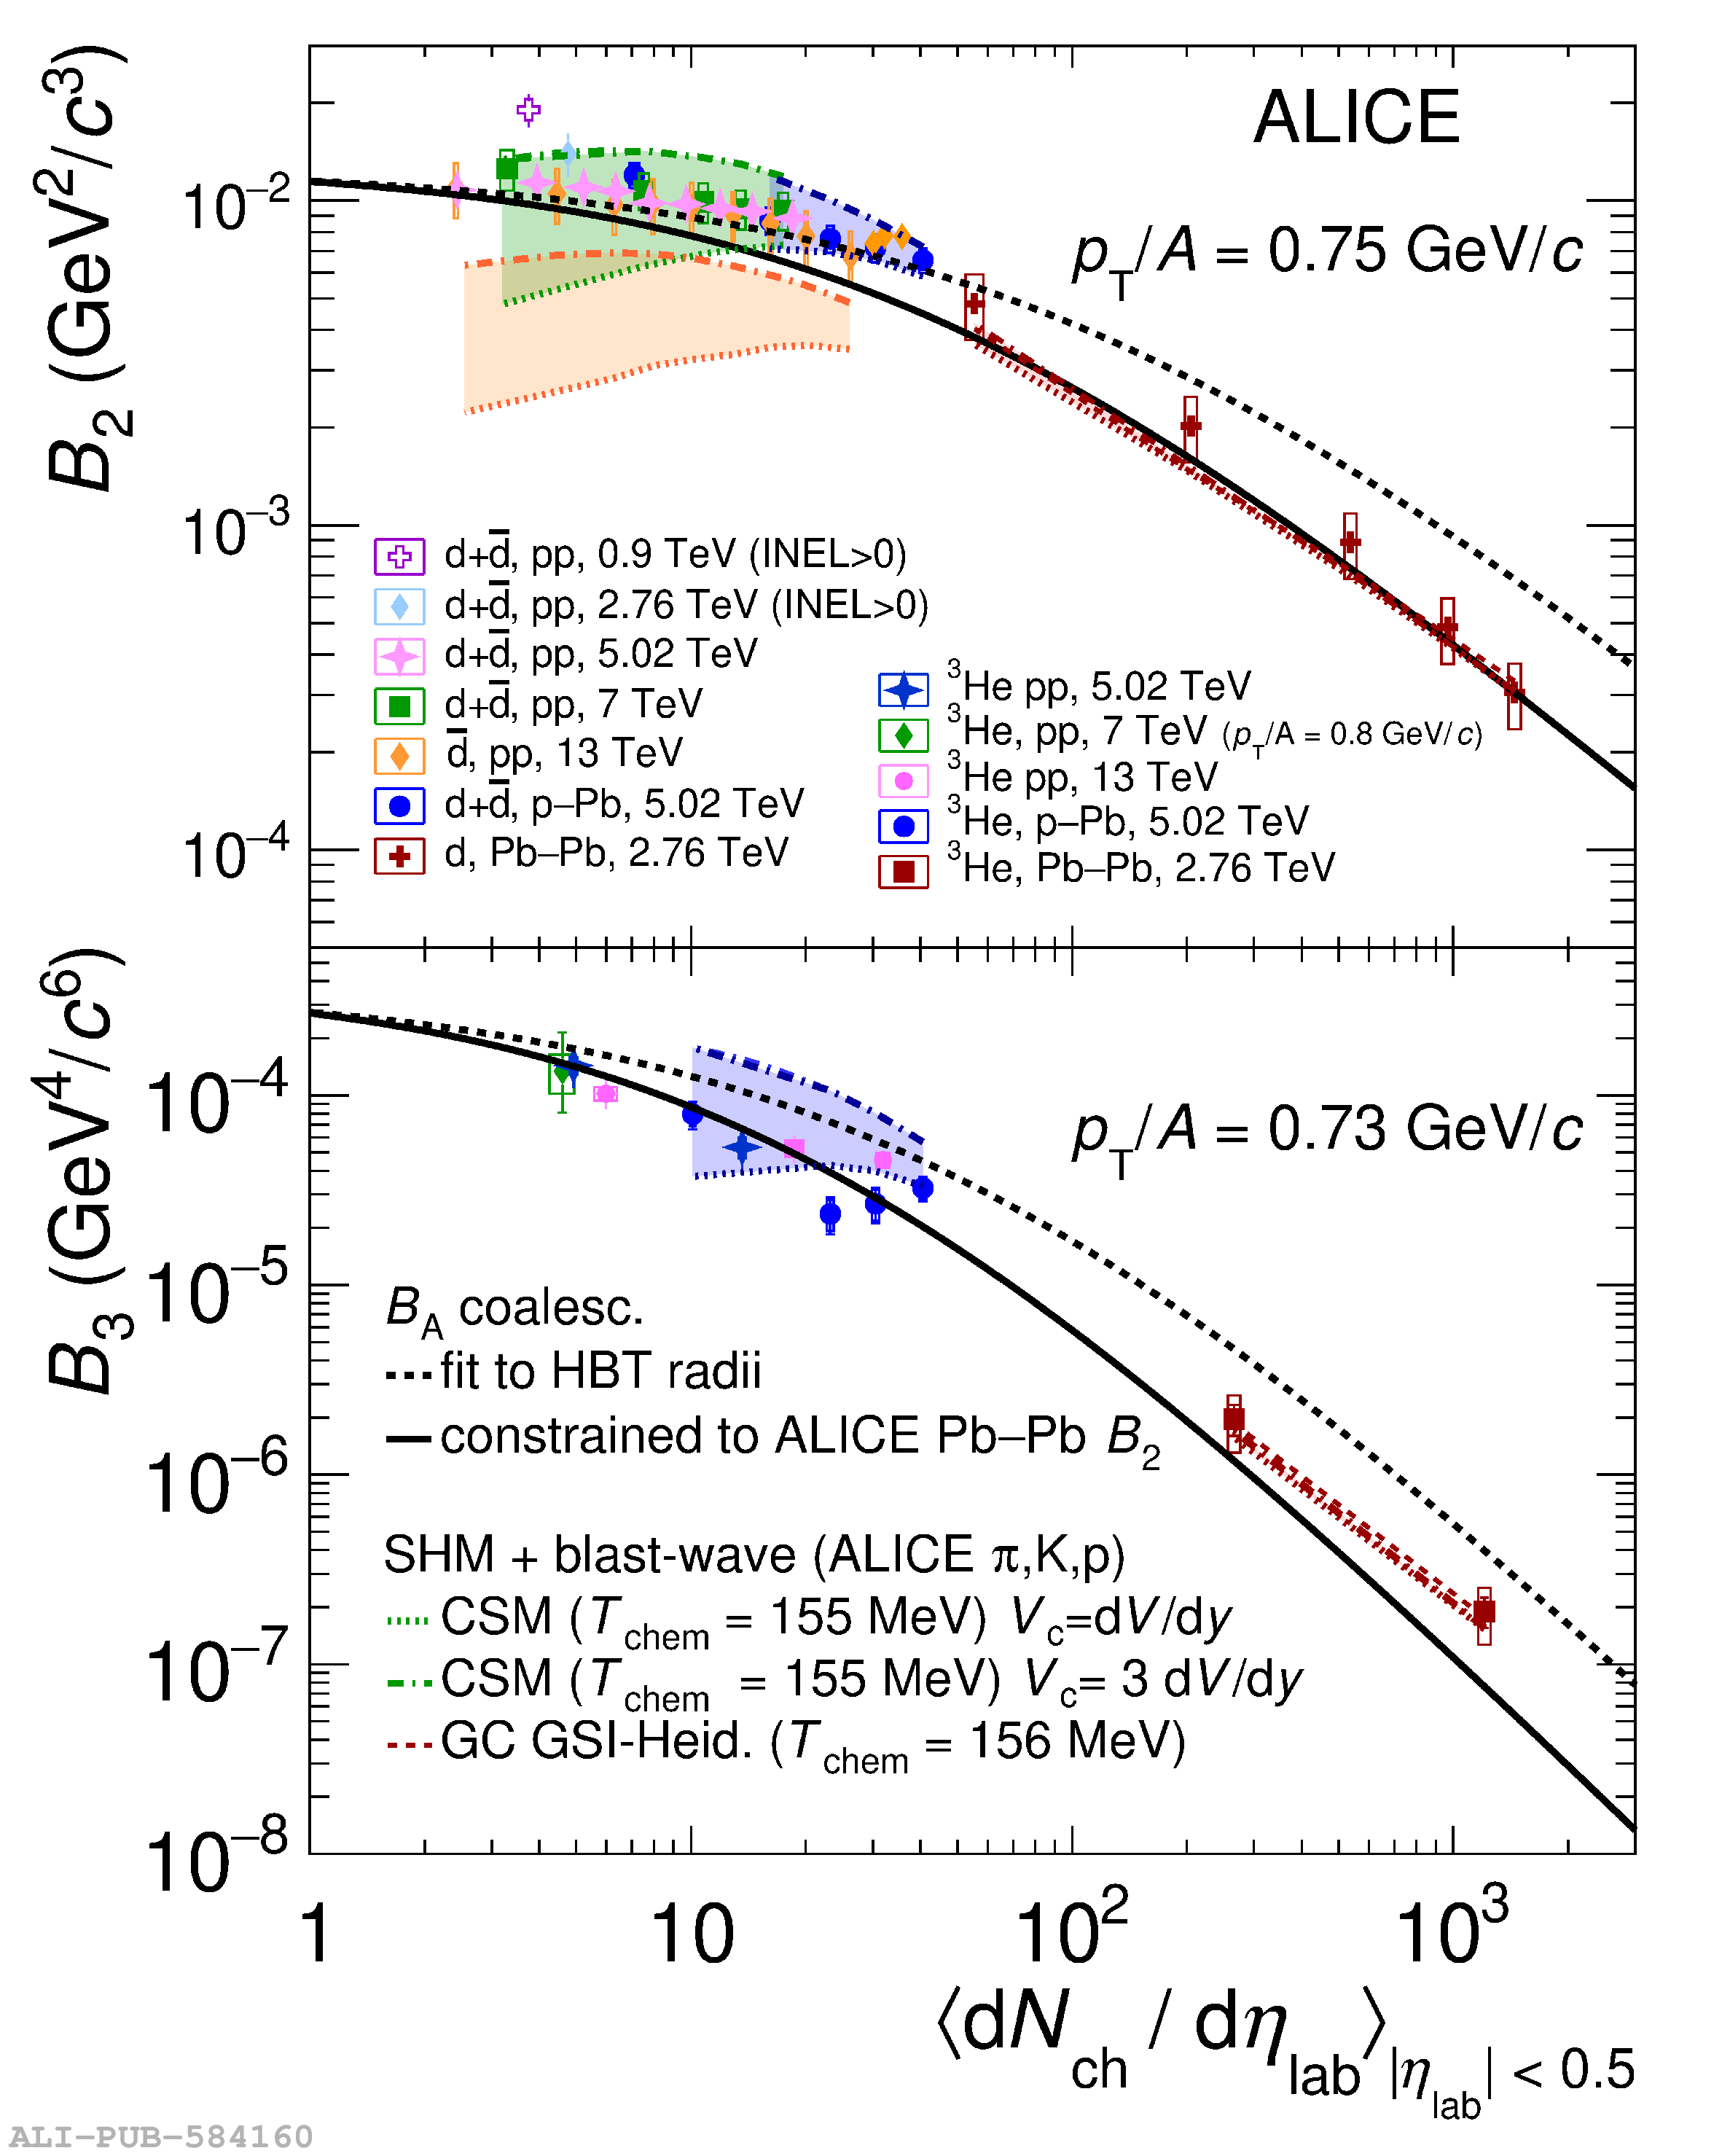
(Left) d/p ratio (Top) and \he/p ratio (Bottom) in pp, p--Pb, and Pb--Pb collisions  as a function of the mean charged-particle pseudorapidity density. (Right) Coalescence parameters $B_2$ (Top) and $B_3$ (Bottom) as a function of the mean charged-particle pseudorapidity density for \pt/$A$ = 0.75 \gmom\ (0.73 \gmom) calculated using the average of particles and antiparticles. In all panels the expectations for the canonical statistical hadronisation model (SHM) evaluated with Thermal-FIST  and coalescence approaches  are shown. For the SHM, two different values of the correlation volume $V_{\rm c}$  are displayed. The uncertainties of the coalescence calculations, which are due to the theoretical uncertainties on the emission source radius, are denoted as shaded bands.

Figure 102

(Left) $^{3}_\Lambda$H/$\Lambda$ measurements in p--Pb (in red) and Pb--Pb collisions (in blue) as a function of $\langle \dnchdeta \rangle$ . The vertical lines and boxes are the statistical and systematic uncertainties, respectively. The expectations for the SHM and coalescence models are shown as lines and bands, respectively. (Right) (anti)deuteron \vtwo\ as a function of \pt\ for \PbPb at \snn = 5.02 TeV in two centrality intervals. Results for \mbox{10--20\%} and \mbox{40--50\%} centrality intervals shown as green circles and magenta squares, respectively. Data are compared with the expectations from simple coalescence model and predictions obtained from a blast-wave fit to the \vtwo(\pt) of pions, kaons, and protons , shown as shaded bands and dashed lines, respectively. In the lower panel, the ratios between the coalescence model predictions are shown as bands, while the ratio to the \mbox{blast-wave} predictions are shown as markers.

Figure 103

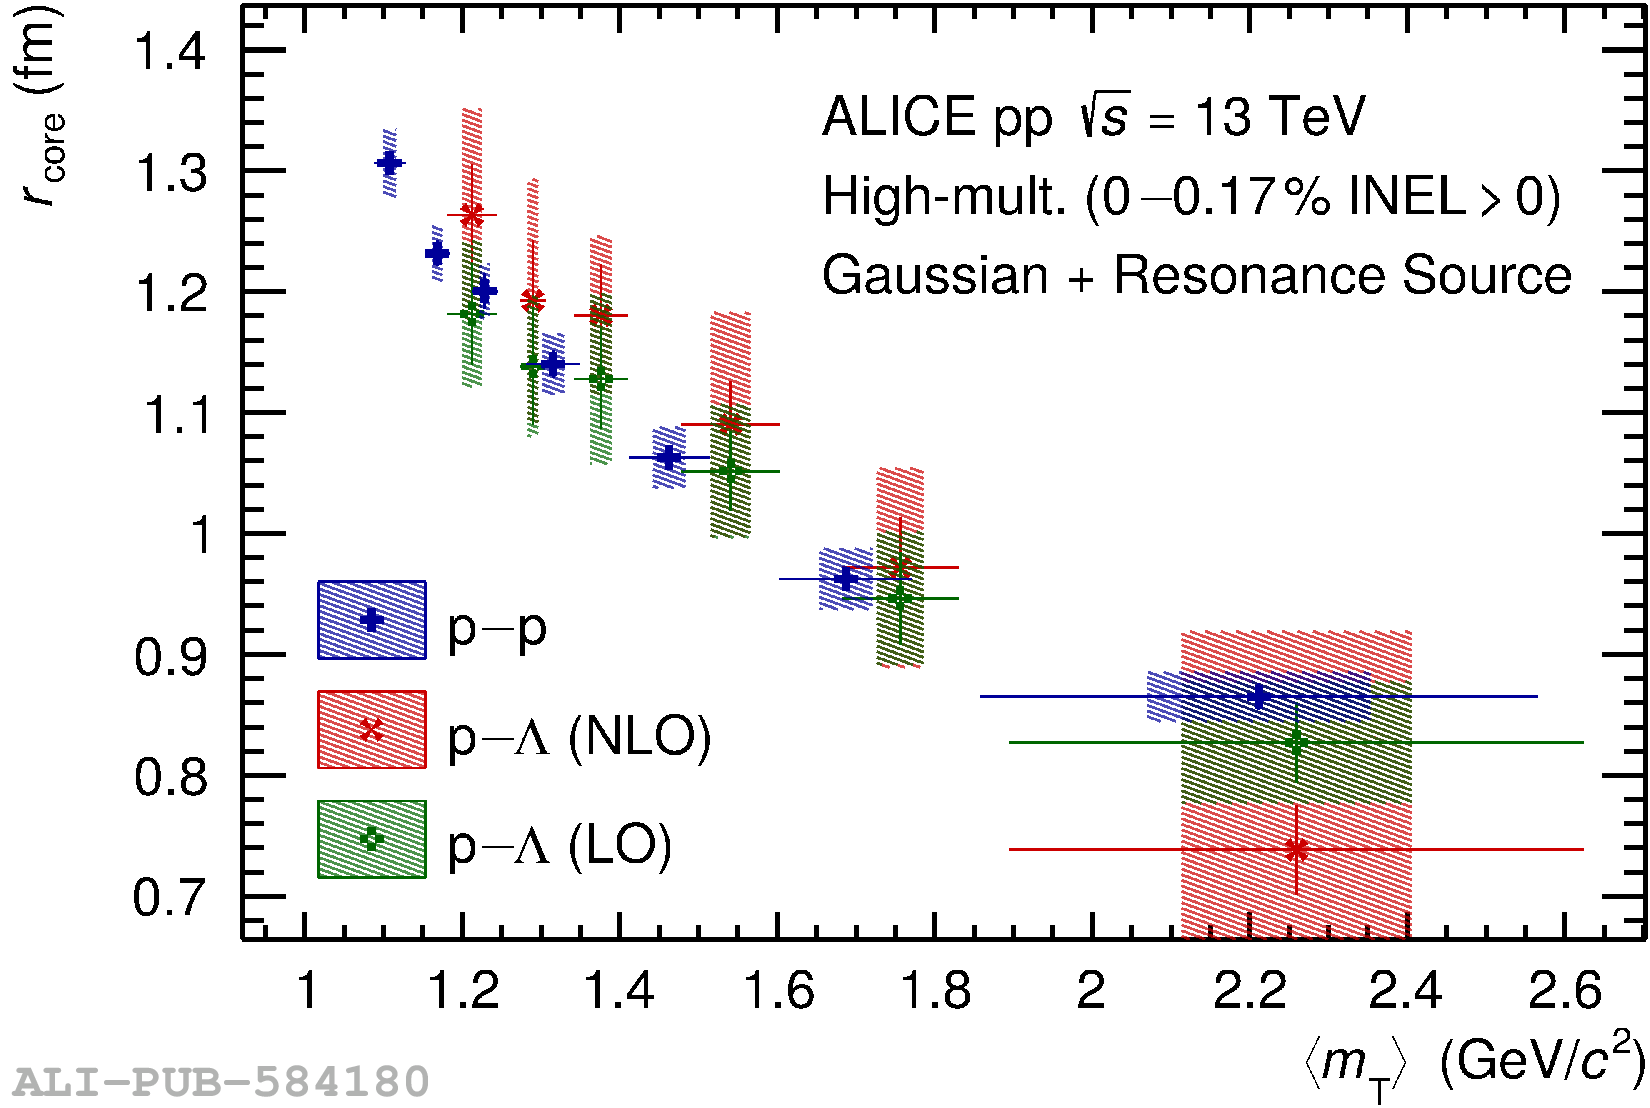
(Left) Source radius $r_\mathrm 0$ as a function of $\langle\mt\rangle$ for the assumption of a purely Gaussian source. (Right) Source radius $r_{\mathrm{core}}$ as a function of $\langle\mt\rangle$ for the assumption of a Gaussian source with added resonances. The blue crosses result from fitting the \pP correlation function with the strong Argonne $v_{18}$  potential. The green squared crosses (red diagonal crosses) result from fitting the \pL correlation functions with the strong $\chi$EFT LO  (NLO ) potential. Statistical and systematic uncertainties are indicated by vertical bars and boxes, respectively .

Figure 104

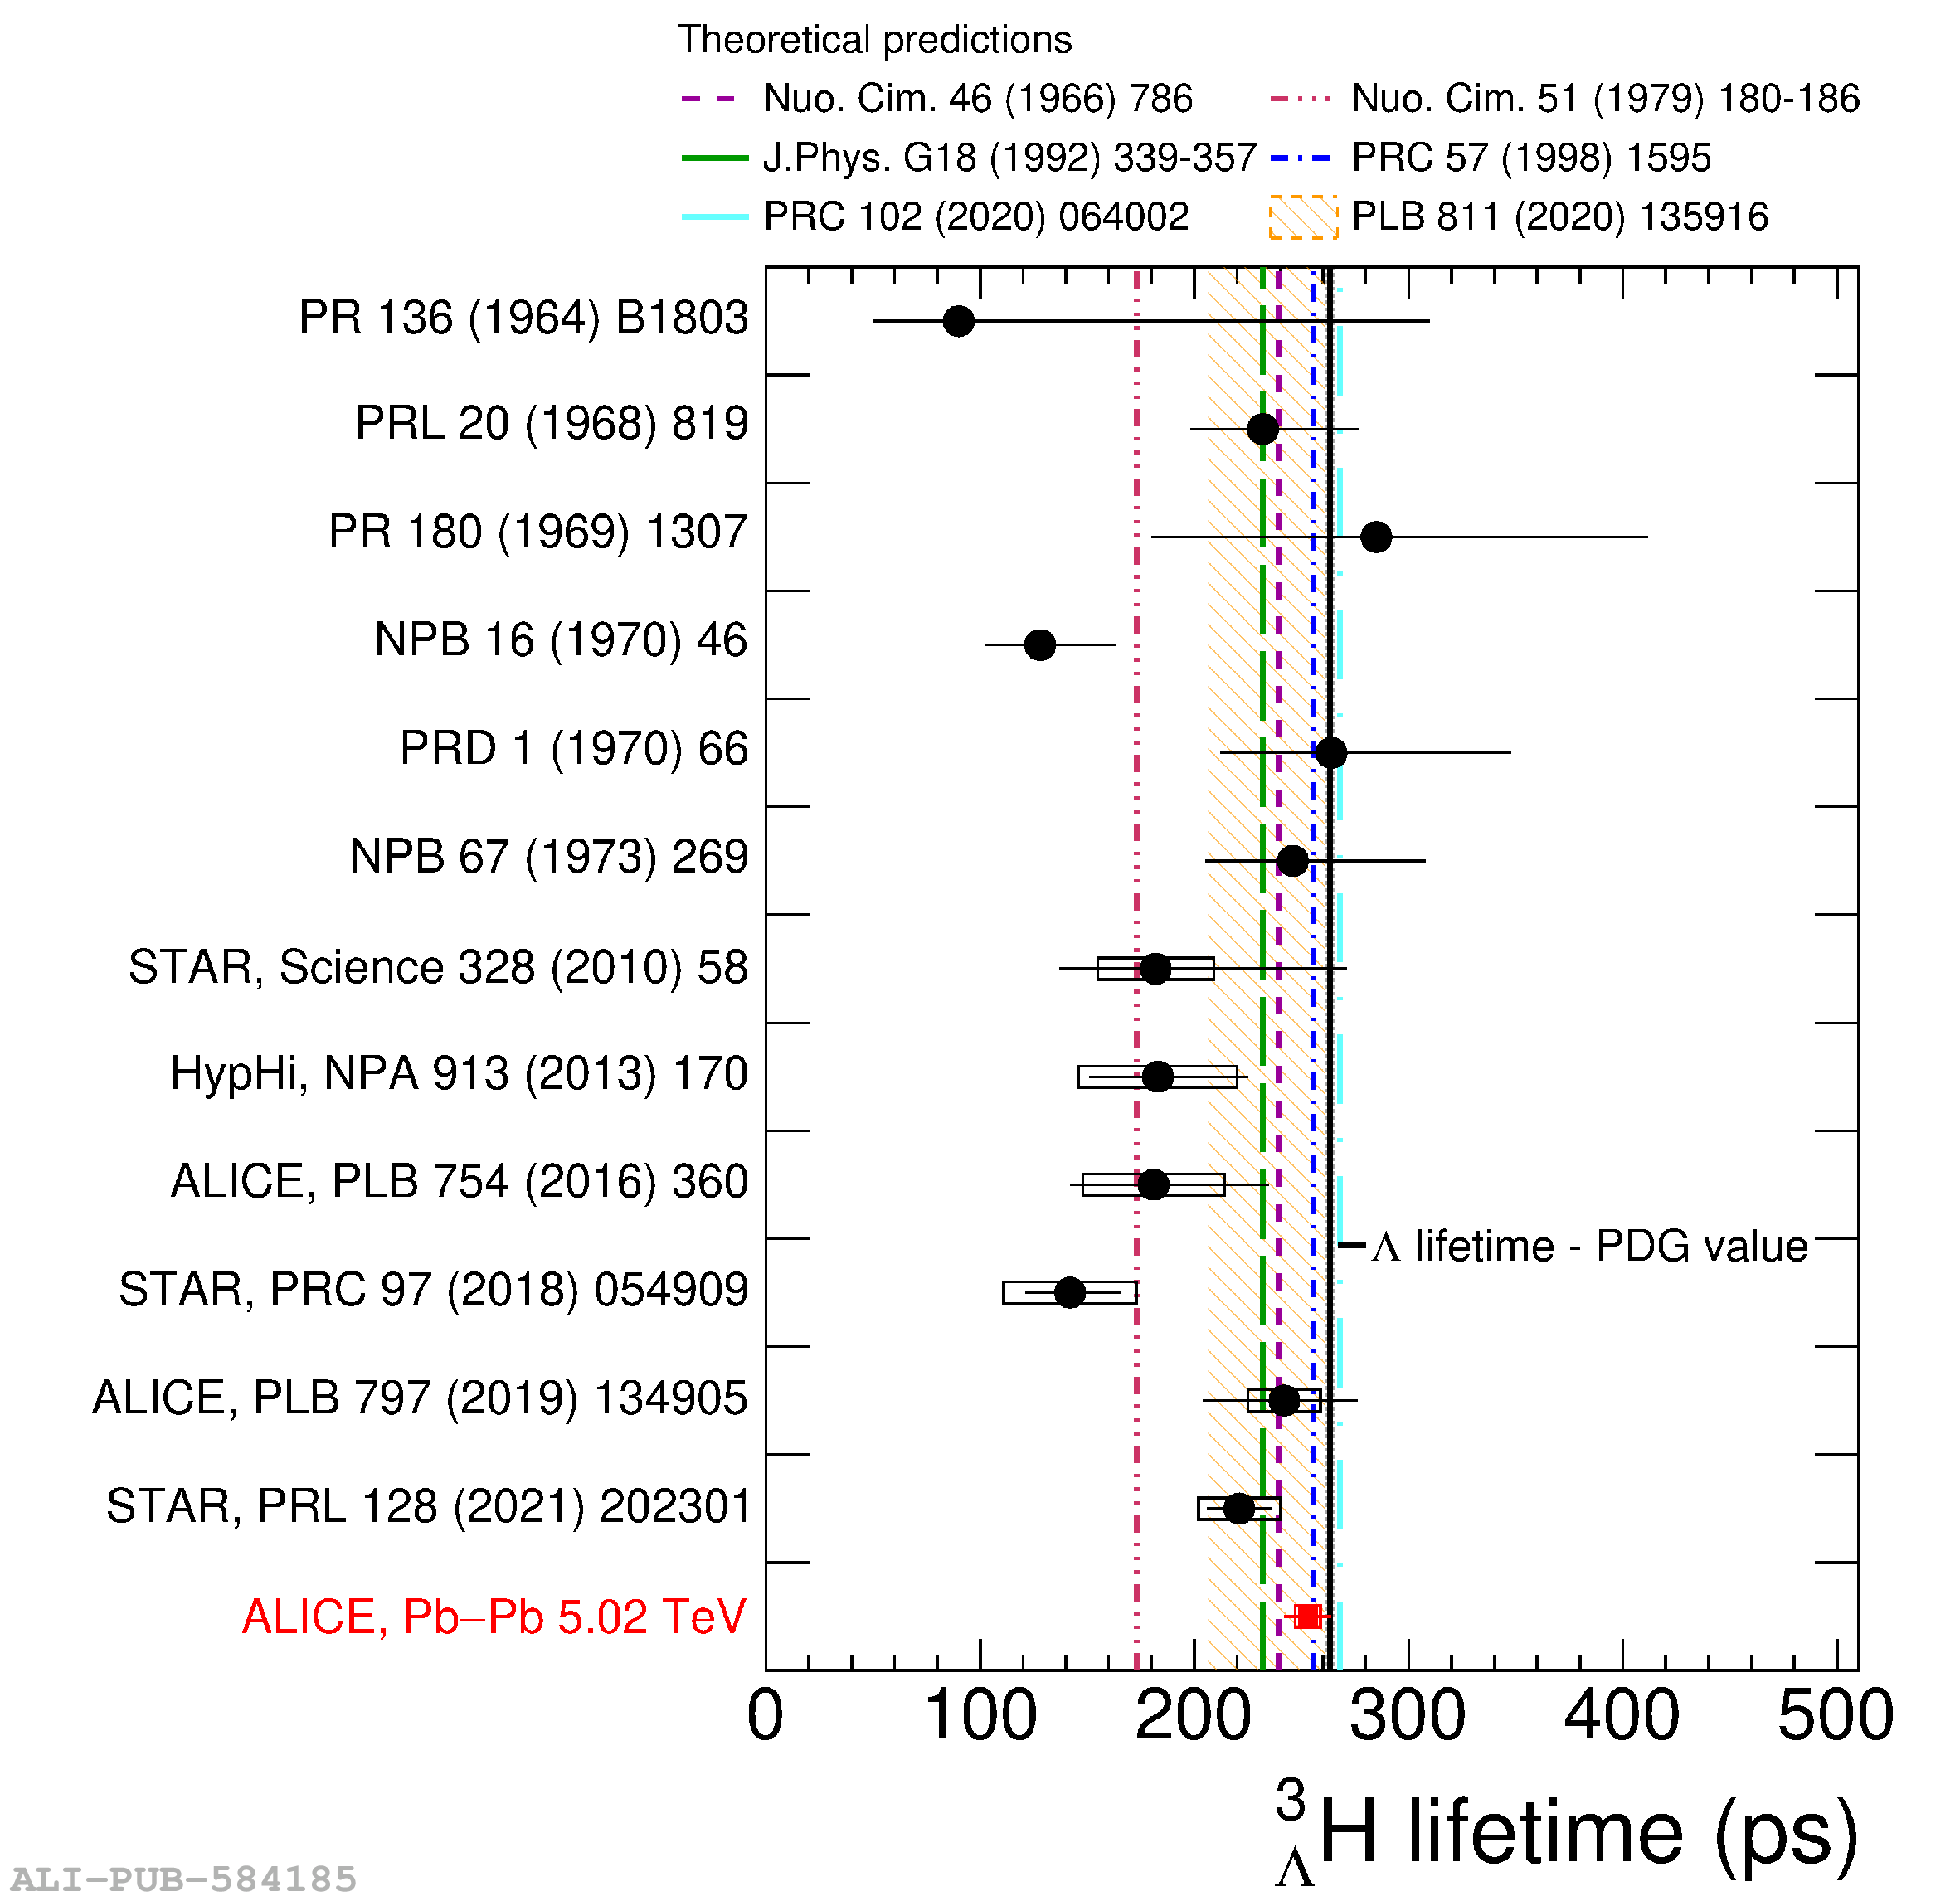
Collection of the \hyp\ lifetime measurements obtained with different experimental techniques. The lowest point corresponds to the latest ALICE measurement  The horizontal lines and boxes are the statistical and systematic uncertainties respectively. The orange band represents the average of the lifetime values and the lines at the edge correspond to 1$\sigma$ uncertainty. The dashed-dotted lines represent five theoretical predictions .

Figure 105

p--$\Lambda$ correlation function measured in pp collisions at $\sqrt{s}$ = 13 TeV  compared to theoretical predictions obtained using the NLO19 version of $\chi$EFT. On the right fit is performed assuming a residual p--$\Sigma^0$ interaction as predicted by \chiEFT, while on the right a negligible interaction is assumed. The middle panels show a zoomed version along the $y$-axis, to further investigate the kinematic cusp, around 290 MeV/$c$ corresponding to the N$\Sigma\leftrightarrow$N$\Lambda$ coupling. The bottoms panel show the discrepancy of model to the data.

Figure 106

Measured \pXim (Top) and \pOm (Bottom) momentum correlation functions in \pp collisions at \mbox{$\sqrt{s}=13$ Te\kern-.1emV\xspace} . The experimental data are shown as black symbols. The black vertical bars and the grey boxes represent the statistical and systematic uncertainties, and the square brackets show the $k^*$ bin width. The measurements are compared with theoretical predictions, shown as coloured bands, that assume either Coulomb or Coulomb+strong \HALQCD interactions. The width of the curves including \HALQCD predictions represents the uncertainty associated to the calculation and the grey shaded band represents the uncertainties associated with the determination of the source radius.

Figure 107

(Left) Sketch of the system configuration in femtoscopic measurements, where only the final $\mathrm{K^-}$--p channel is measured. (Middle and right) Theoretical correlation function for $\mathrm{K^-}$--p, from the pure elastic term (dotted line) to the full \CF (solid line) with all coupled-channels ($\mathrm{\overline{K}^0}$--n, $\pi$--$\Sigma$, $\pi$--$\Lambda$) included. The results are shown for two different radii, typically achieved in pp collisions (1 fm) and in heavy-ion collisions (5 fm).

Figure 108

Measured correlation function versus the relative momentum $\ks$ for \mbox{$\kam$--p $\oplus$ $\kap$--$\pbar$} pairs in pp collisions at $\sqrt{s}$ = 13 TeV (left), in \mbox{40--60\%} centrality interval in \pPb collisions at \snn = 5.02 TeV (middle) and in \mbox{60--70\%} centrality Pb--Pb collisions at \snn = 5.02 TeV (right) . In all the panels, data are compared with the \chiEFT-based potential  with fixed (blue bands) and free (red bands) coupling weights.

Figure 109

Example of correlation functions (points) of $\rm p$--$\rm \overline{p}$, $\rm p$--$\overline{\Lambda}\oplus\overline{\rm p}$--$\Lambda$, and $\Lambda$--$\overline{\Lambda}$ pair for the 10--20\% centrality class . Dashed lines show a part of the global fit, performed simultaneously to correlation functions of all three pair types in 6 centrality classes.

Figure 110

Comparison of extracted spin-averaged scattering parameters $\Im f_{0}$ and $\Re f_{0}$ (Top) and $d_{0}$ and $\Re f_{0}$ (Bottom) for $\rm p$--$\overline{\Lambda}\oplus \overline{\mathrm{p}}$--$\Lambda$, $\Lambda$--$\overline{\Lambda}$ pairs and effective parameters accounting for the contribution of heavier $\rm B$--$\rm\overline{B}$ pairs . Results are compared with theoretical models  and with results by the STAR collaboration .

Figure 111

(Left) Inclusive full jet cross sections in \pp\ collisions at $\sqrt{s} = 5.02$ TeV for $R=0.1-0.6$, measured by ALICE . (Right) Ratio of various pQCD calculations to data. The systematic uncertainties in the ratio, shown as boxes, are the quadratic sum of the systematic uncertainties in data and calculations. No systematic uncertainty for non-perturbative corrections are included, exceptfor the case of NNLO+LL.

Figure 112

(Left) \pT{}-differential cross section of charged-particle jets tagged with $\rm D^0$ mesons  in \pp\ collisions at $\sqrt{s}=7$ TeV, compared to the POWHEG heavy-quark and di-jet implementations matched to PYTHIA 6 parton shower (Right) \pT{}-differential cross section of b-tagged charged-particle jets in \pp\ collisions at $\sqrt{s}=5.02$ TeV , compared to NLO pQCD prediction by the POWHEG di-jet implementation matched to PYTHIA8 parton shower.

Figure 113

Measurements of ungroomed jet angularities \ang{} in \pp{} collisions at $\sqrt{s}=5.02$ TeV for $R=0.2$ charged-particle jets compared to analytical NLO+NLL predictions . The theoretical calculations are corrected with a folding procedure to account for hadronisation and underlying event effects as well as charged particle jets,using PYTHIA 8 Monash 2013 and HERWIG 7 The distributions are normalised such that the integral of the perturbative region defined by $\ang > \Lambda / (\pTchjet R)$ is unity. Note that the transition from perturbative to non-perturbative is smooth,and this vertical line is merely a visual guide.

Figure 114

Ratio of the neutral pion (Left) and eta meson (Right) invariant cross sections to their respective TCM parametrisations . Additionally, the ratios of NLO pQCD calculations and PYTHIA 8 Monash 2013 predictions to the TCM data fit are shown at the respective centre-of-mass energies. The NLO pQCD blue band in the left panel for $\pi^0$ is obtained considering the factorisation scale values $0.5\pT \mu 2\pT$.

Figure 115

(Left) $\pt$-differential cross sections of prompt and non-prompt $\Dzero$ mesons in pp collisions at $\s=5.02$ TeV  compared with various pQCD-based theoretical calculations. (Right) Ratios of $\pt$-differential production cross sections of prompt and non-prompt $\Dzero$ measurements to theoretical predictions.

Figure 116

(Left) Charmed baryon-to-meson $\Lc/\Dzero$, $\rm \Sigma_{c}^{0,++}/\Dzero$, and $\XicPlusZero{}/\Dzero$ ratios in pp collisions at $\sqrt{s}$ = 13 TeV, in comparison with PYTHIA 8. (Right) Charm and beauty production cross sections per unit of rapidity at midrapidity as a function of the collision energy . STAR and PHENIX measurements in pp collisions at $\sqrt{s}=$ 200 GeV are slightly displaced along the horizontal direction for visibility. Comparison to the FONLL model calculations  and NNLO calcuations  are reported.

Figure 117

Inclusive J/$\psi$ polarisation parameters measured for $3< p_ and in pp collisions at full contour lines show the confidence intervals collins-soper red helicity green filled contours correspond to predictions of either csm or nrqcd model corresponding frames hx>< /p_>

Figure 118

The ratio of the angular distributions of emissions from $\rm{D}^{0}$-tagged to inclusive charged-particle jets in \pp{} collisions at $\sqrt{s}=13$ TeV , shown in three radiator energy intervals of $5 \leq E_{\rm{radiator}} 10$ GeV/$\it{c}$, $10 \leq E_{\rm{radiator}} 20$ GeV/$\it{c}$ and $20 \leq E_{\rm{radiator}} 35$ GeV/$\it{c}$. A selection on the splitting scale of $k_{\rm{T}} > \Lambda_{\rm QCD}$ is applied to suppress hadronisation effects. The shaded regions correspond to the angles within which emissions are suppressed by the dead-cone effect, assuming a charm-quark mass of 1.275 GeV/$c^2$.

Figure 119

(Left) Chemical potential $\mu_i$ of hyperons produced in the inner core of a NS as a function of the energy density, in units of energy density $\epsilon_0$ at the nuclear saturation point. The single-particle potentials depths in symmetric nuclear matter (SNM) for $\Lambda$, $\Sigma$ and $\Xi$ hyperons are displayed. The vertical dotted lines indicate the central energy densities reached for a standard NS of $1.4\,M_\odot$ and for the maximum mass, $2.13\,M_\odot$, reached within this specific EoS. The mean-field calculations  have been tuned in order to reproduce the lattice predicted value of $U_\Xi$ in pure neutron matter (PNM) obtained in , using the in-vacuum results validated by ALICE data in  . The EoS obtained with these constraints provides a stable NS with a maximum mass of $M_{\rm max} = 2.13\,M_\odot$, as seen on the mass-radius plot on the right and is compatible with recent astrophysical measurements of heavy NS, indicated by the orange , green  and blue  bands. See also Ref. .

Figure 120

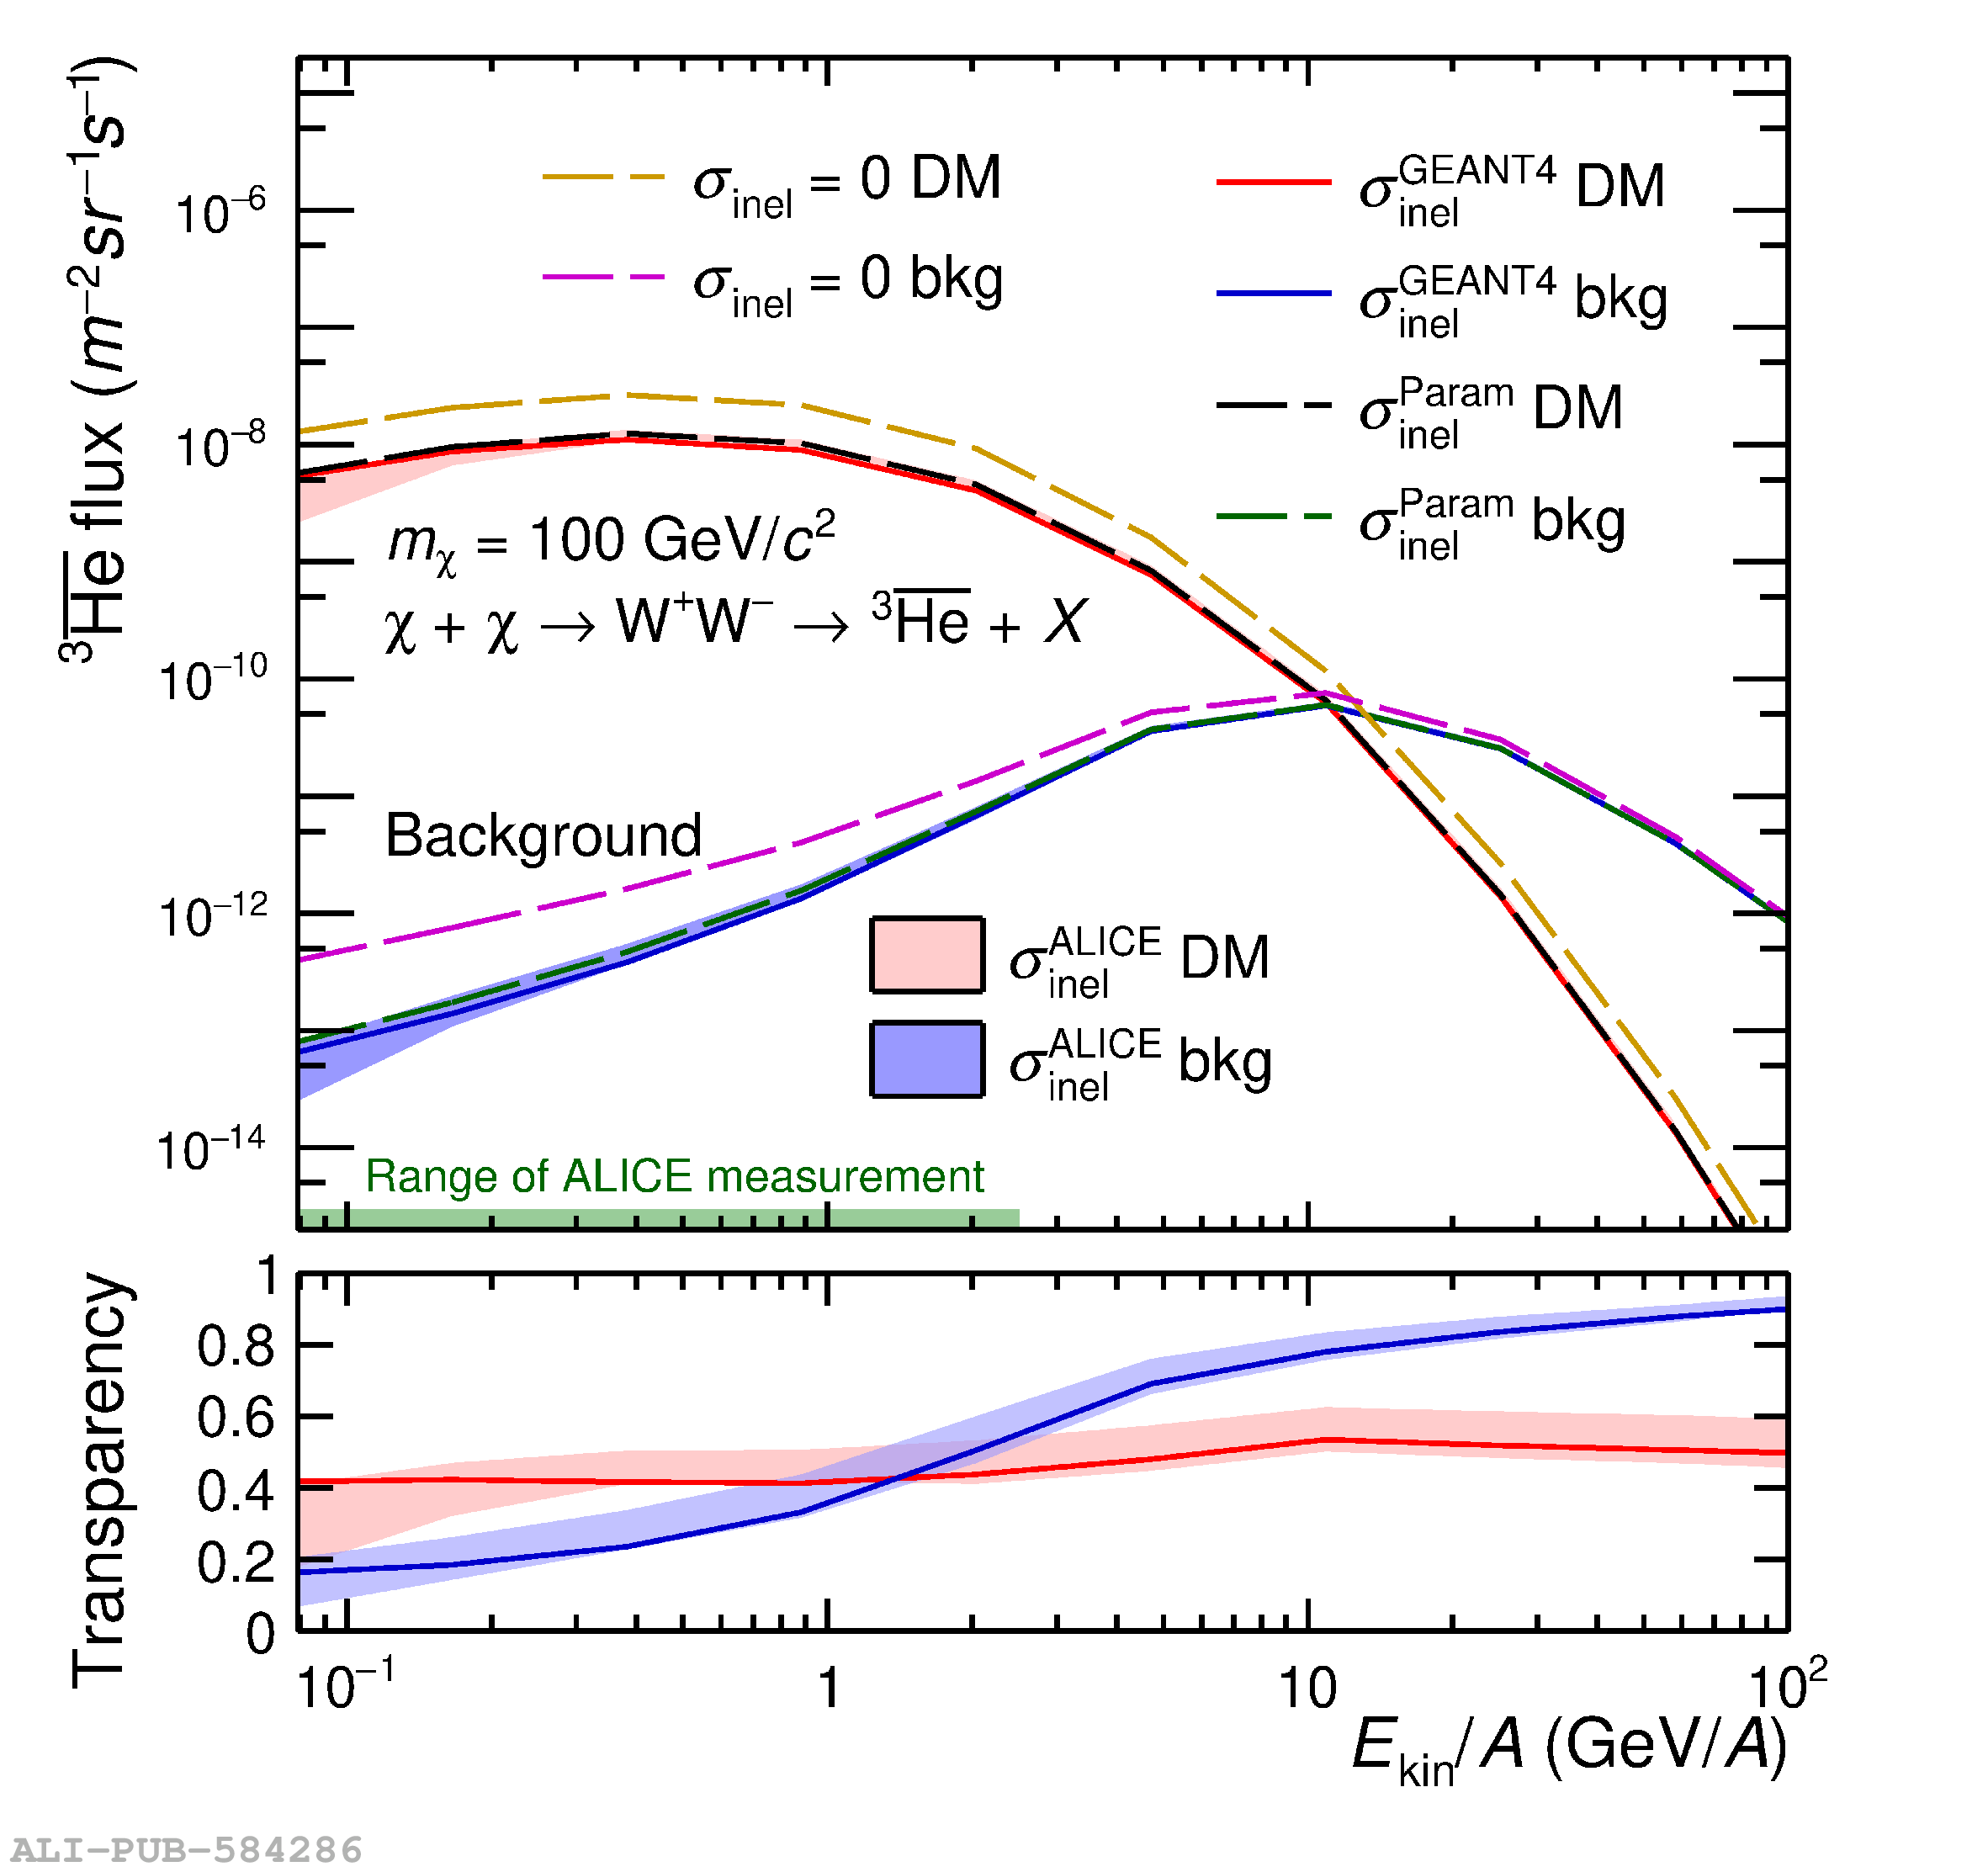
Expected $^{3}\overline{\mathrm{He}}$ cosmic–ray fluxes near Earth before (Left) and after (Right) solar modulation . The latter are obtained using Force Field with modulation potential $f = 400$ MV. Upper panels show the fluxes of antihelium nuclei for signal (dark-matter decay, in red) and background (ordinary cosmic rays, in blue) for various cases of inelastic cross section used in the calculations. Bottom panels show the transparency of our galaxy to the propagation of $^{3}\overline{\mathrm{He}}$. Shaded areas on the top-right panel show expected sensitivity of the GAPS  and AMS-02  experiments.

Figure 121

Number of cosmic-muon events per interval of multiplicity 4 in 30.8 days of data-taking , compared with a model calculation.

Figure 122

Invariant-mass distribution for two-photon production of $\rm e^+e^-$ pairs with the leptons within $|\eta| 0.9$, at $\sqrt{s_{\rm NN}}=2.76$ TeV , compared with the lowest-order QED prediction.

Figure 123

(Left) Invariant mass of \Lambdac candidates using standard (cut-based) and BDT selection techniques in Pb--Pb collisions at $\sqrt{s_{\rm NN}}=5.02$ TeV for an example \pt interval . The upper panel shows the actual counts and the lower panel the residuals after polynomial background subtraction for the two distributions. (Right) $\delta p_{\text{T}}$ distribution for charged jets with $R = 0.4$ in Pb--Pb collisions at 5.02 TeV. Comparison of ML-based and area-based correction.