The temperature dependence of the spatial charm diffusion coefficient $D_{\rm s}$ in the QGP phase constrained by the ALICE measurements shown in Sec. \ref{sec:PartonInteractions} from various transport models described in the text. The range on the right of the plot represents a 90\% posterior interval from the Bayesian analysis at $T=0.4$ GeV. Limits from pQCD , and AdS/CFT , are also shown. | 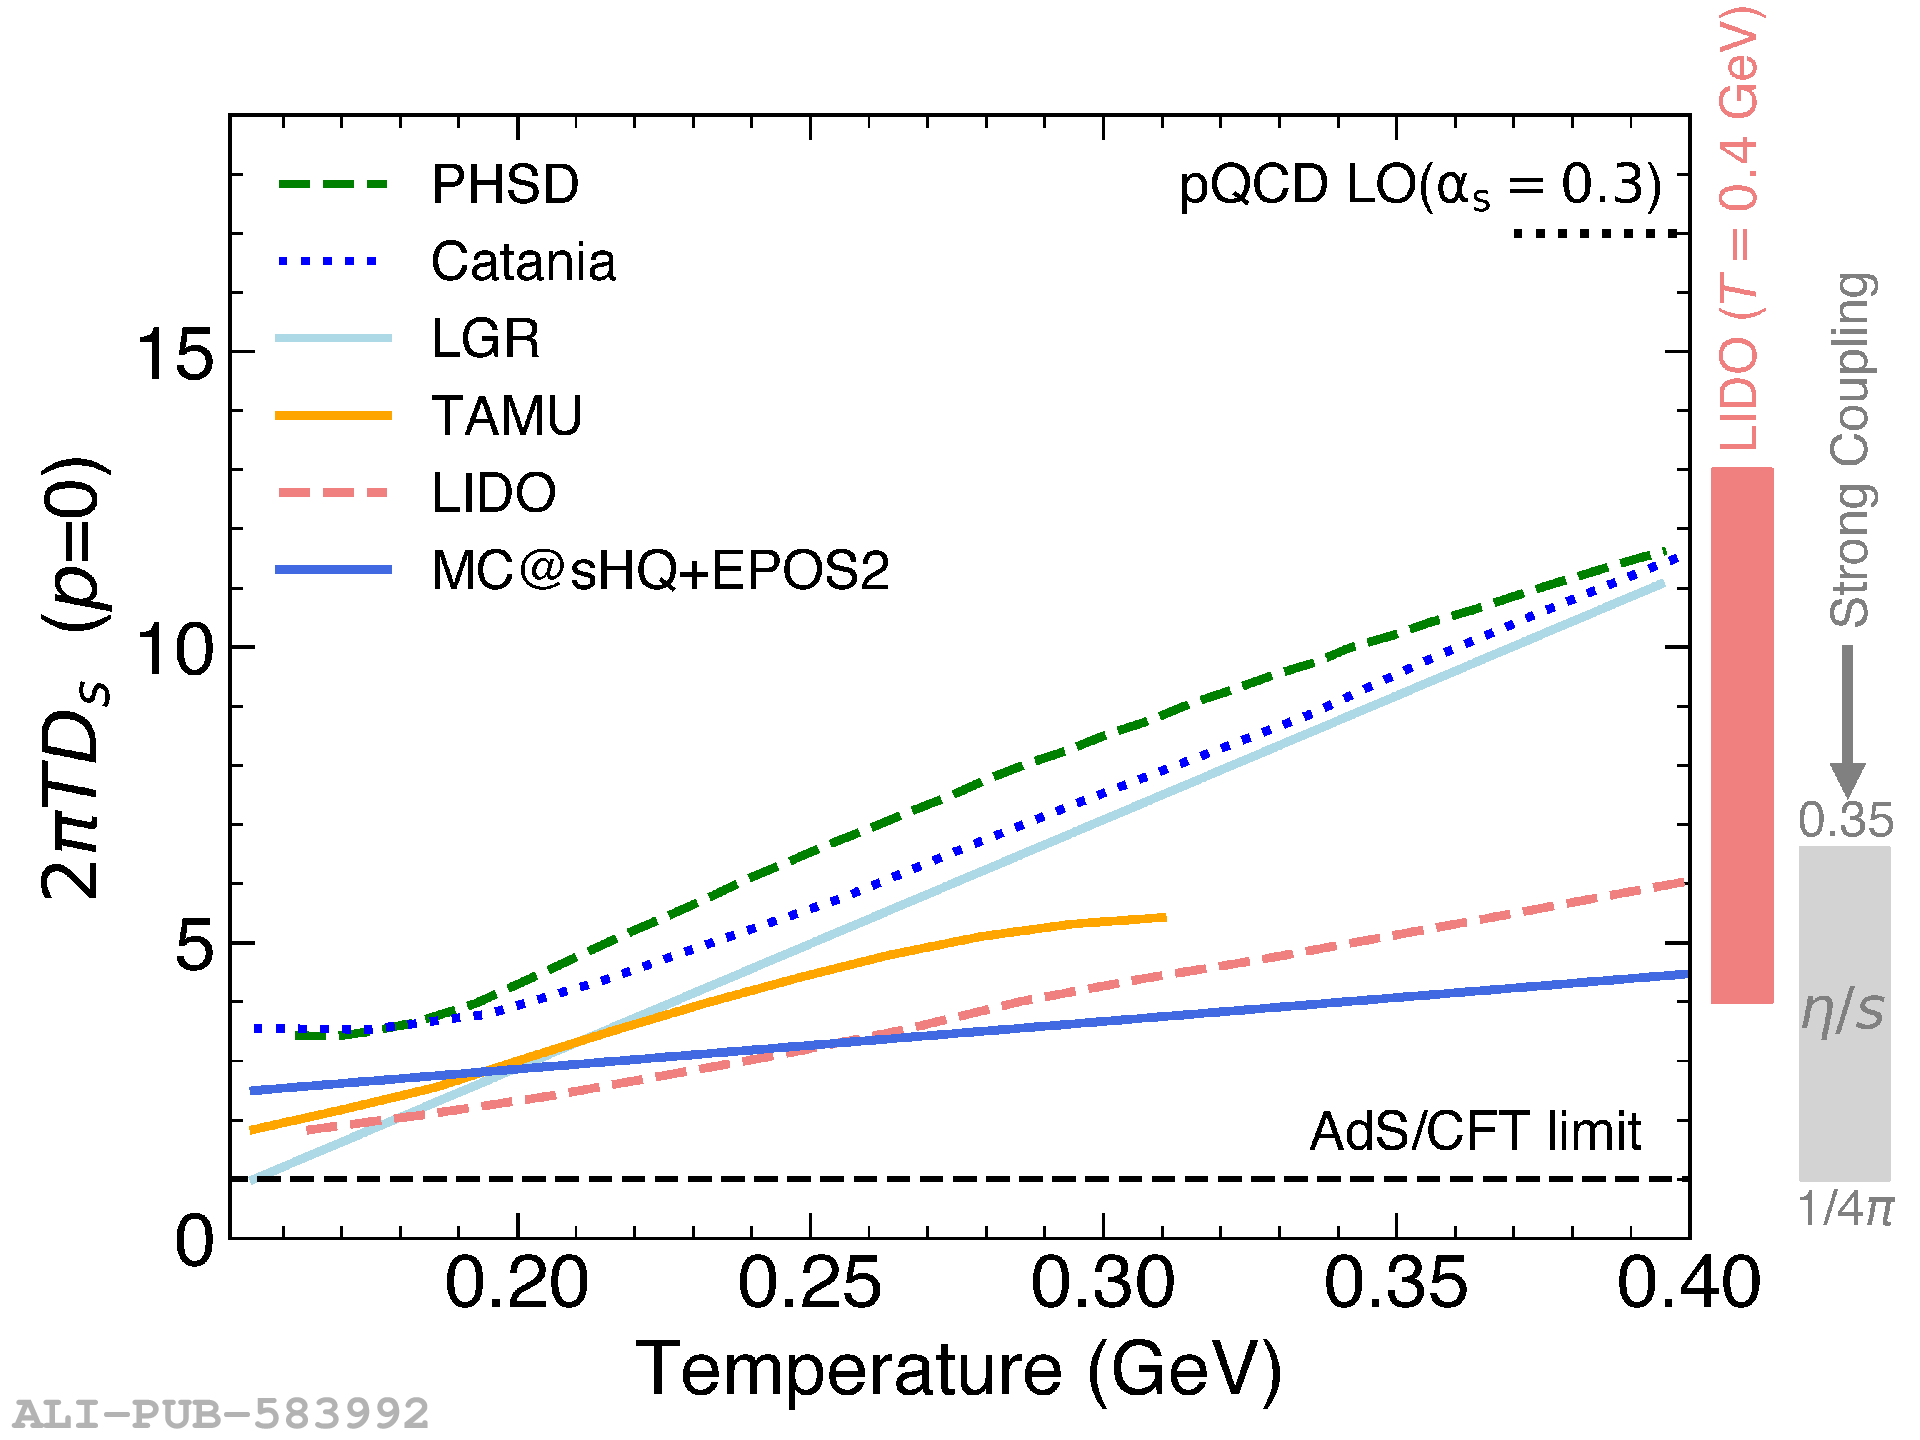 |