Three-body nuclear forces play an important role in the structure of nuclei and hypernuclei and are also incorporated in models to describe the dynamics of dense baryonic matter, such as in neutron stars. So far, only indirect measurements anchored to the binding energies of nuclei can be used to constrain the three-nucleon force, and if hyperons are considered, the scarce data on hypernuclei impose only weak constraints on the three-body forces. In this work, we present the first direct measurement of the p$-$p$-$p and p$-$p$-\Lambda$ systems in terms of three-particle correlation functions carried out for pp collisions at $\sqrt{s} = 13$ TeV. Three-particle cumulants are extracted from the correlation functions by applying the Kubo formalism, where the three-particle interaction contribution to these correlations can be isolated after subtracting the known two-body interaction terms. A negative cumulant is found for the p$-$p$-$p system, hinting to the presence of a residual three-body effect while for p$-$p$-\Lambda$ the cumulant is consistent with zero. This measurement demonstrates the accessibility of three-baryon correlations at the LHC.
Eur. Phys. J. A 59 (2023) 145
HEP Data
e-Print: arXiv:2206.03344 | PDF | inSPIRE
CERN-EP-2022-110
Figure group
Figure 1
The upper panels show the comparison of the two-particle correlations projected on three-particle phase space obtained using the data-driven approach based on event mixing (green points) and the projector method (grey band). The resulting correlation functions are shown for (p$-$p)$-$p (panel a), (p$-$p)$-\Lambda$ (panel b) and p$-$(p$-\Lambda$) (panel c) cases. The error bars and the boxes represent the statistical and systematic uncertainties, respectively. The grey band includes systematic and statistical uncertainties summed in quadrature. The lower panels show the deviations between the data-driven approach and the projector method, expressed in terms of $n_\sigma$. | 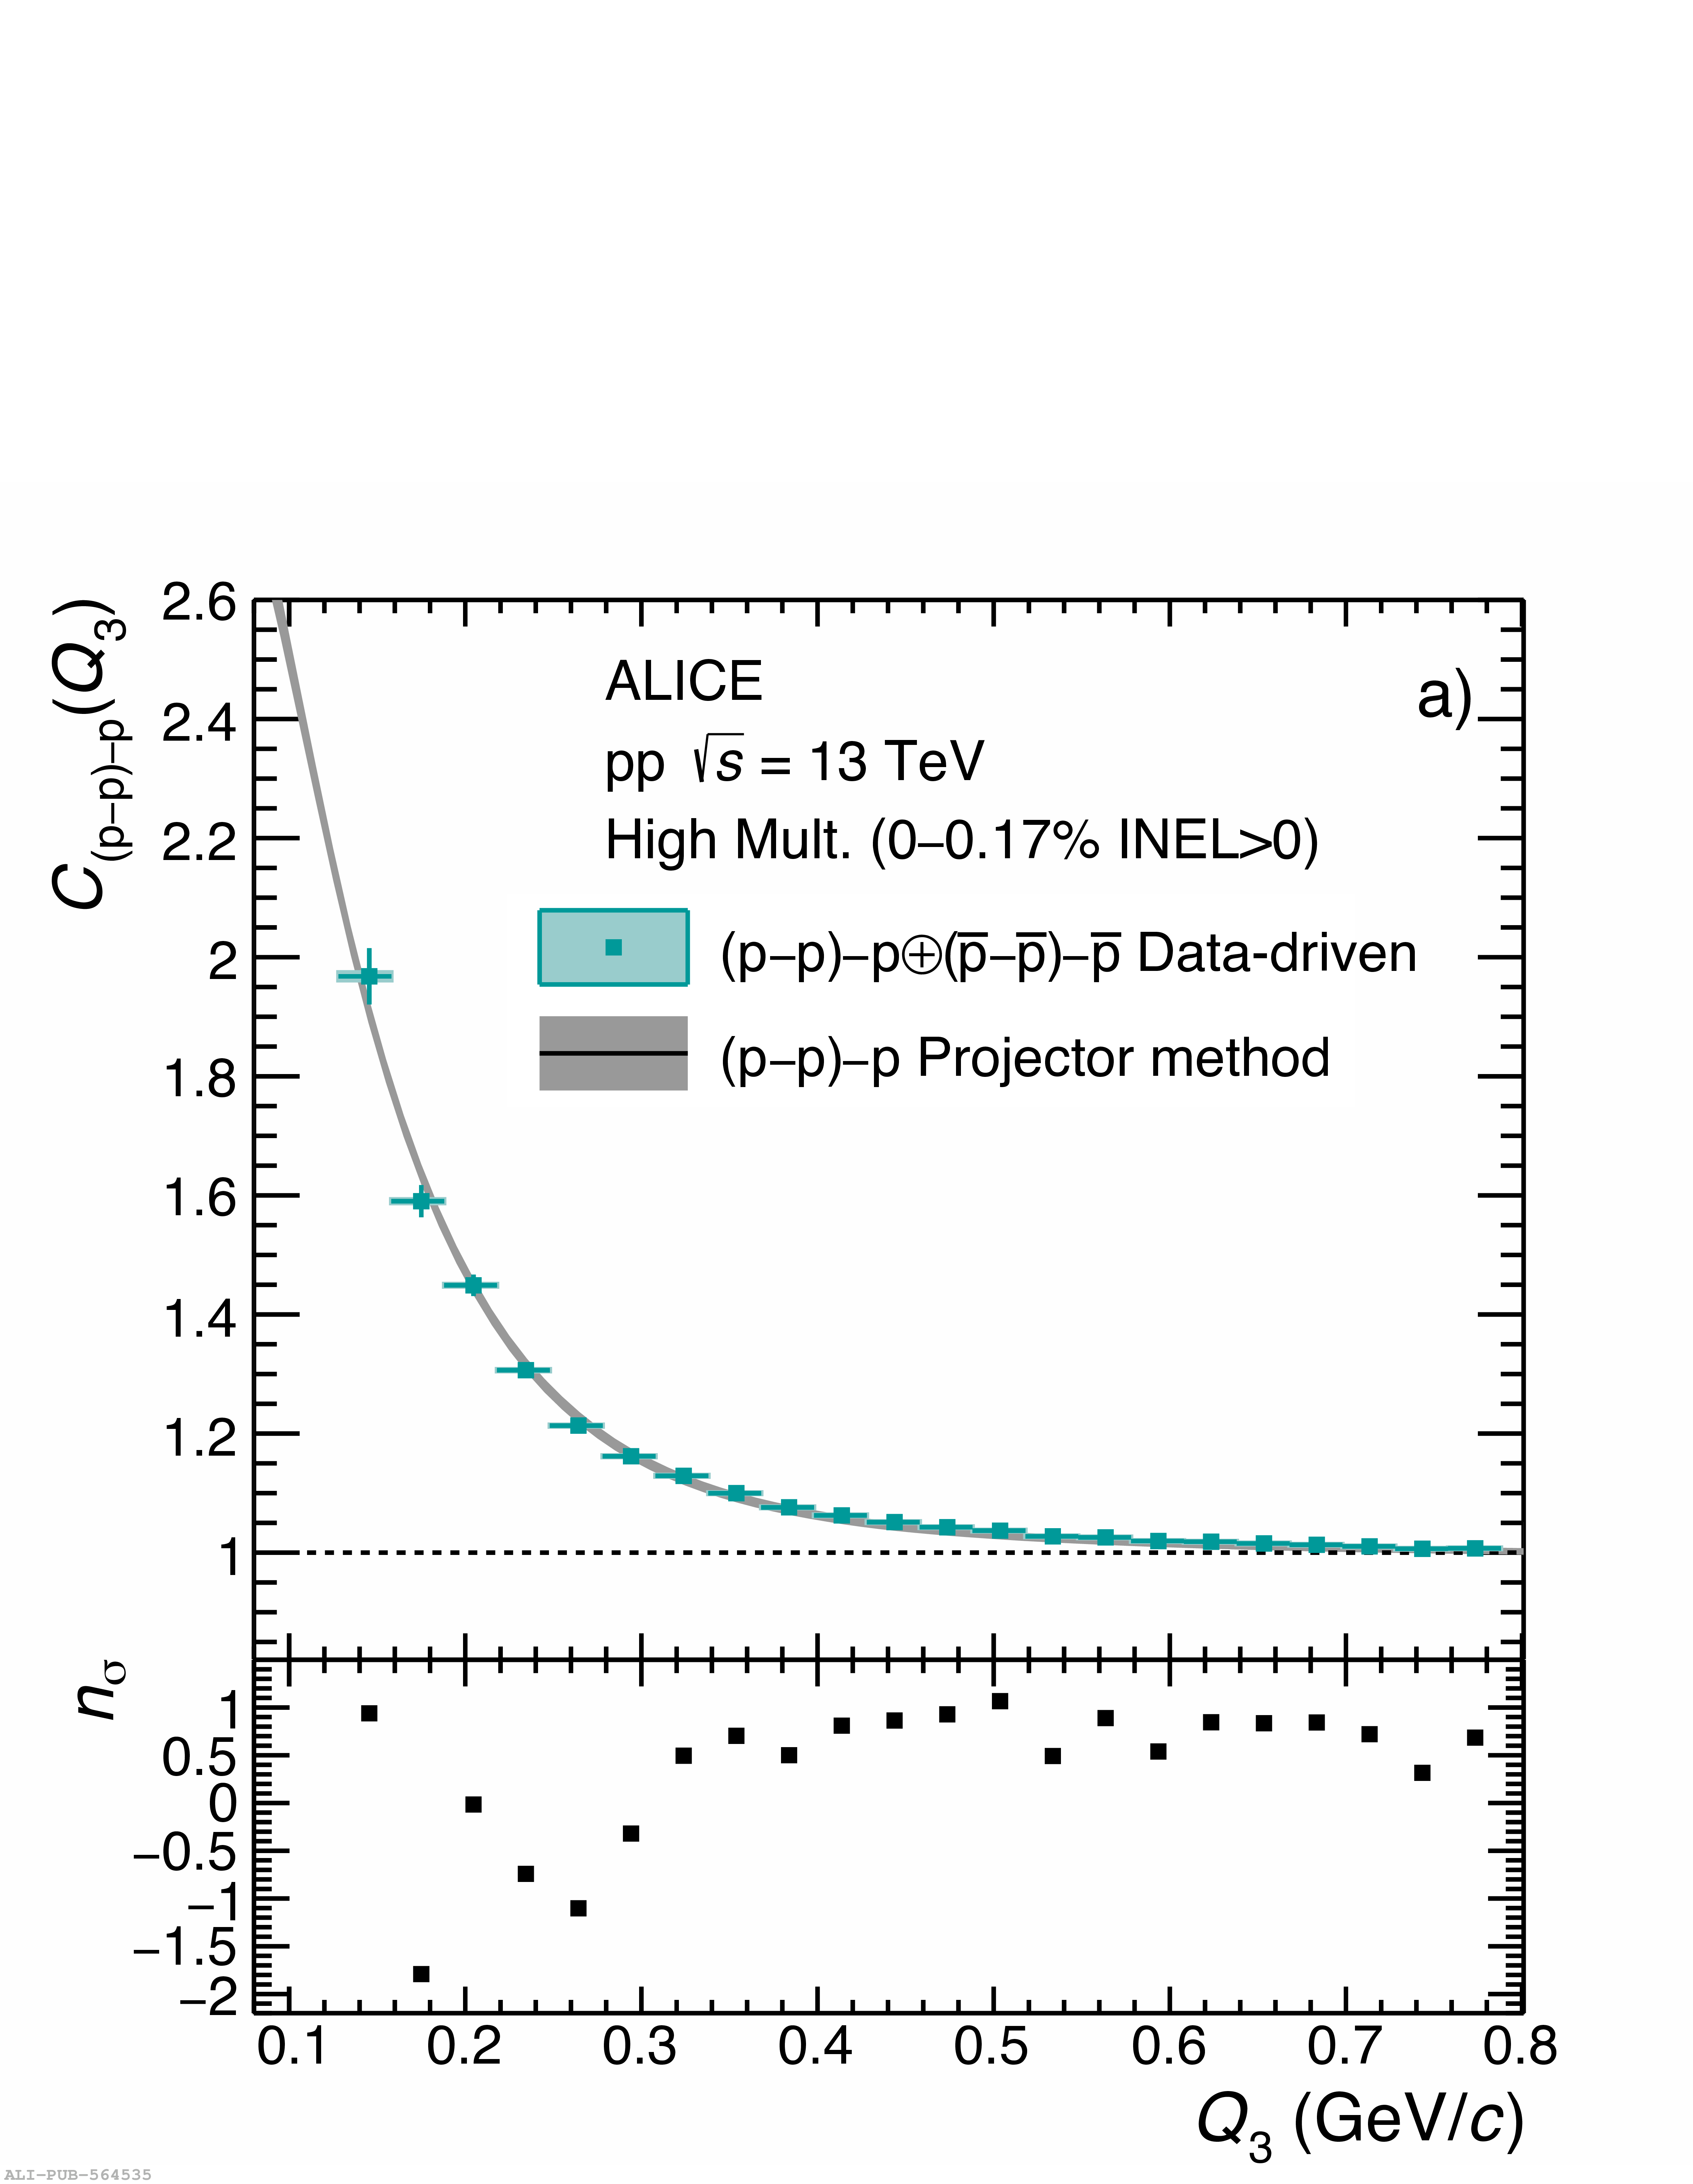 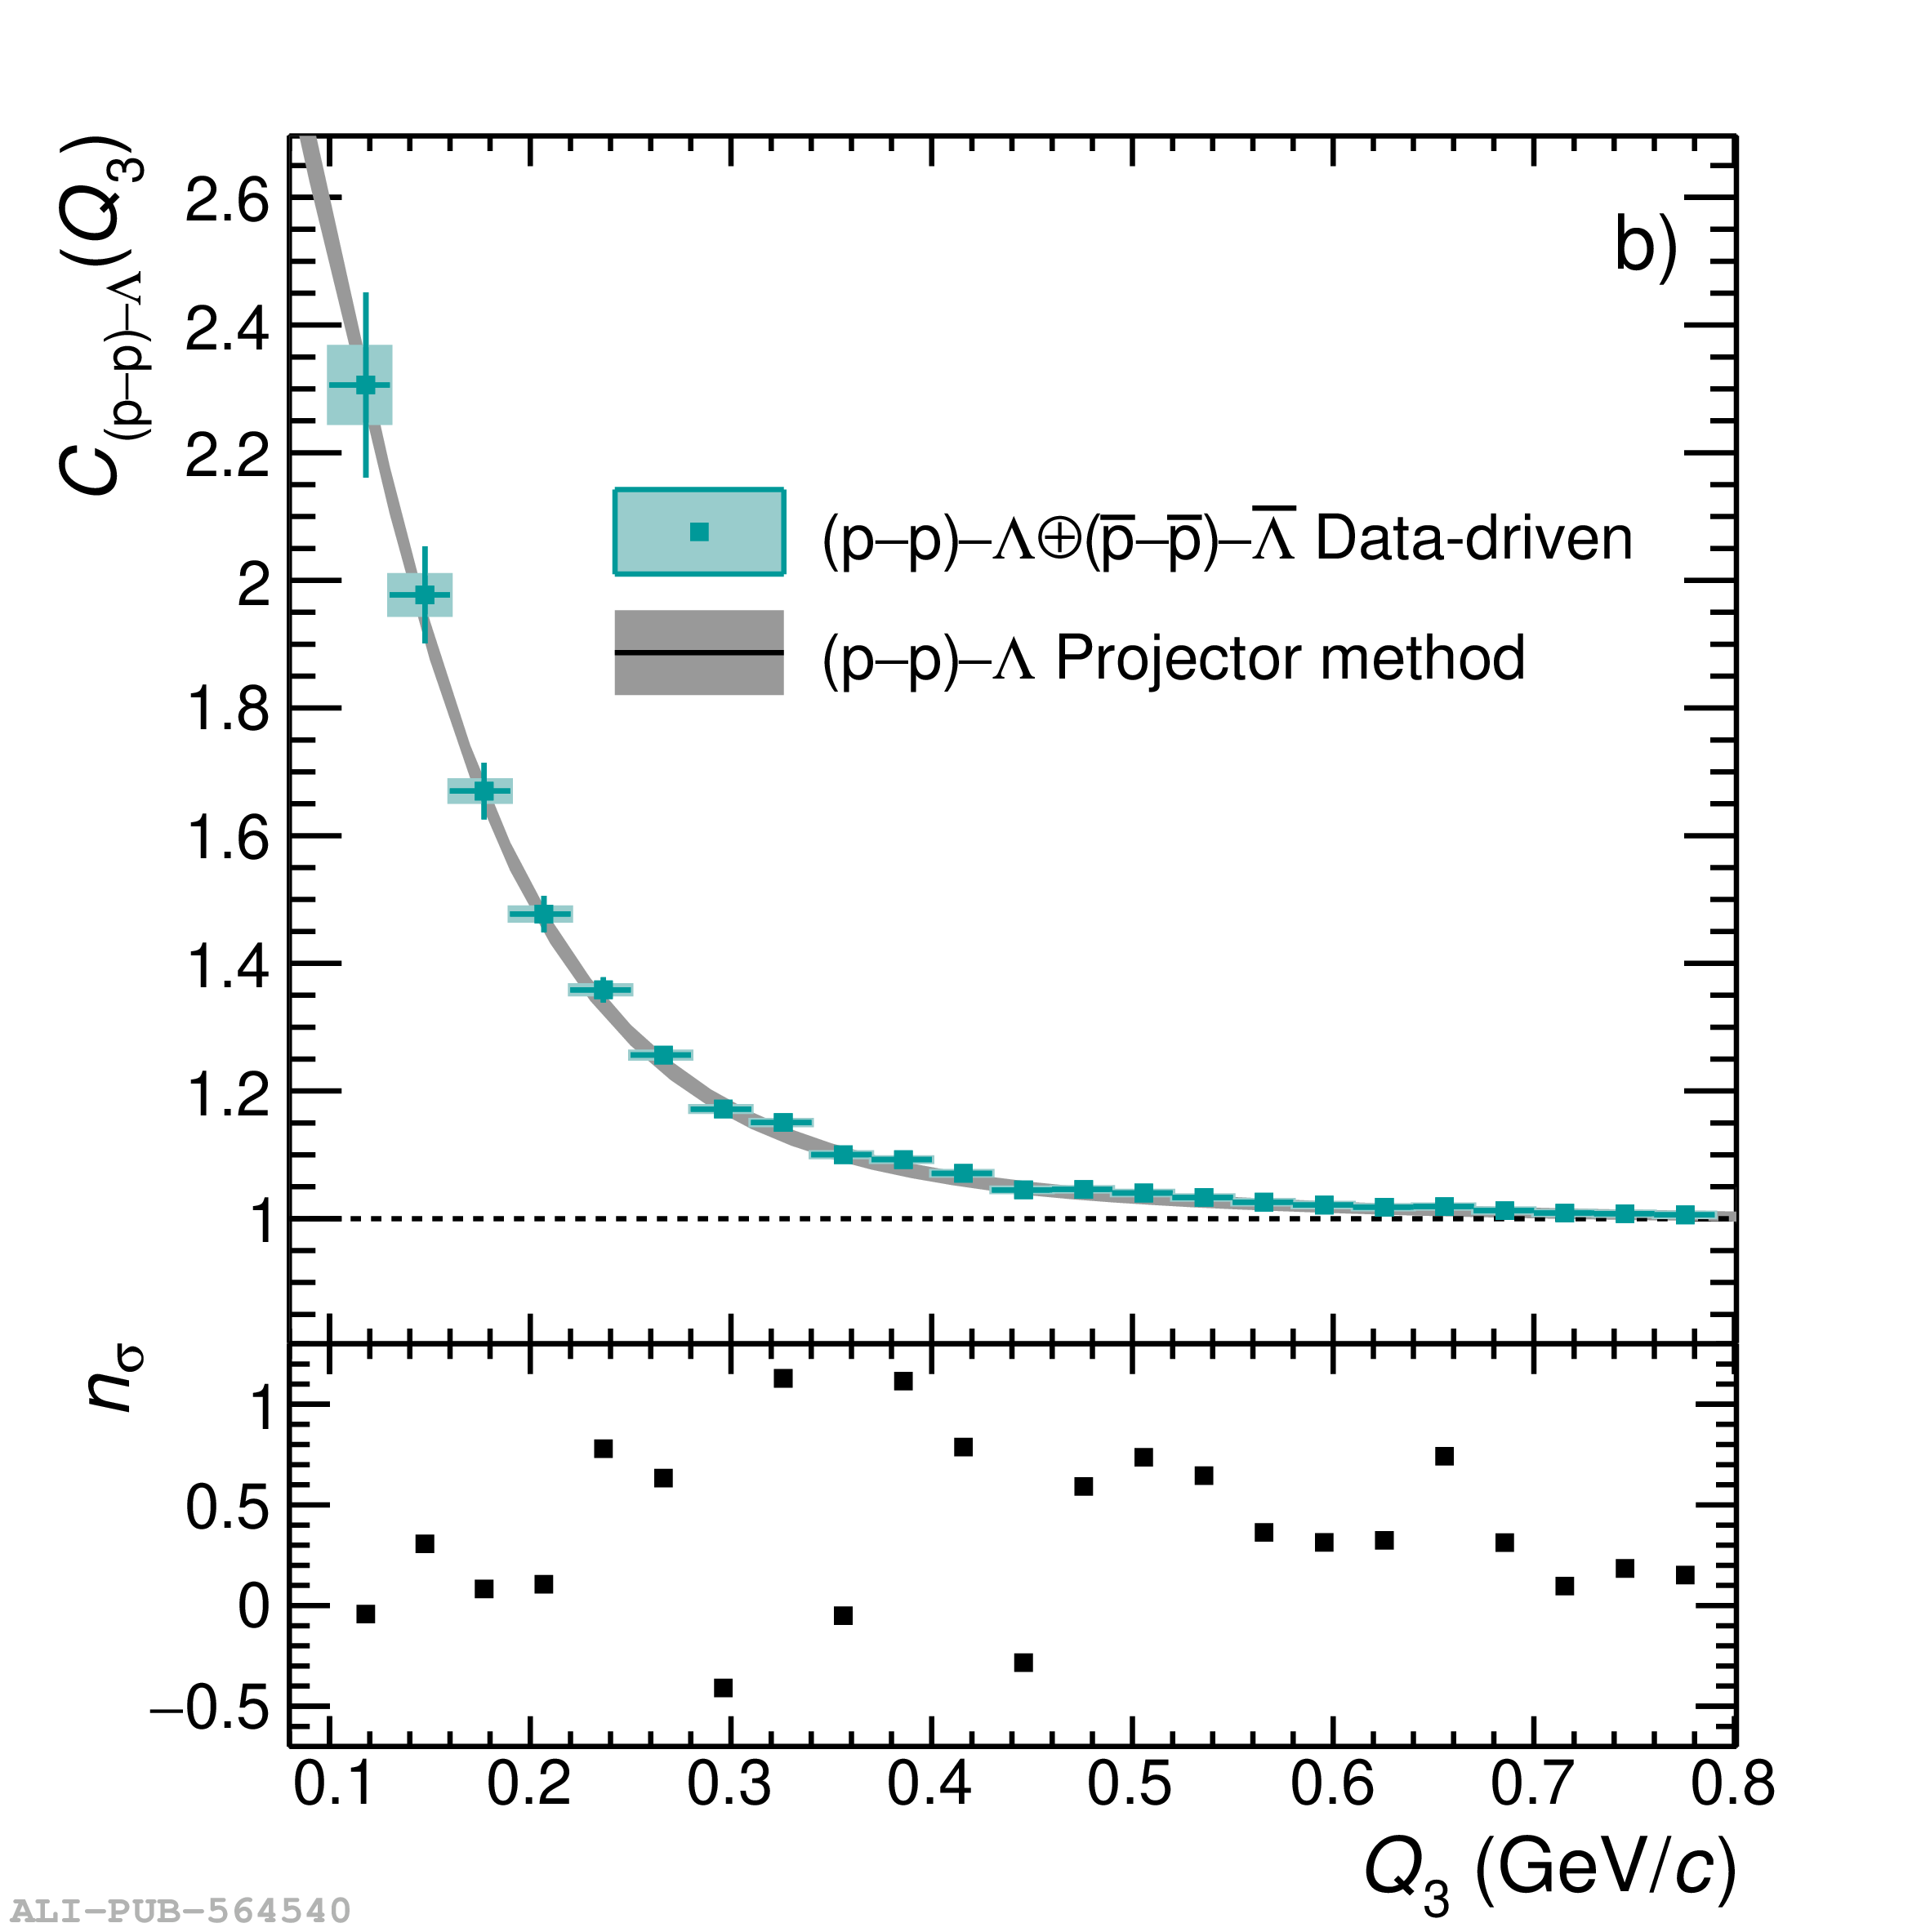 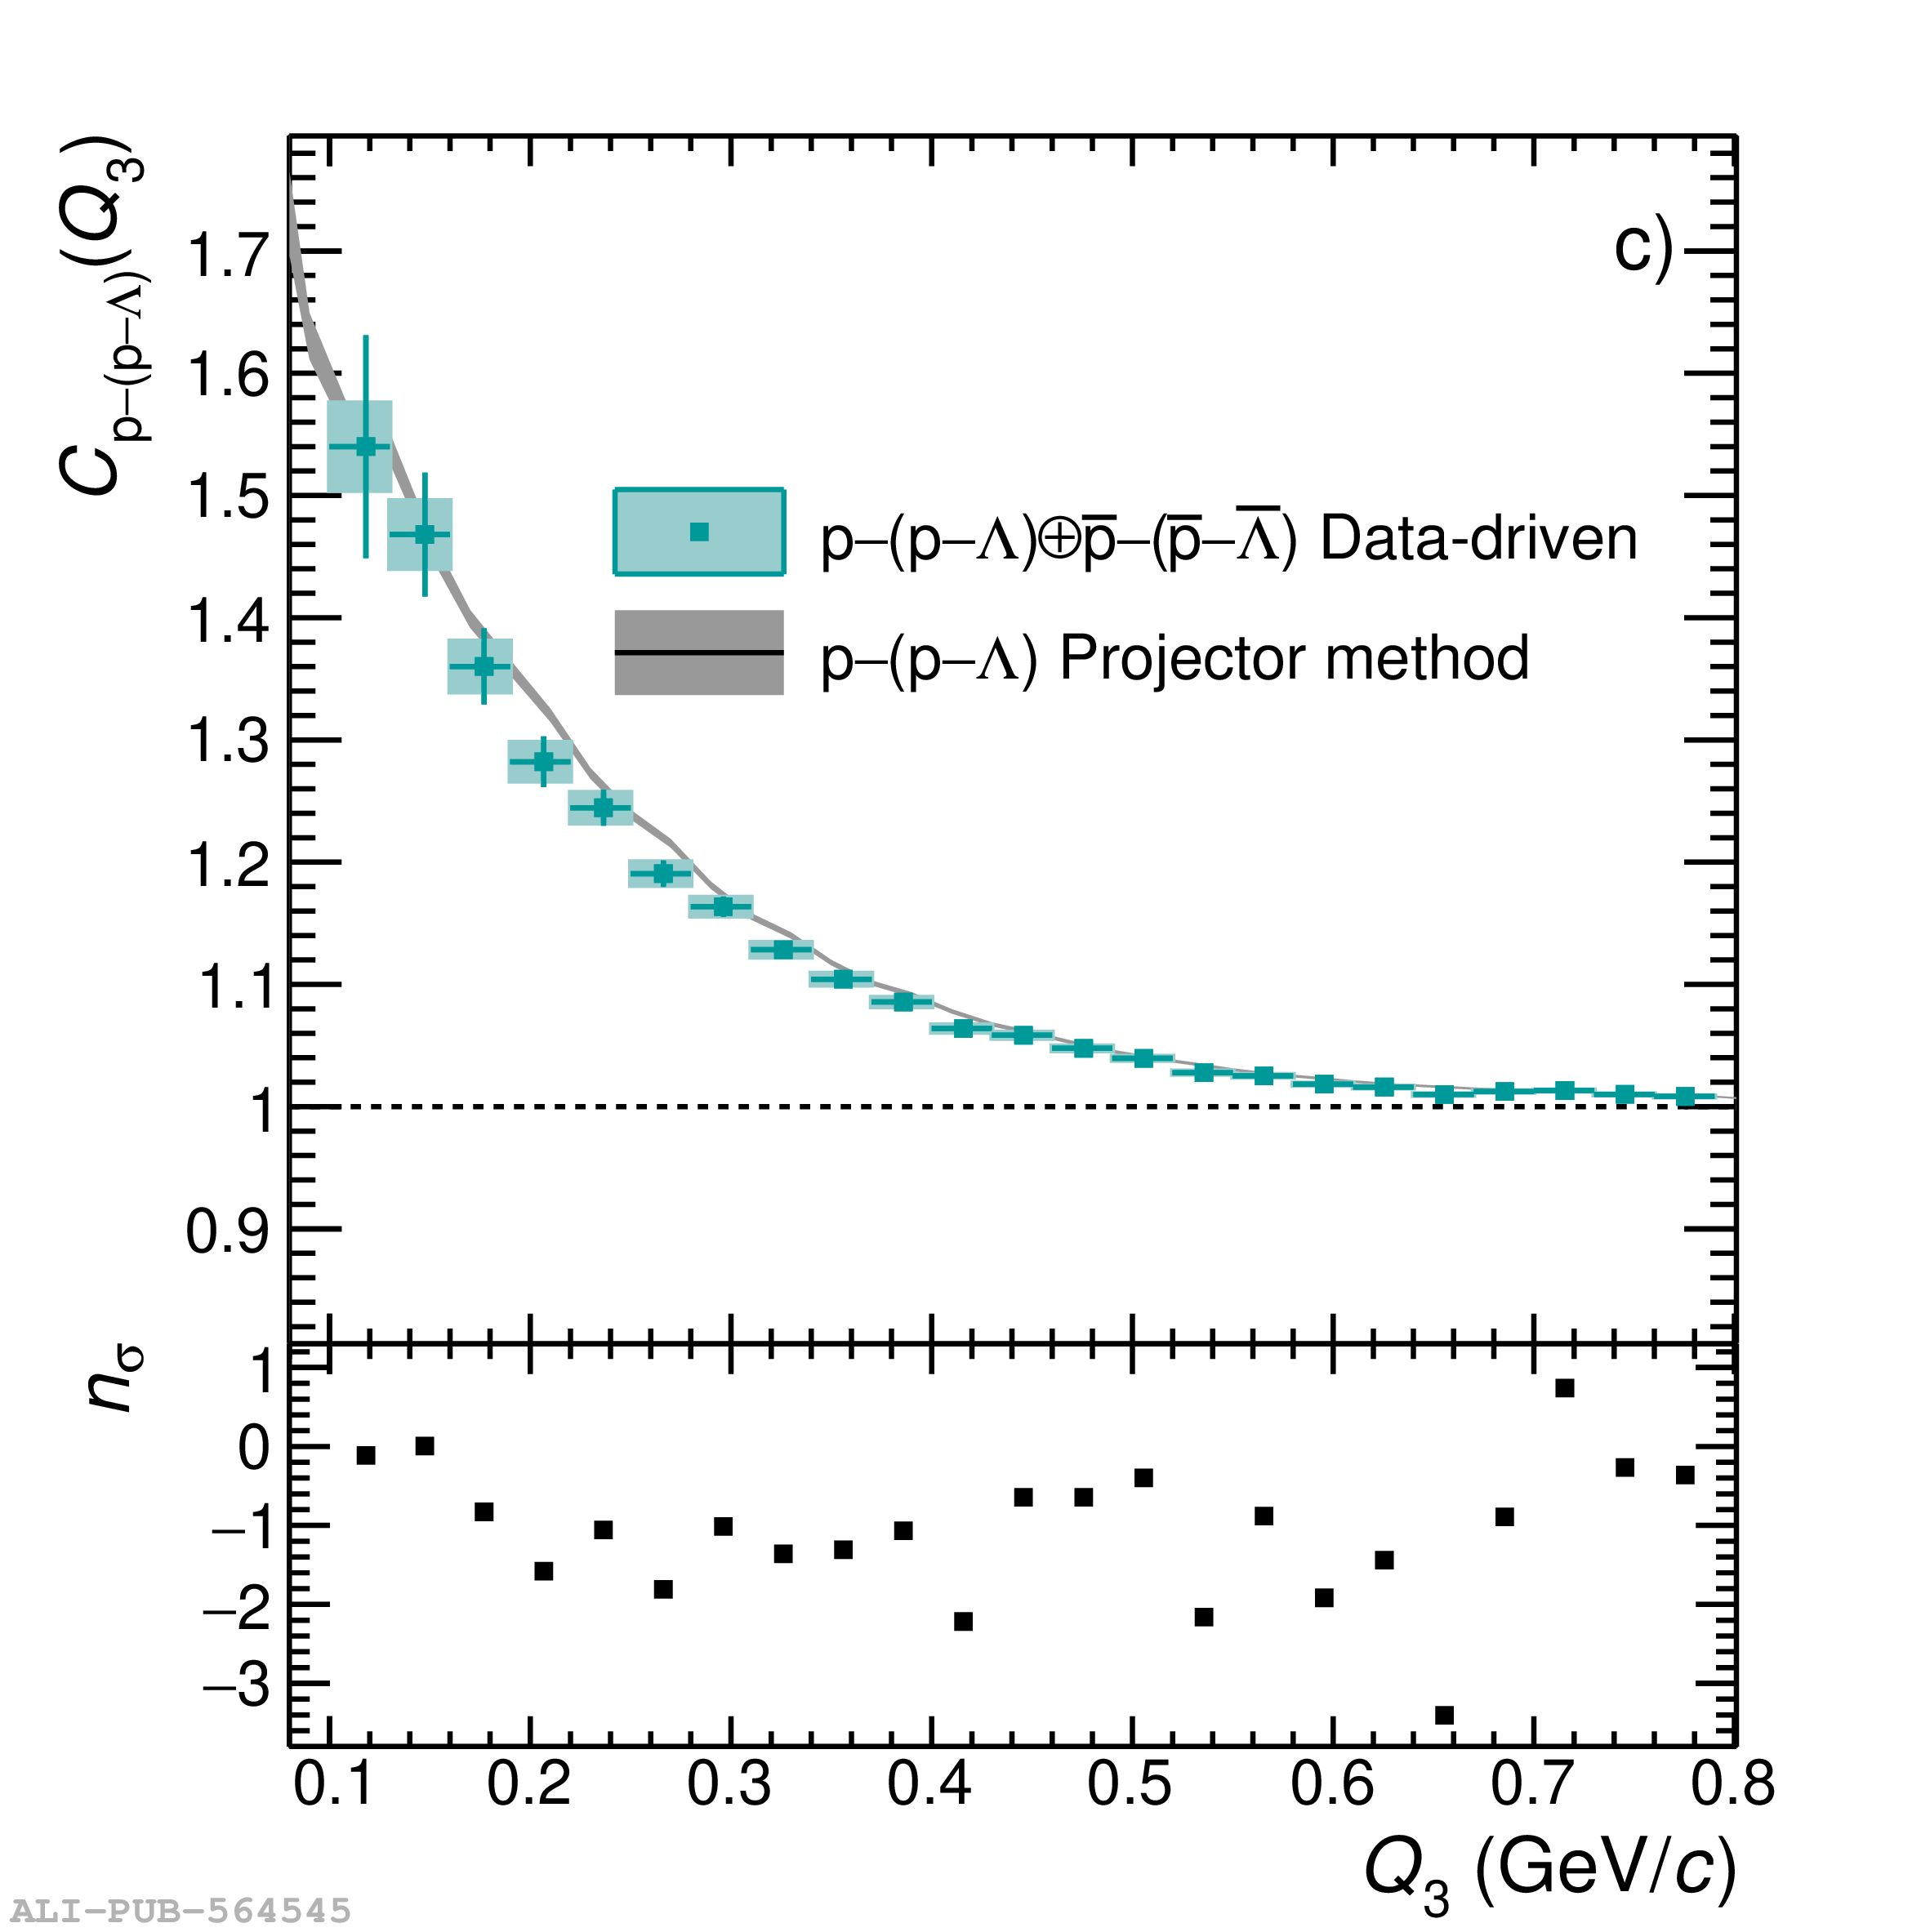 |
Figure 2
Comparison of the total two-particle contribution to the three-particle correlation functions obtained using the data-driven approach (green points) and the projector method (grey band). The resulting correlation functions are shown for p$-$p$-$p (left panel) and p$-$p$-\Lambda$ (right panel). The error bars and the boxes represent the statistical and systematic uncertainties, respectively. The grey band includes systematic and statistical uncertainties summed in quadrature. | 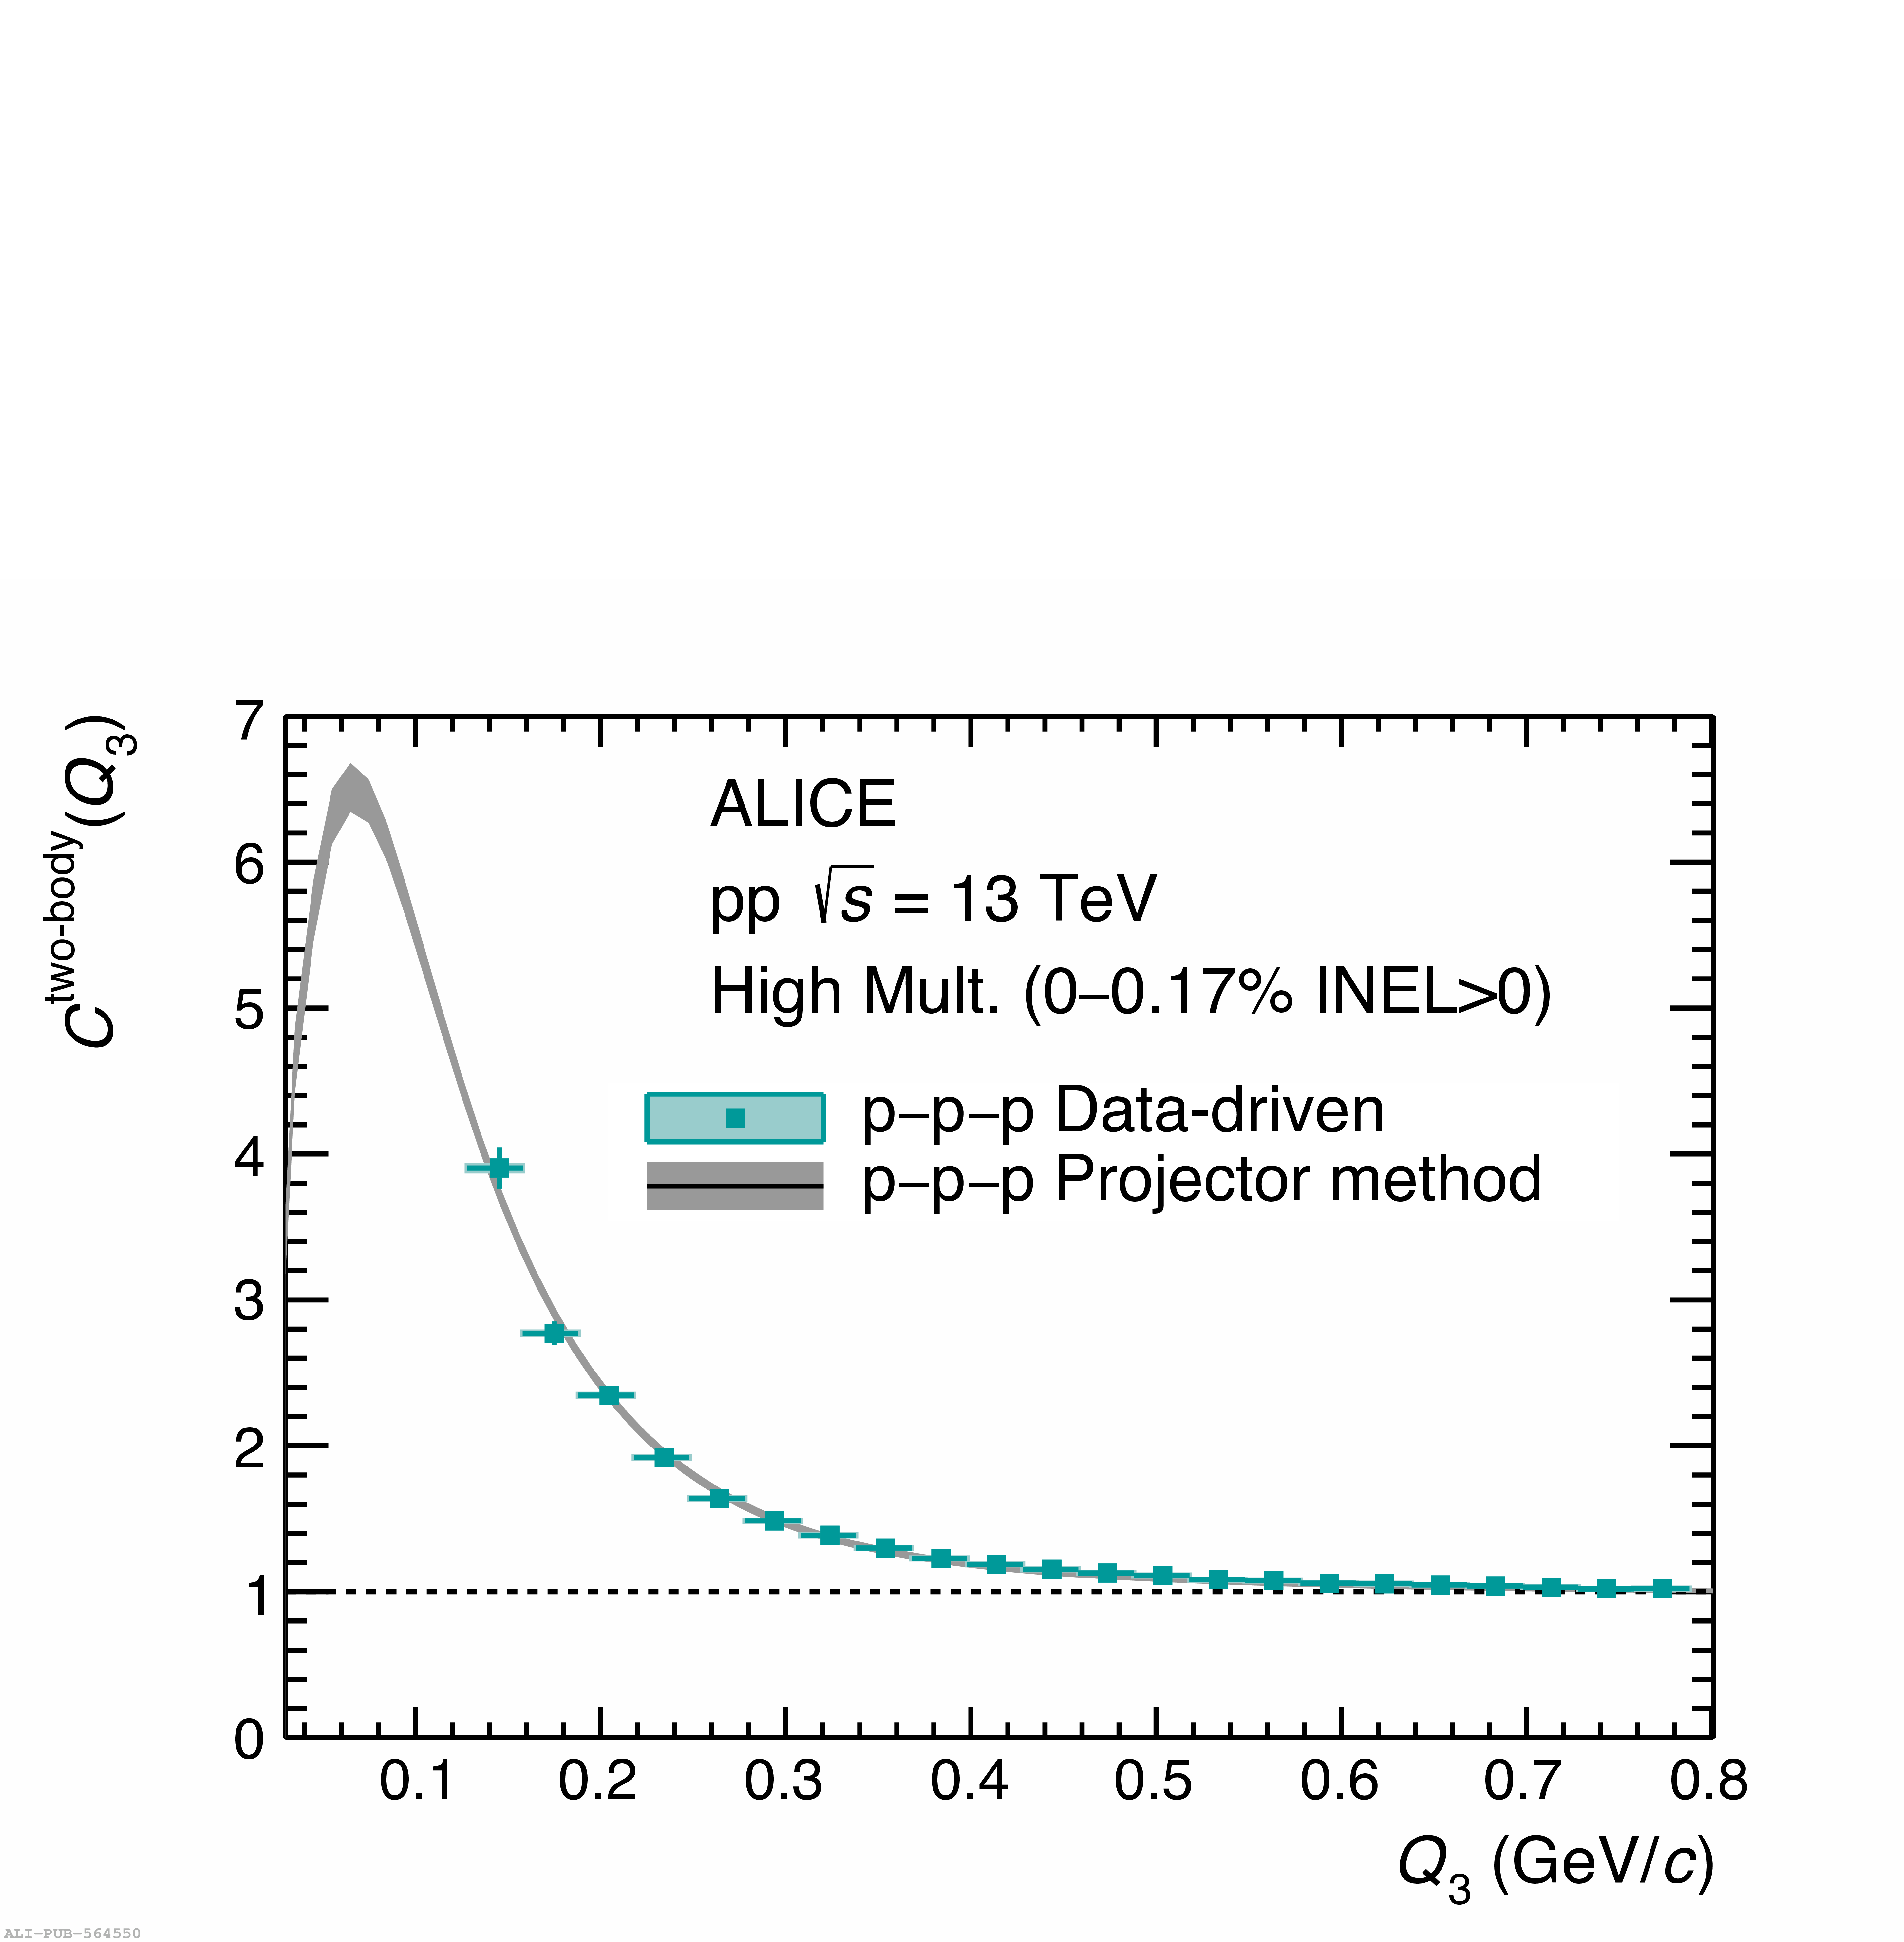 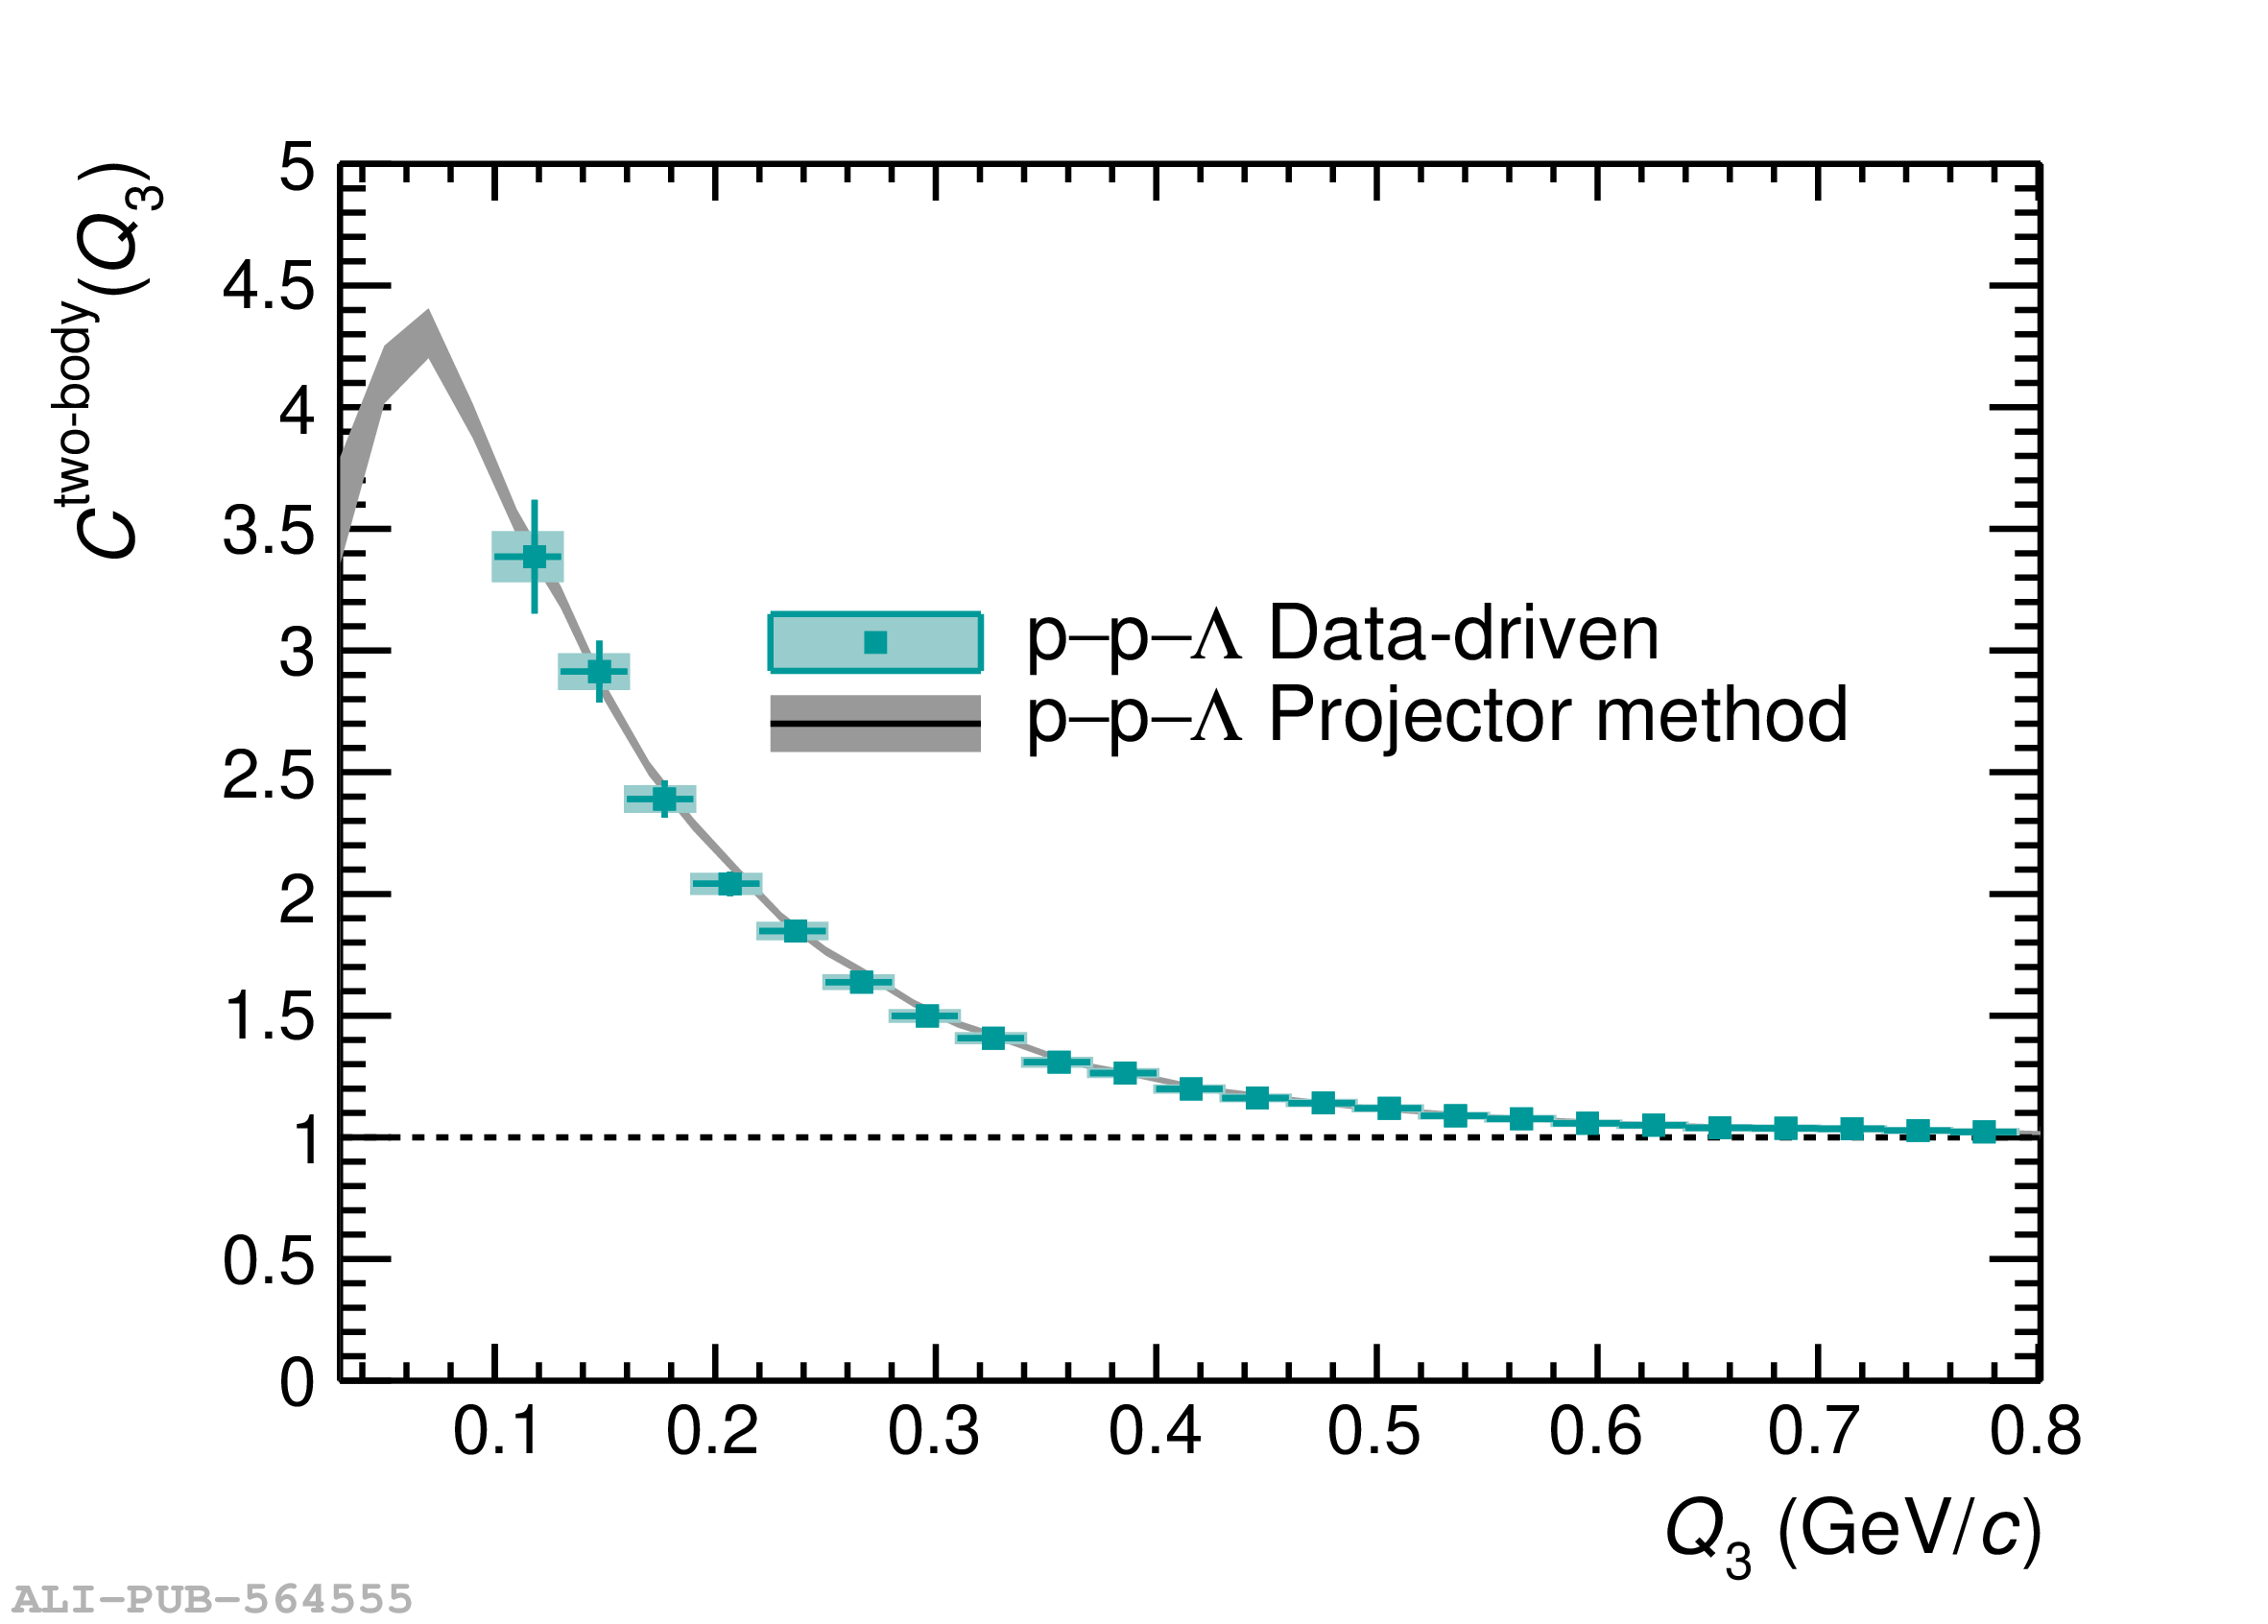 |
Figure 3
Measured p$-$p$-$p (left panel) and p$-$p$-\Lambda$ (right panel) three-particle correlation functions. The green points show the experimental results, the error bars and the boxes represent the statistical and systematic uncertainties, respectively. The grey bands represent the expectations for the lower-order two-particle correlations obtained using the projector method and the band width is obtained including systematic and statistical uncertainties summed in quadrature. | 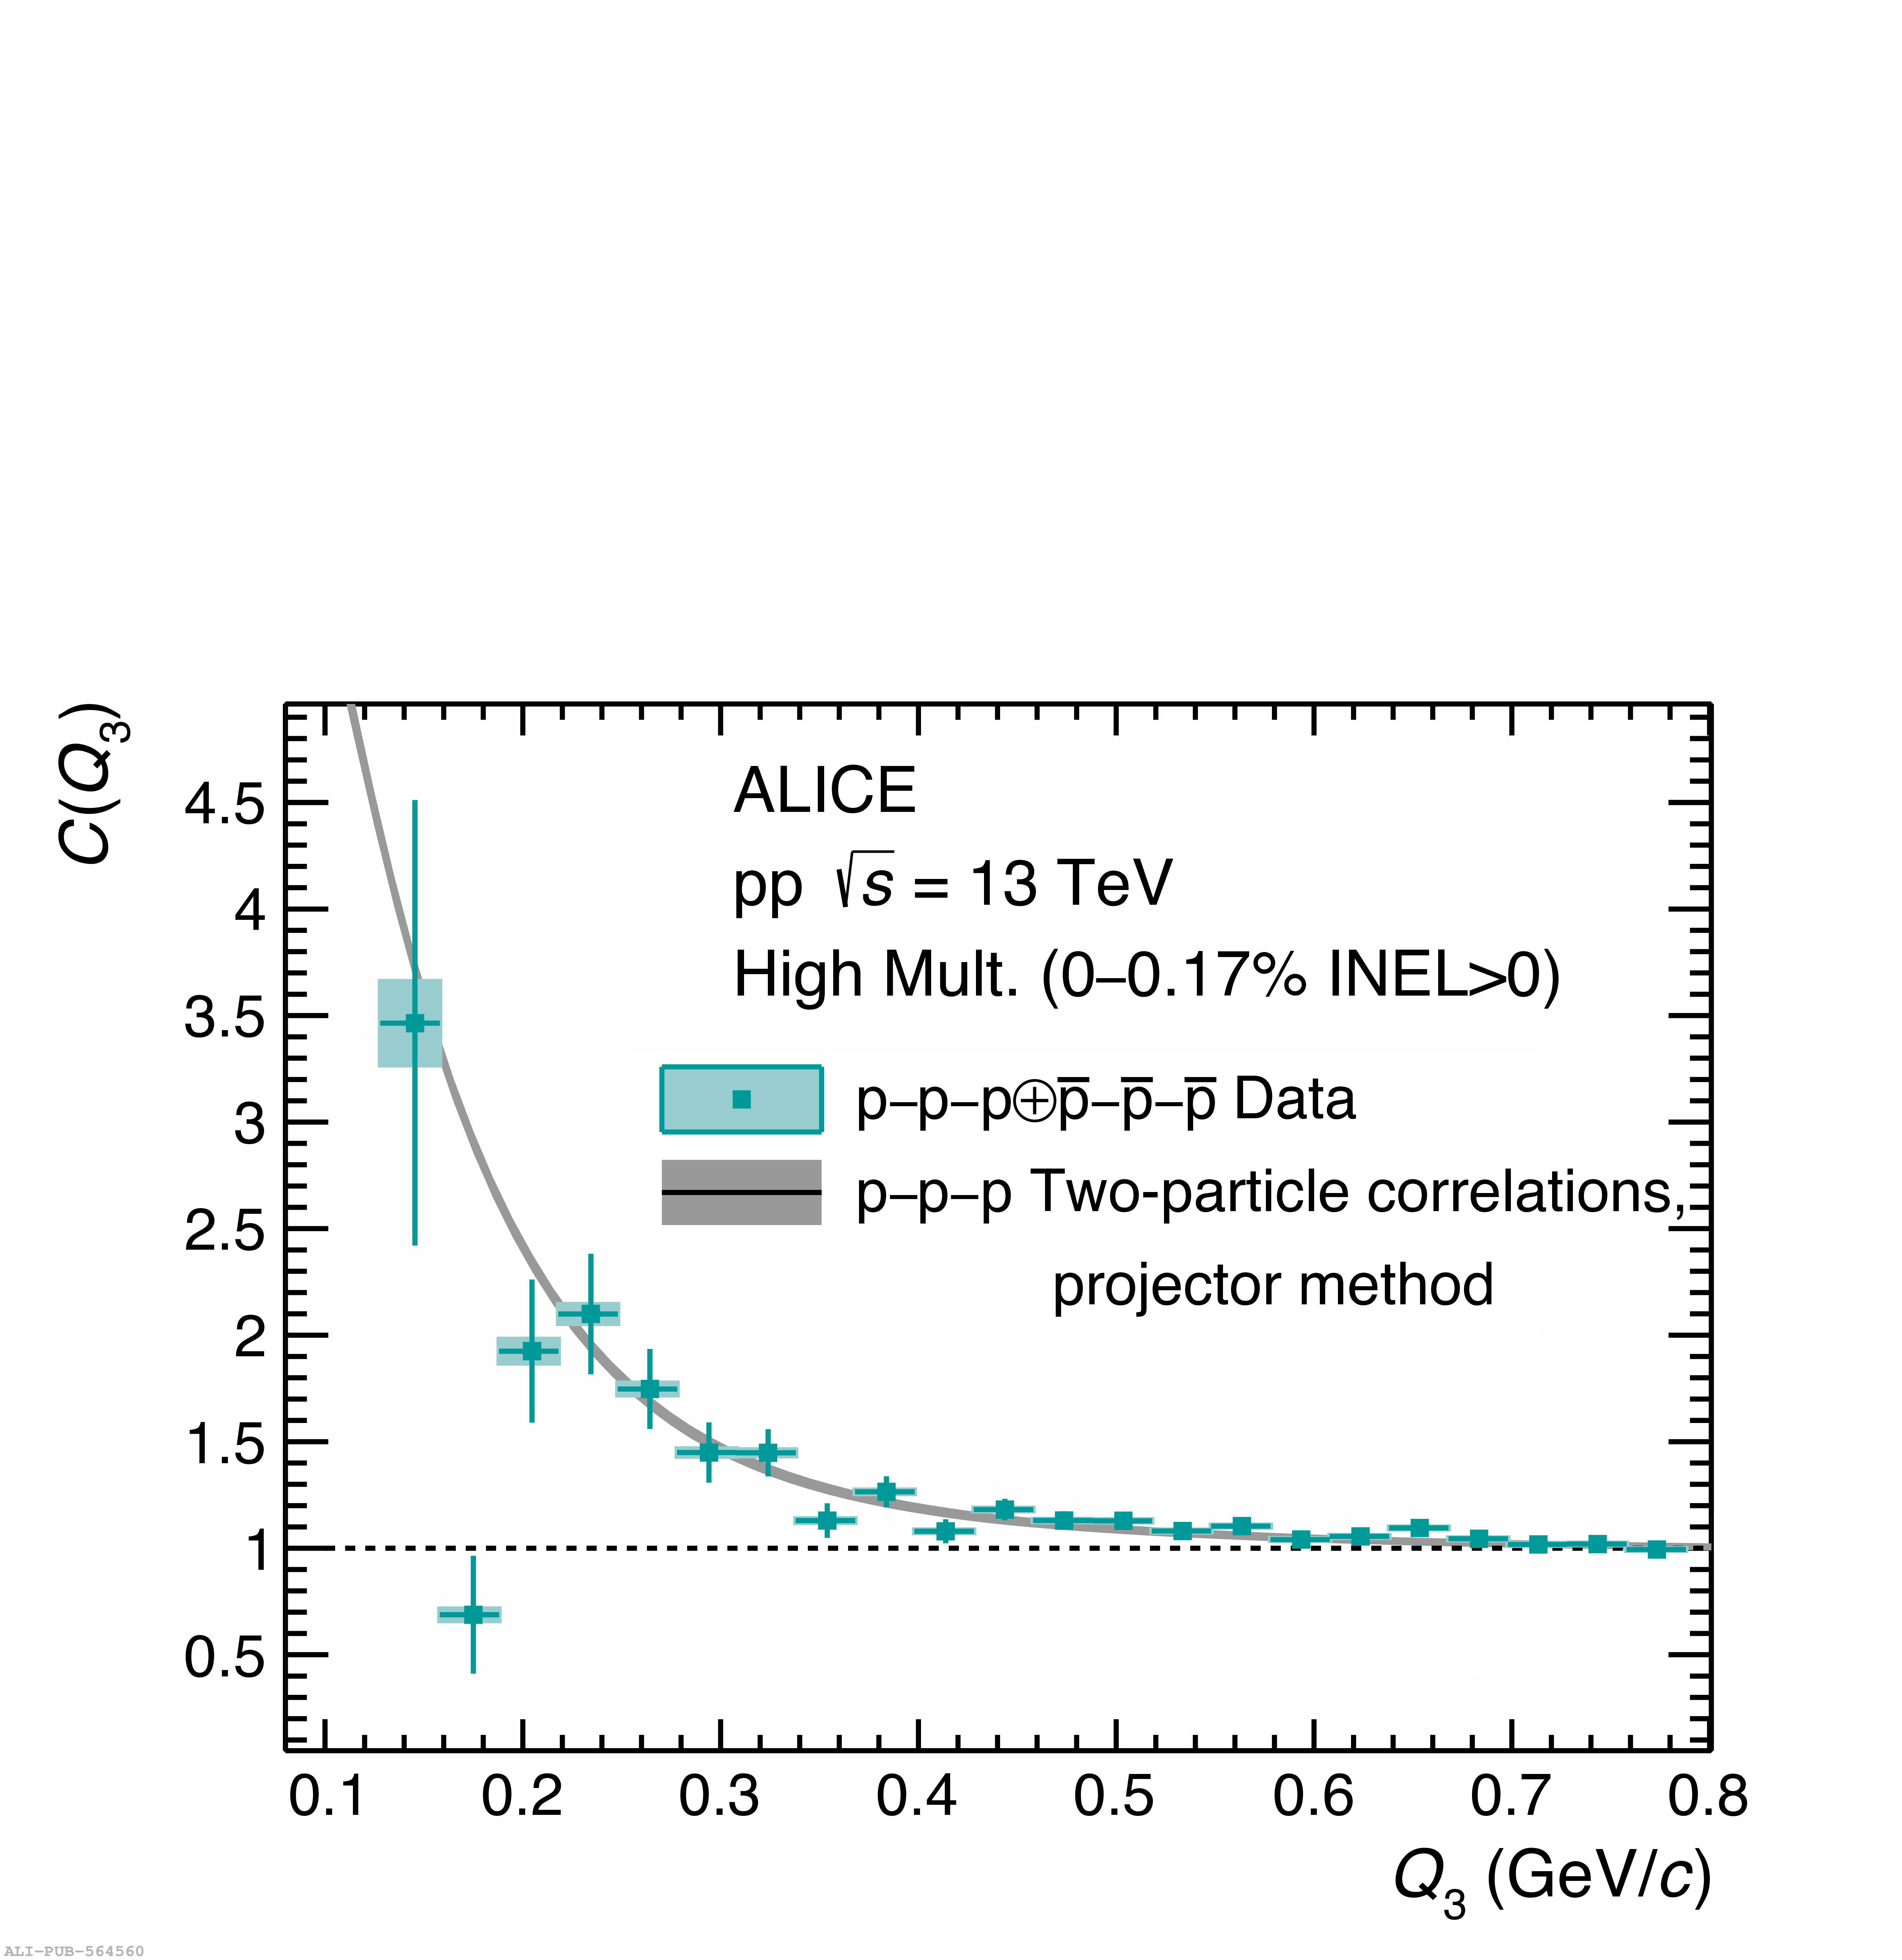  |
Figure 4
Three-particle cumulants for p$-$p$-$p (left panel, blue square symbols) and p$-$p$-\Lambda$ (right panel) triplets obtained by subtracting the lower-order contributions from the measured three-particle correlation functions shown in Fig. 3. The p$-$p$-$p cumulant in the left panel is further corrected for the feed-down contributions from decaying particles and represents thus, the cumulant for the correctly identified primary protons (see Section 2.5 for details). The dashed lines correspond to the assumption that there are no genuine three-body correlations ${c}_3 (Q_3) = 0$. The red open circles in left panel represent the cumulant for p$-$p$-\overline{\rm p}$ triplets (for more details see the main text). | 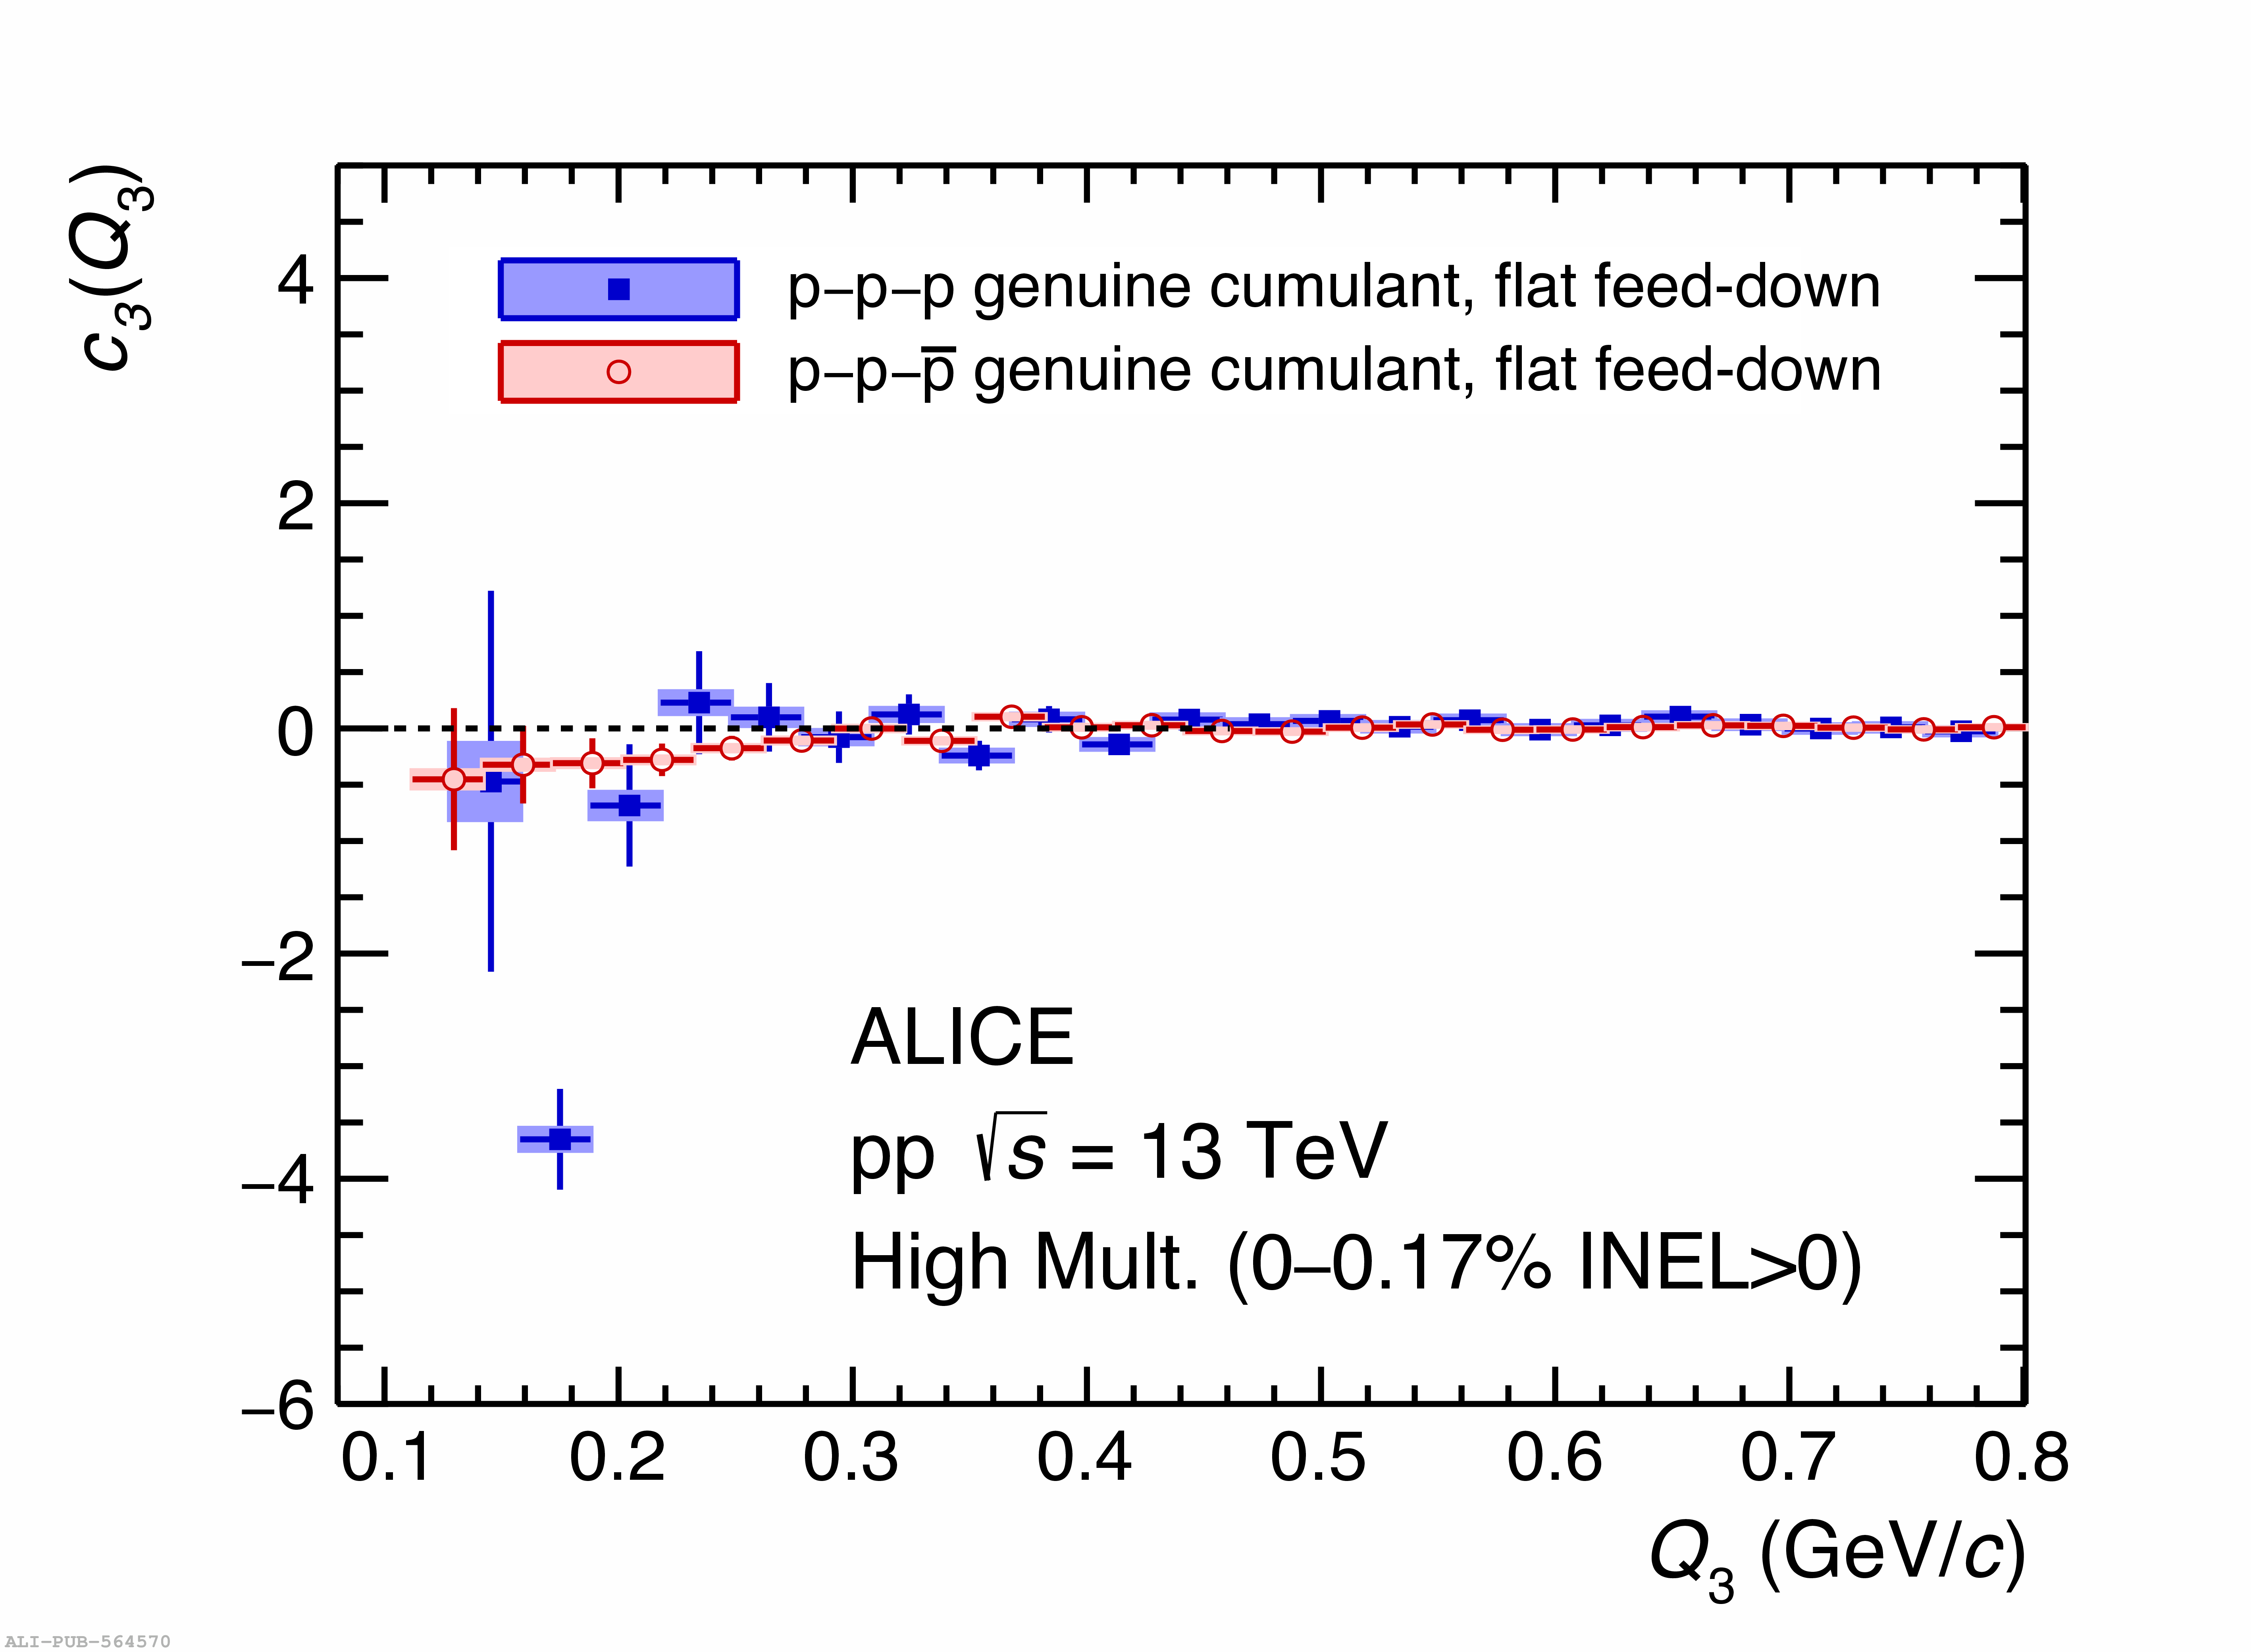 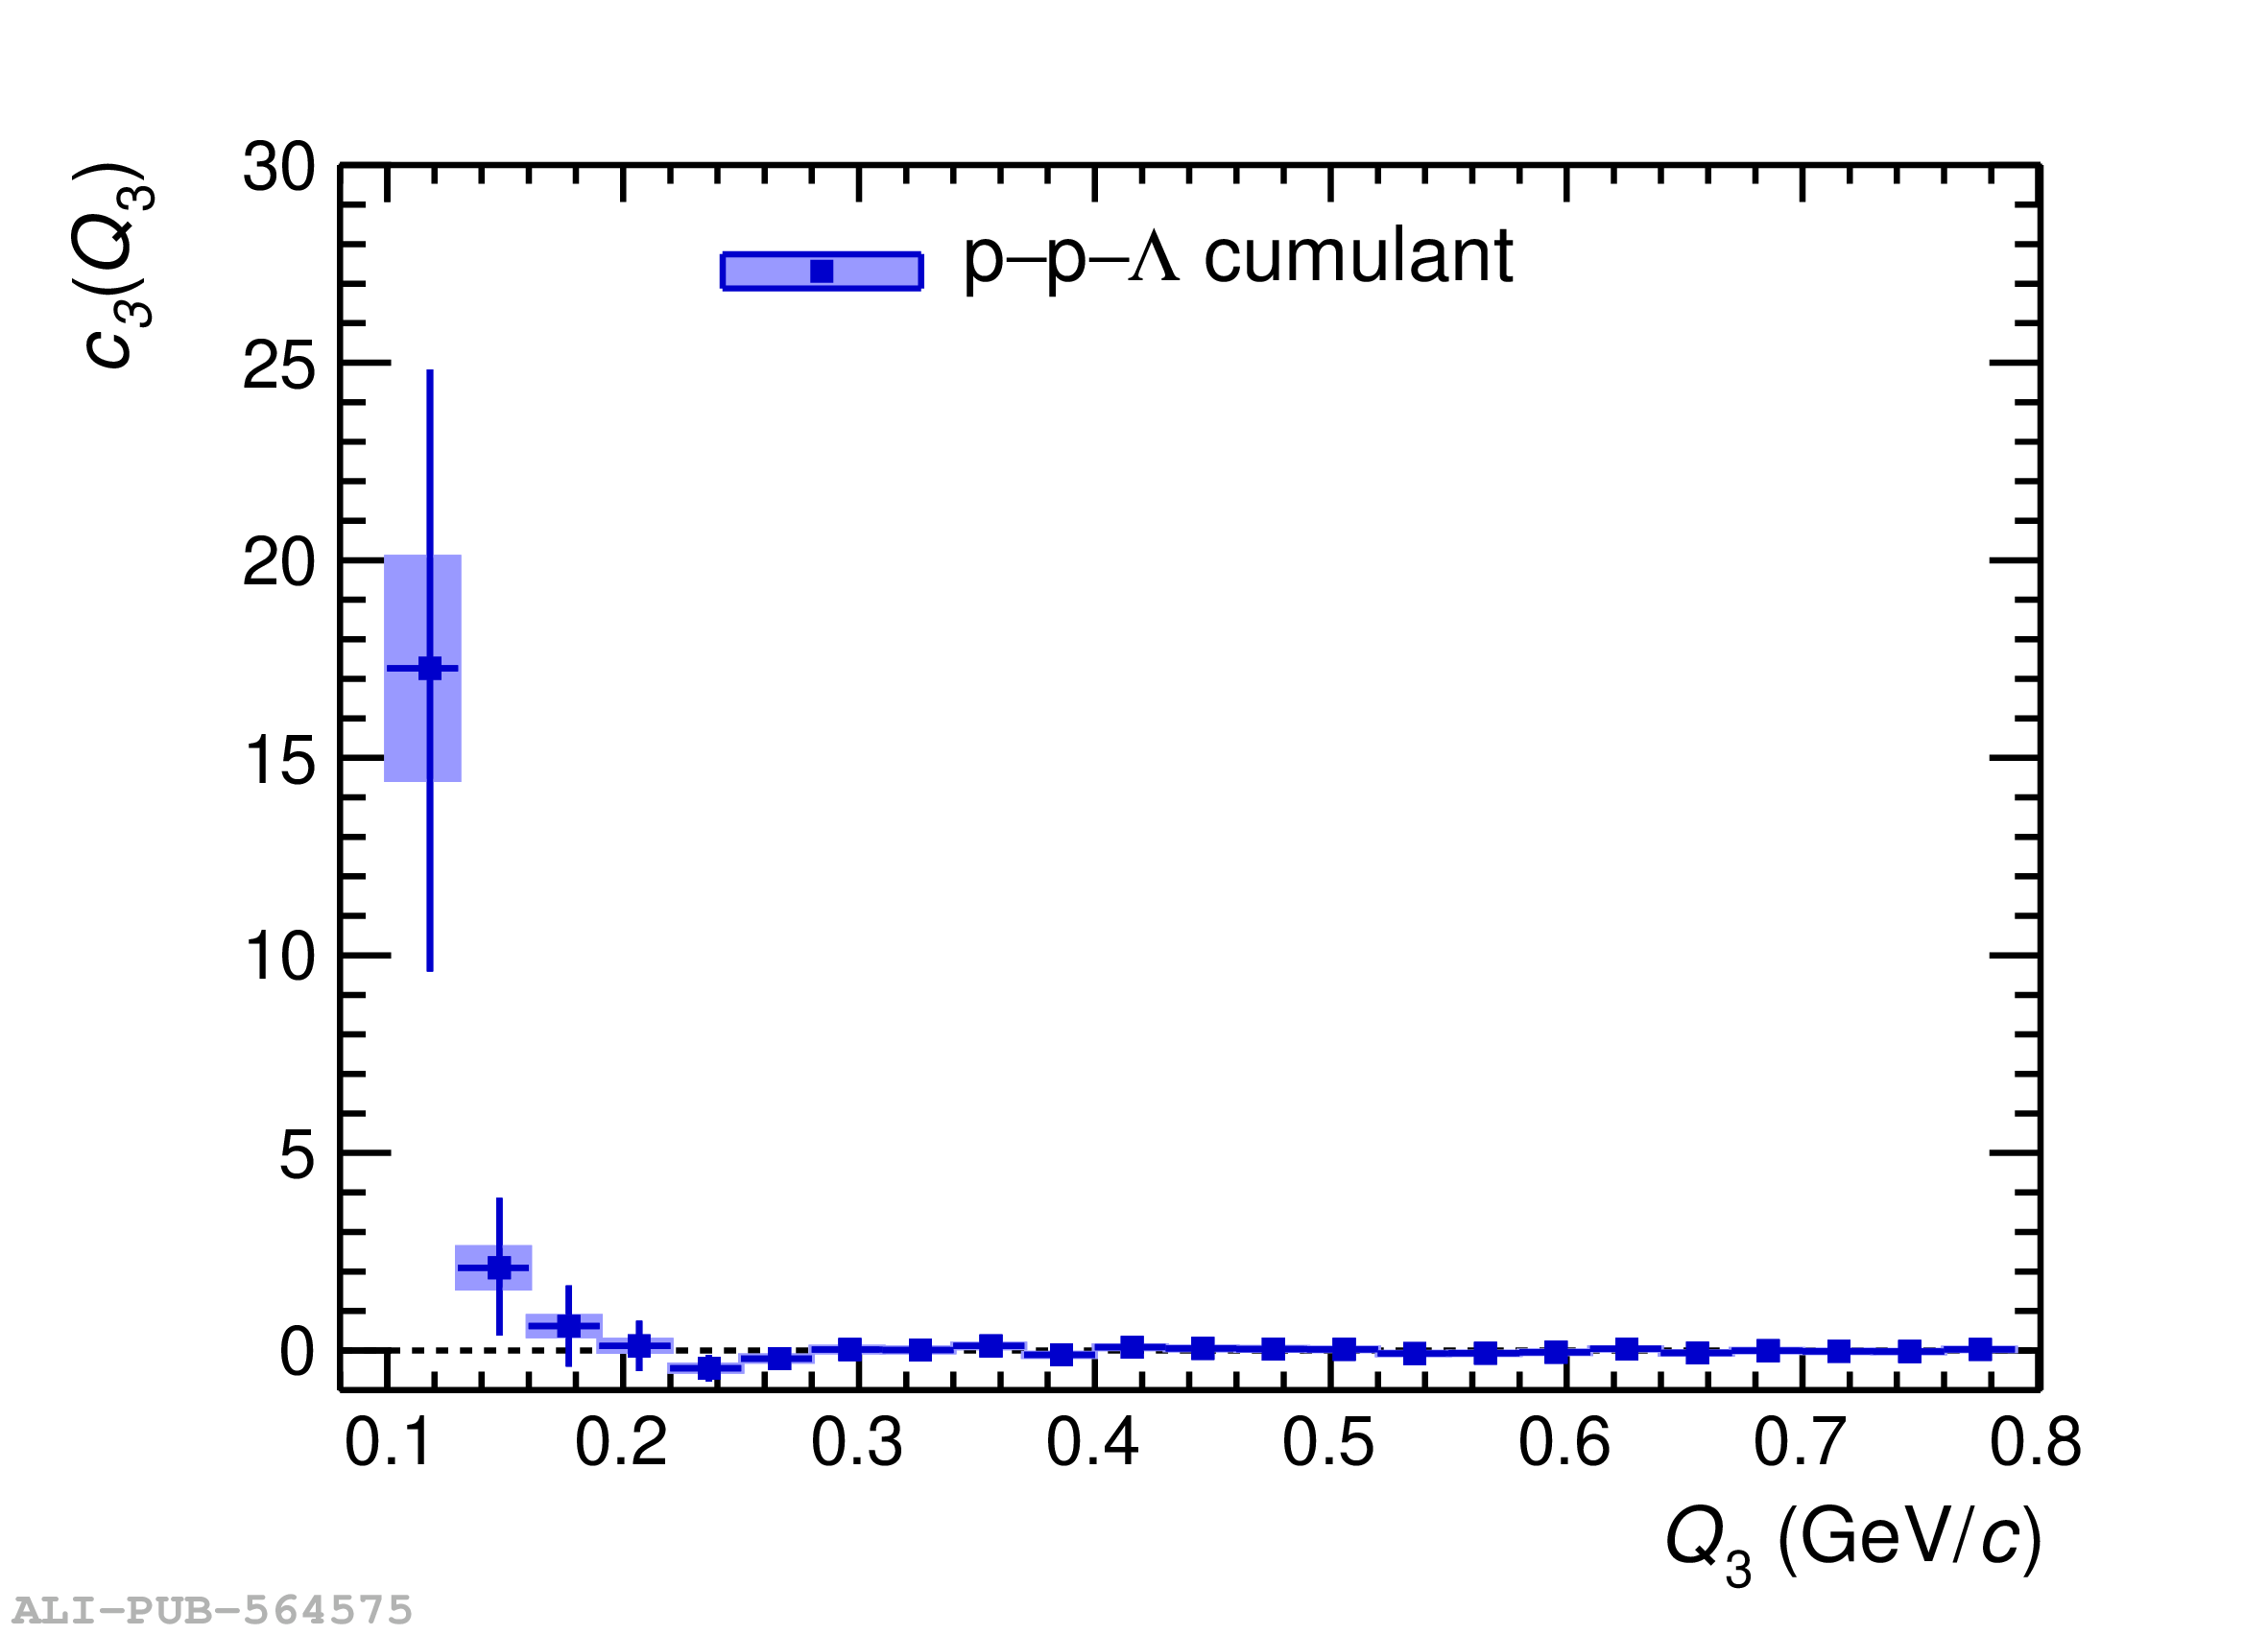 |
Figure A.1
The comparison between the correlation functions obtained from the measurements (green) and from the PYTHIA 8 event generator with a dedicated high-multiplicity selection to mimic the V0 high-multiplicity trigger (black). | 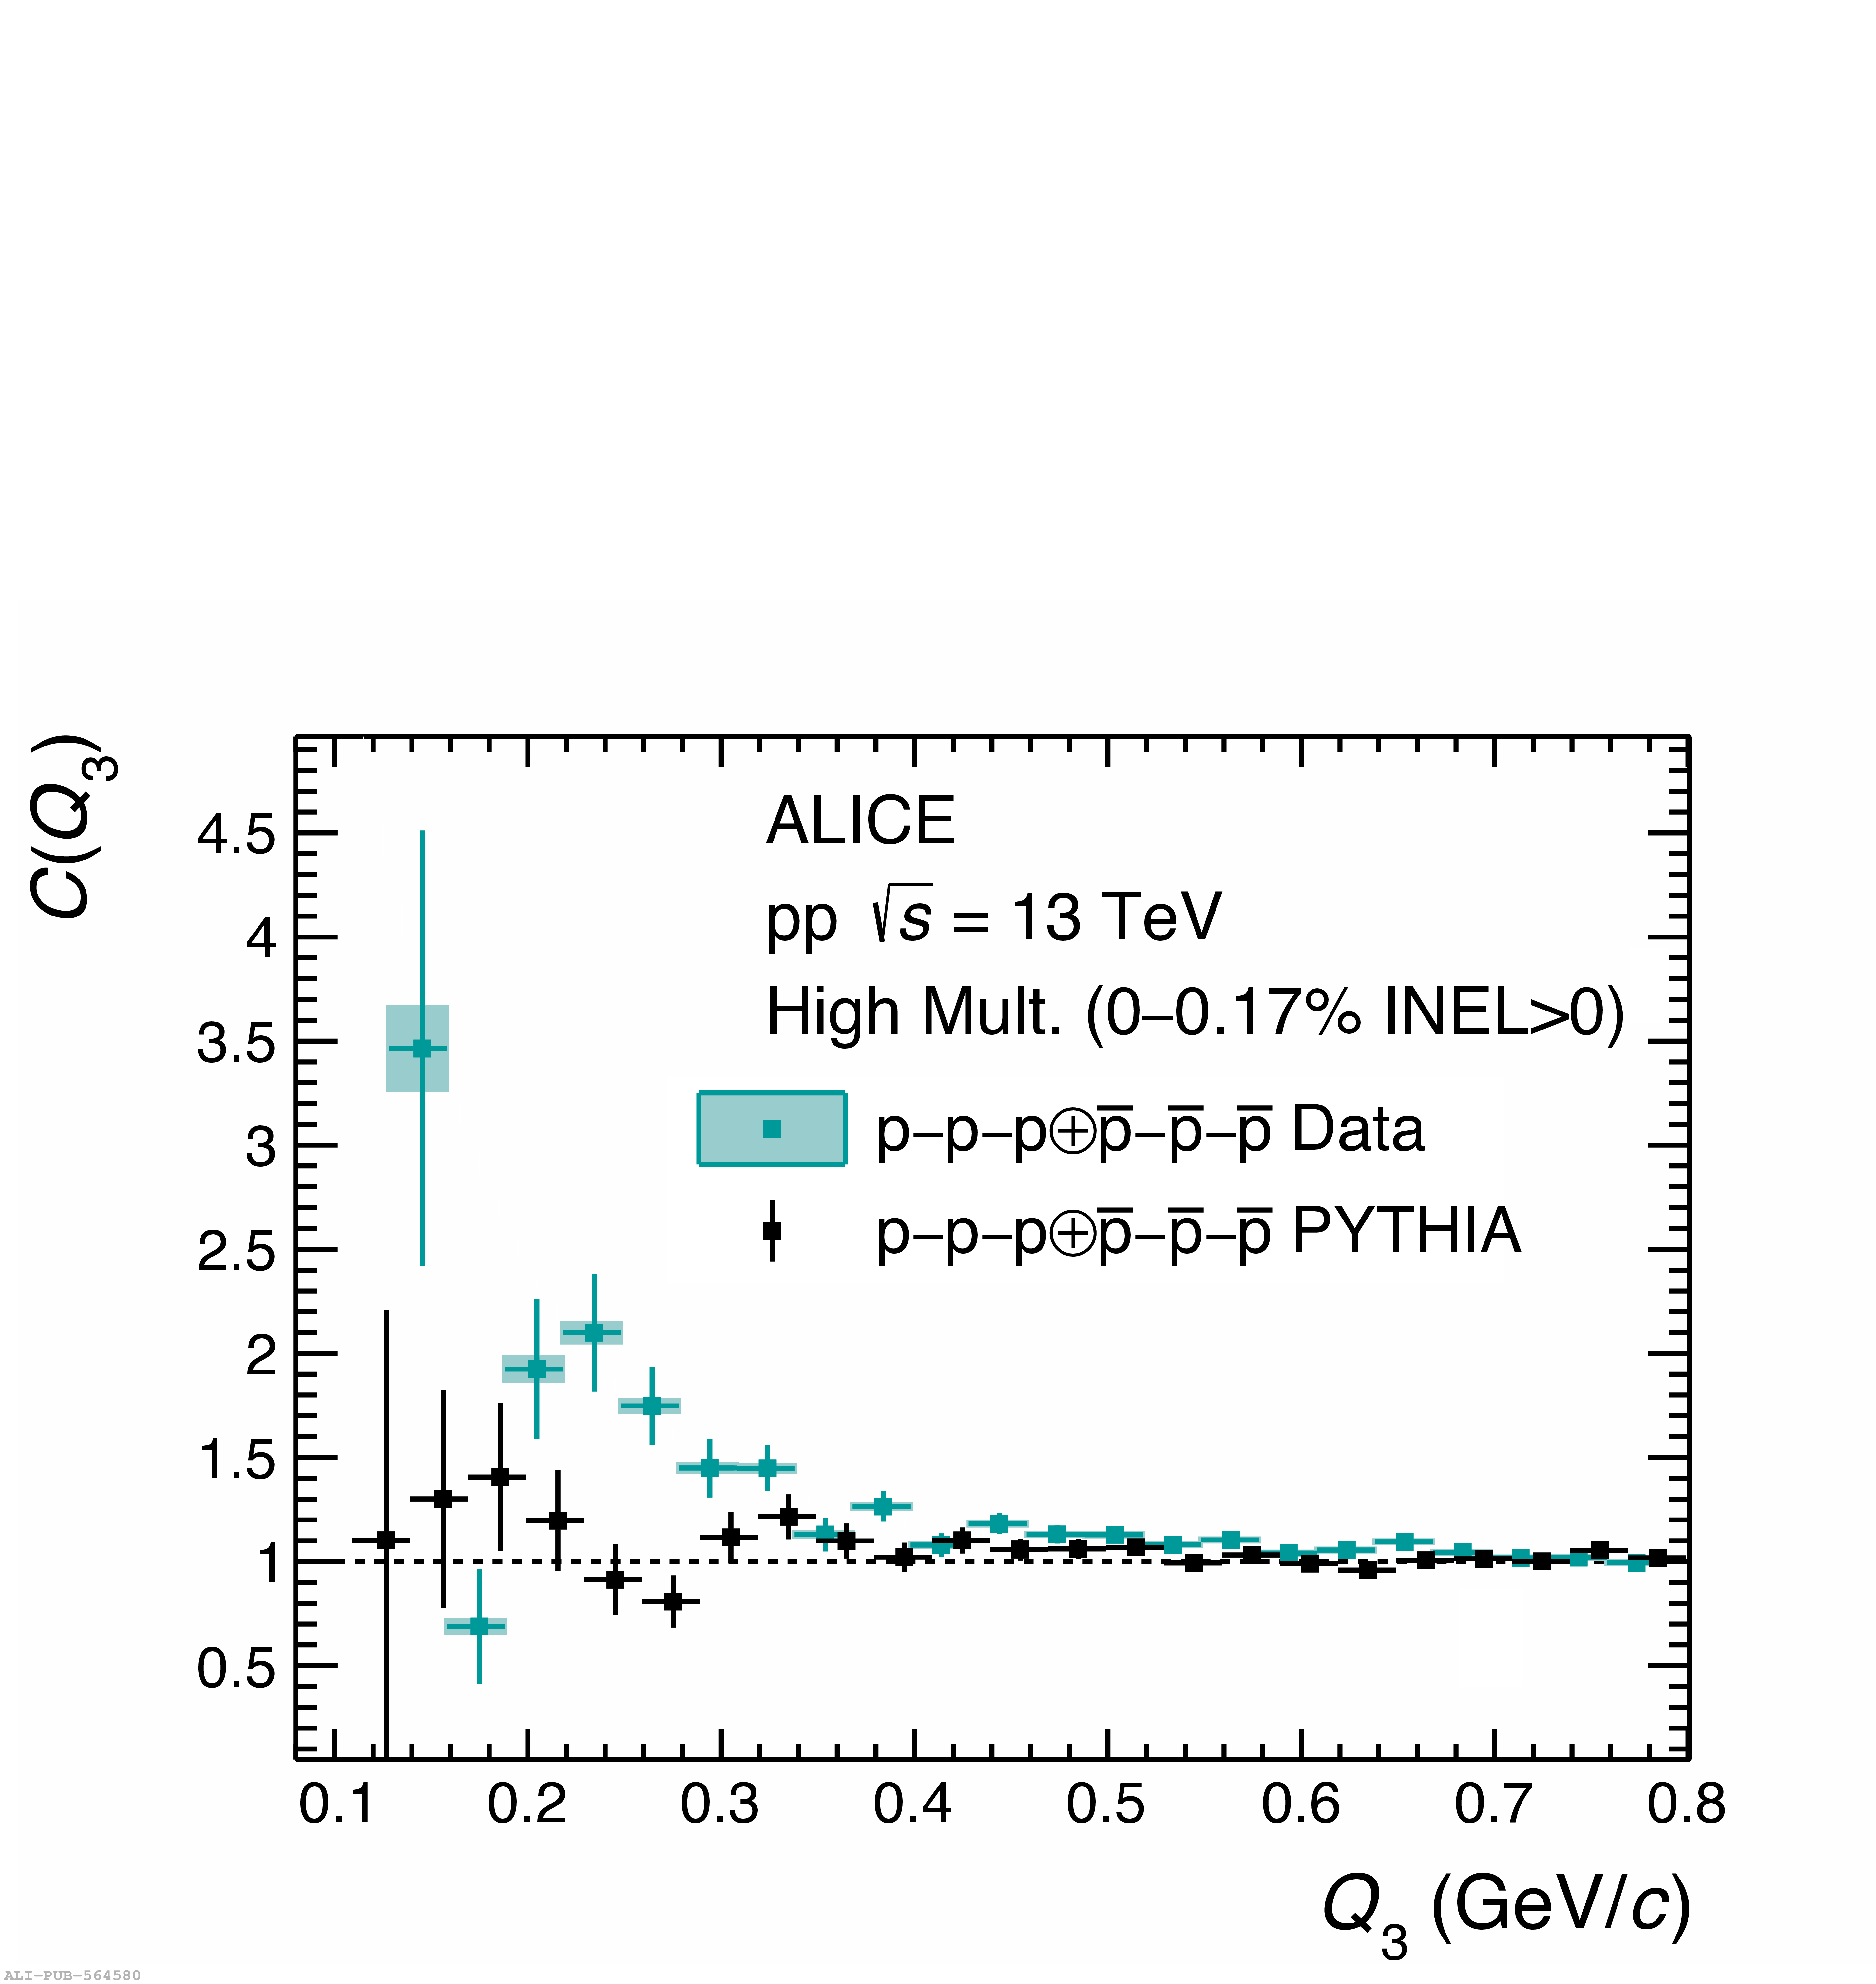 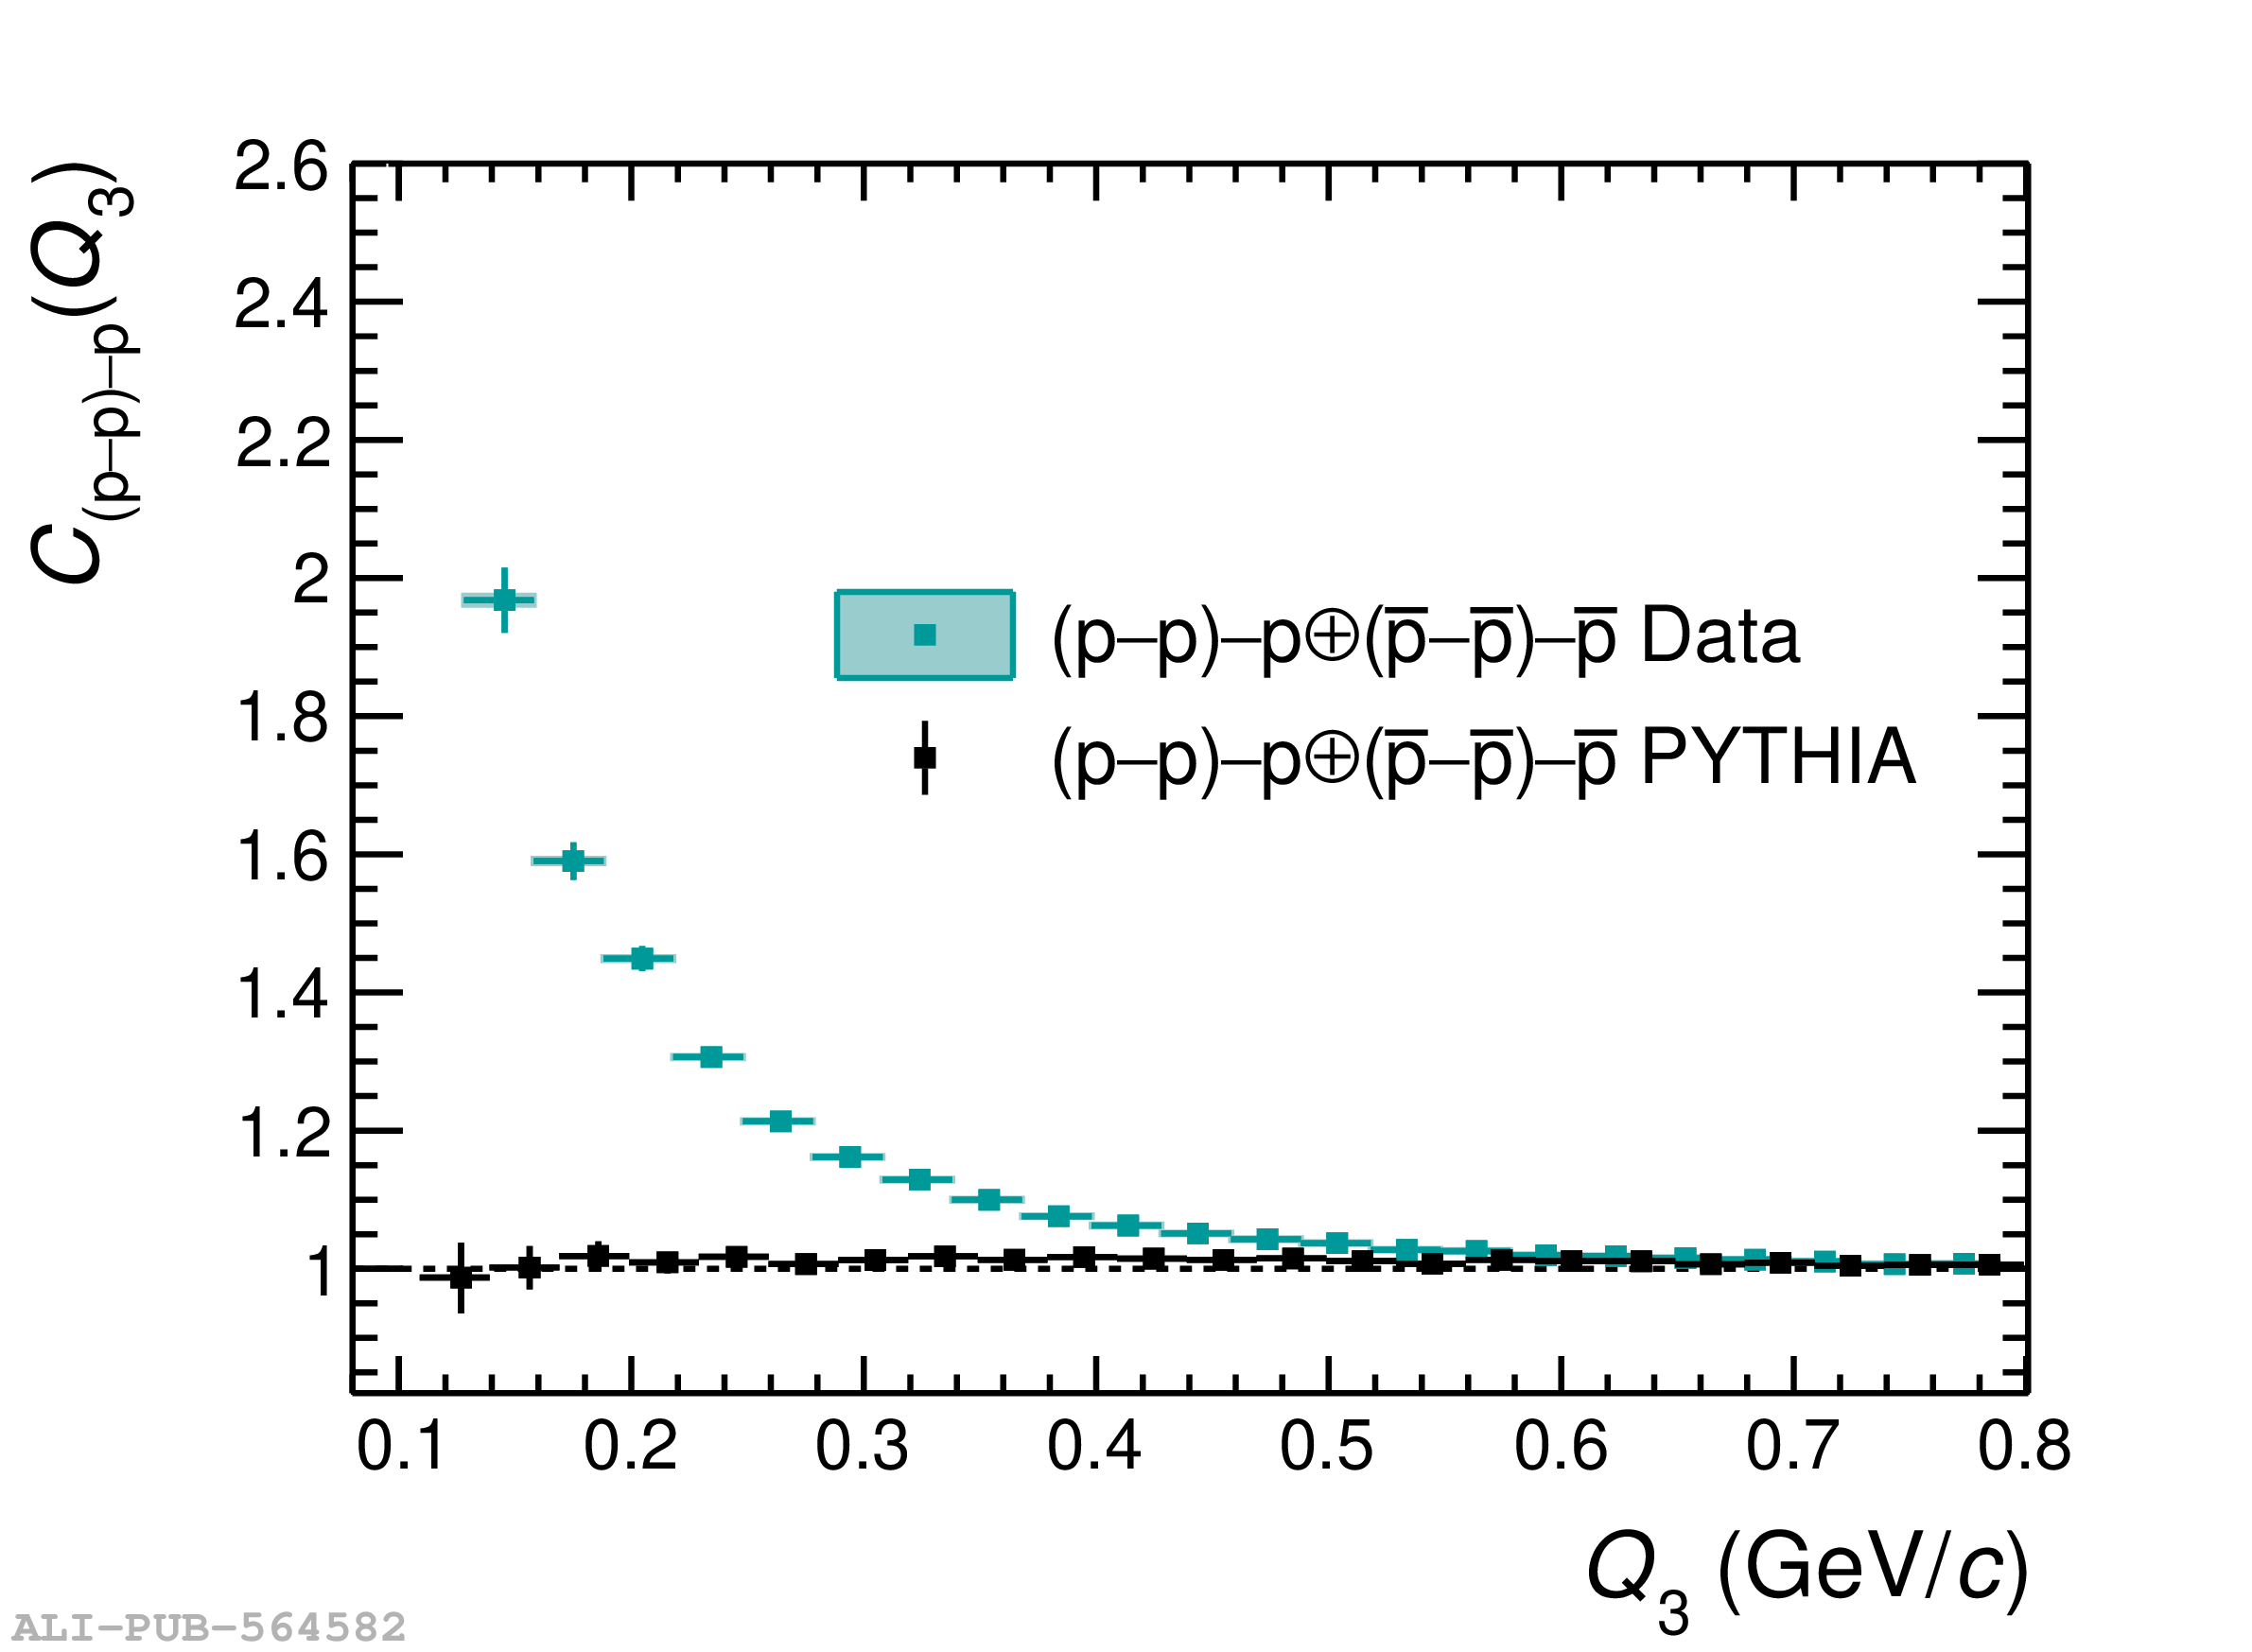 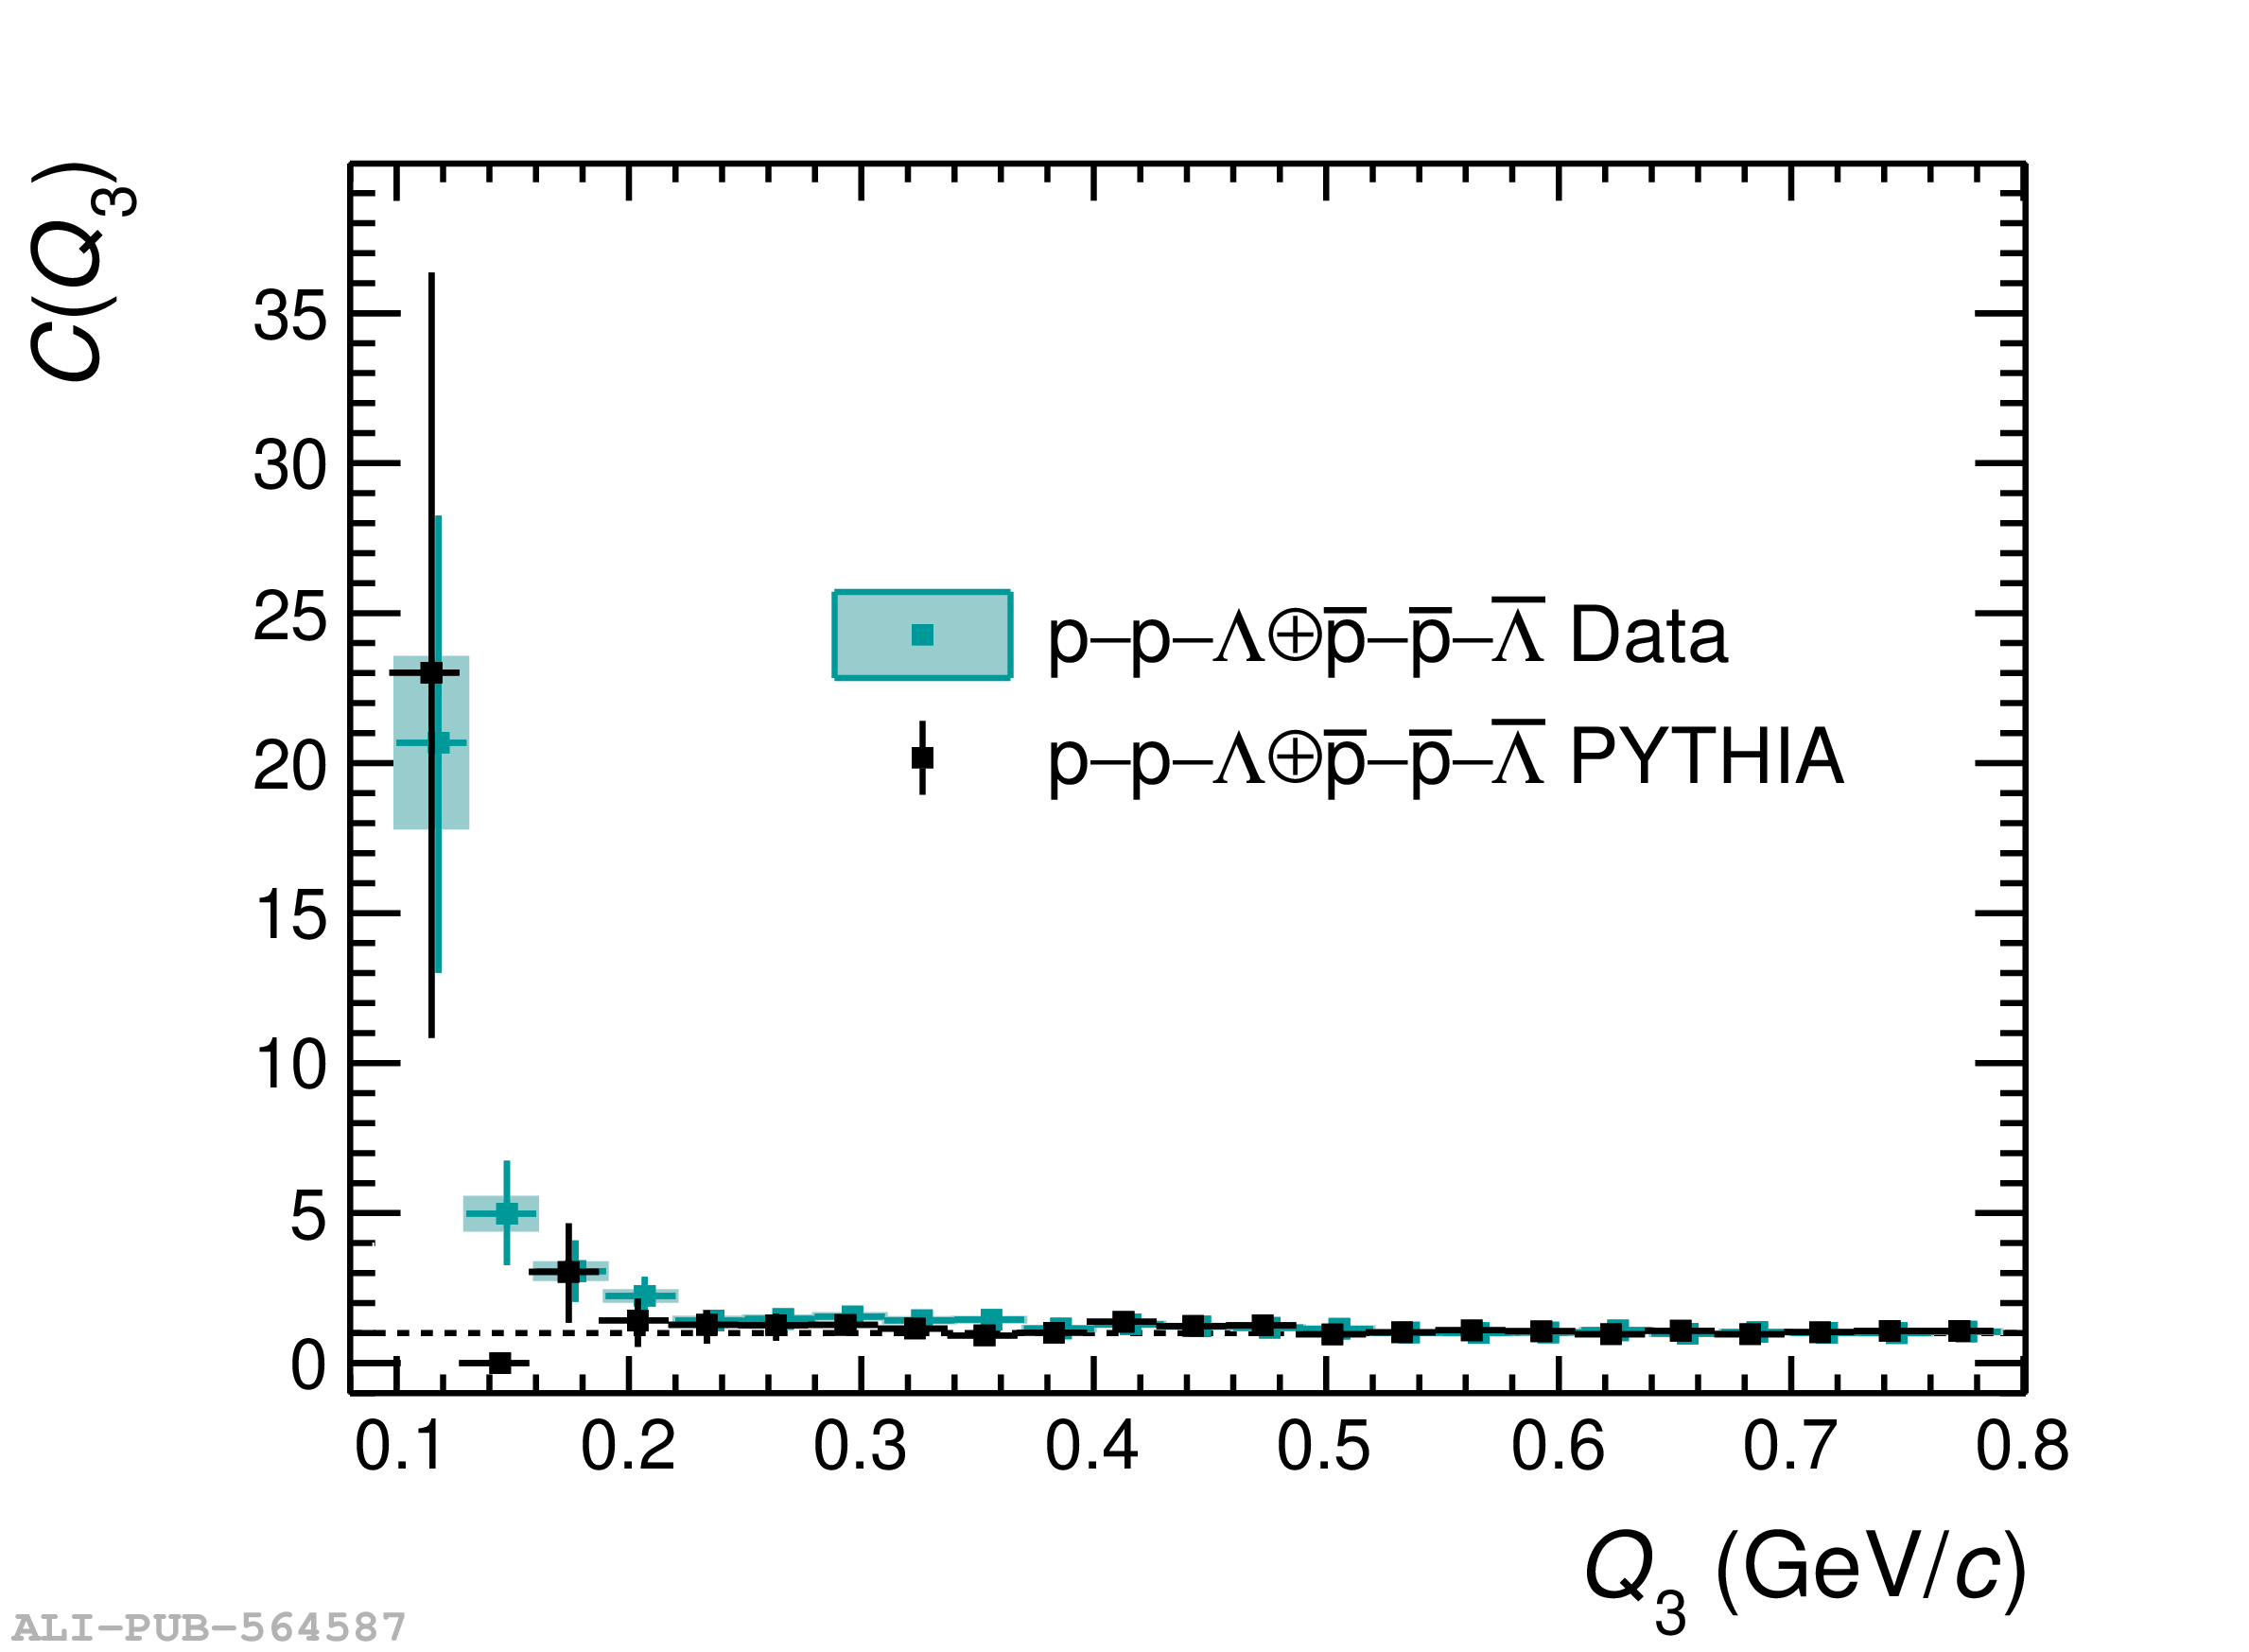 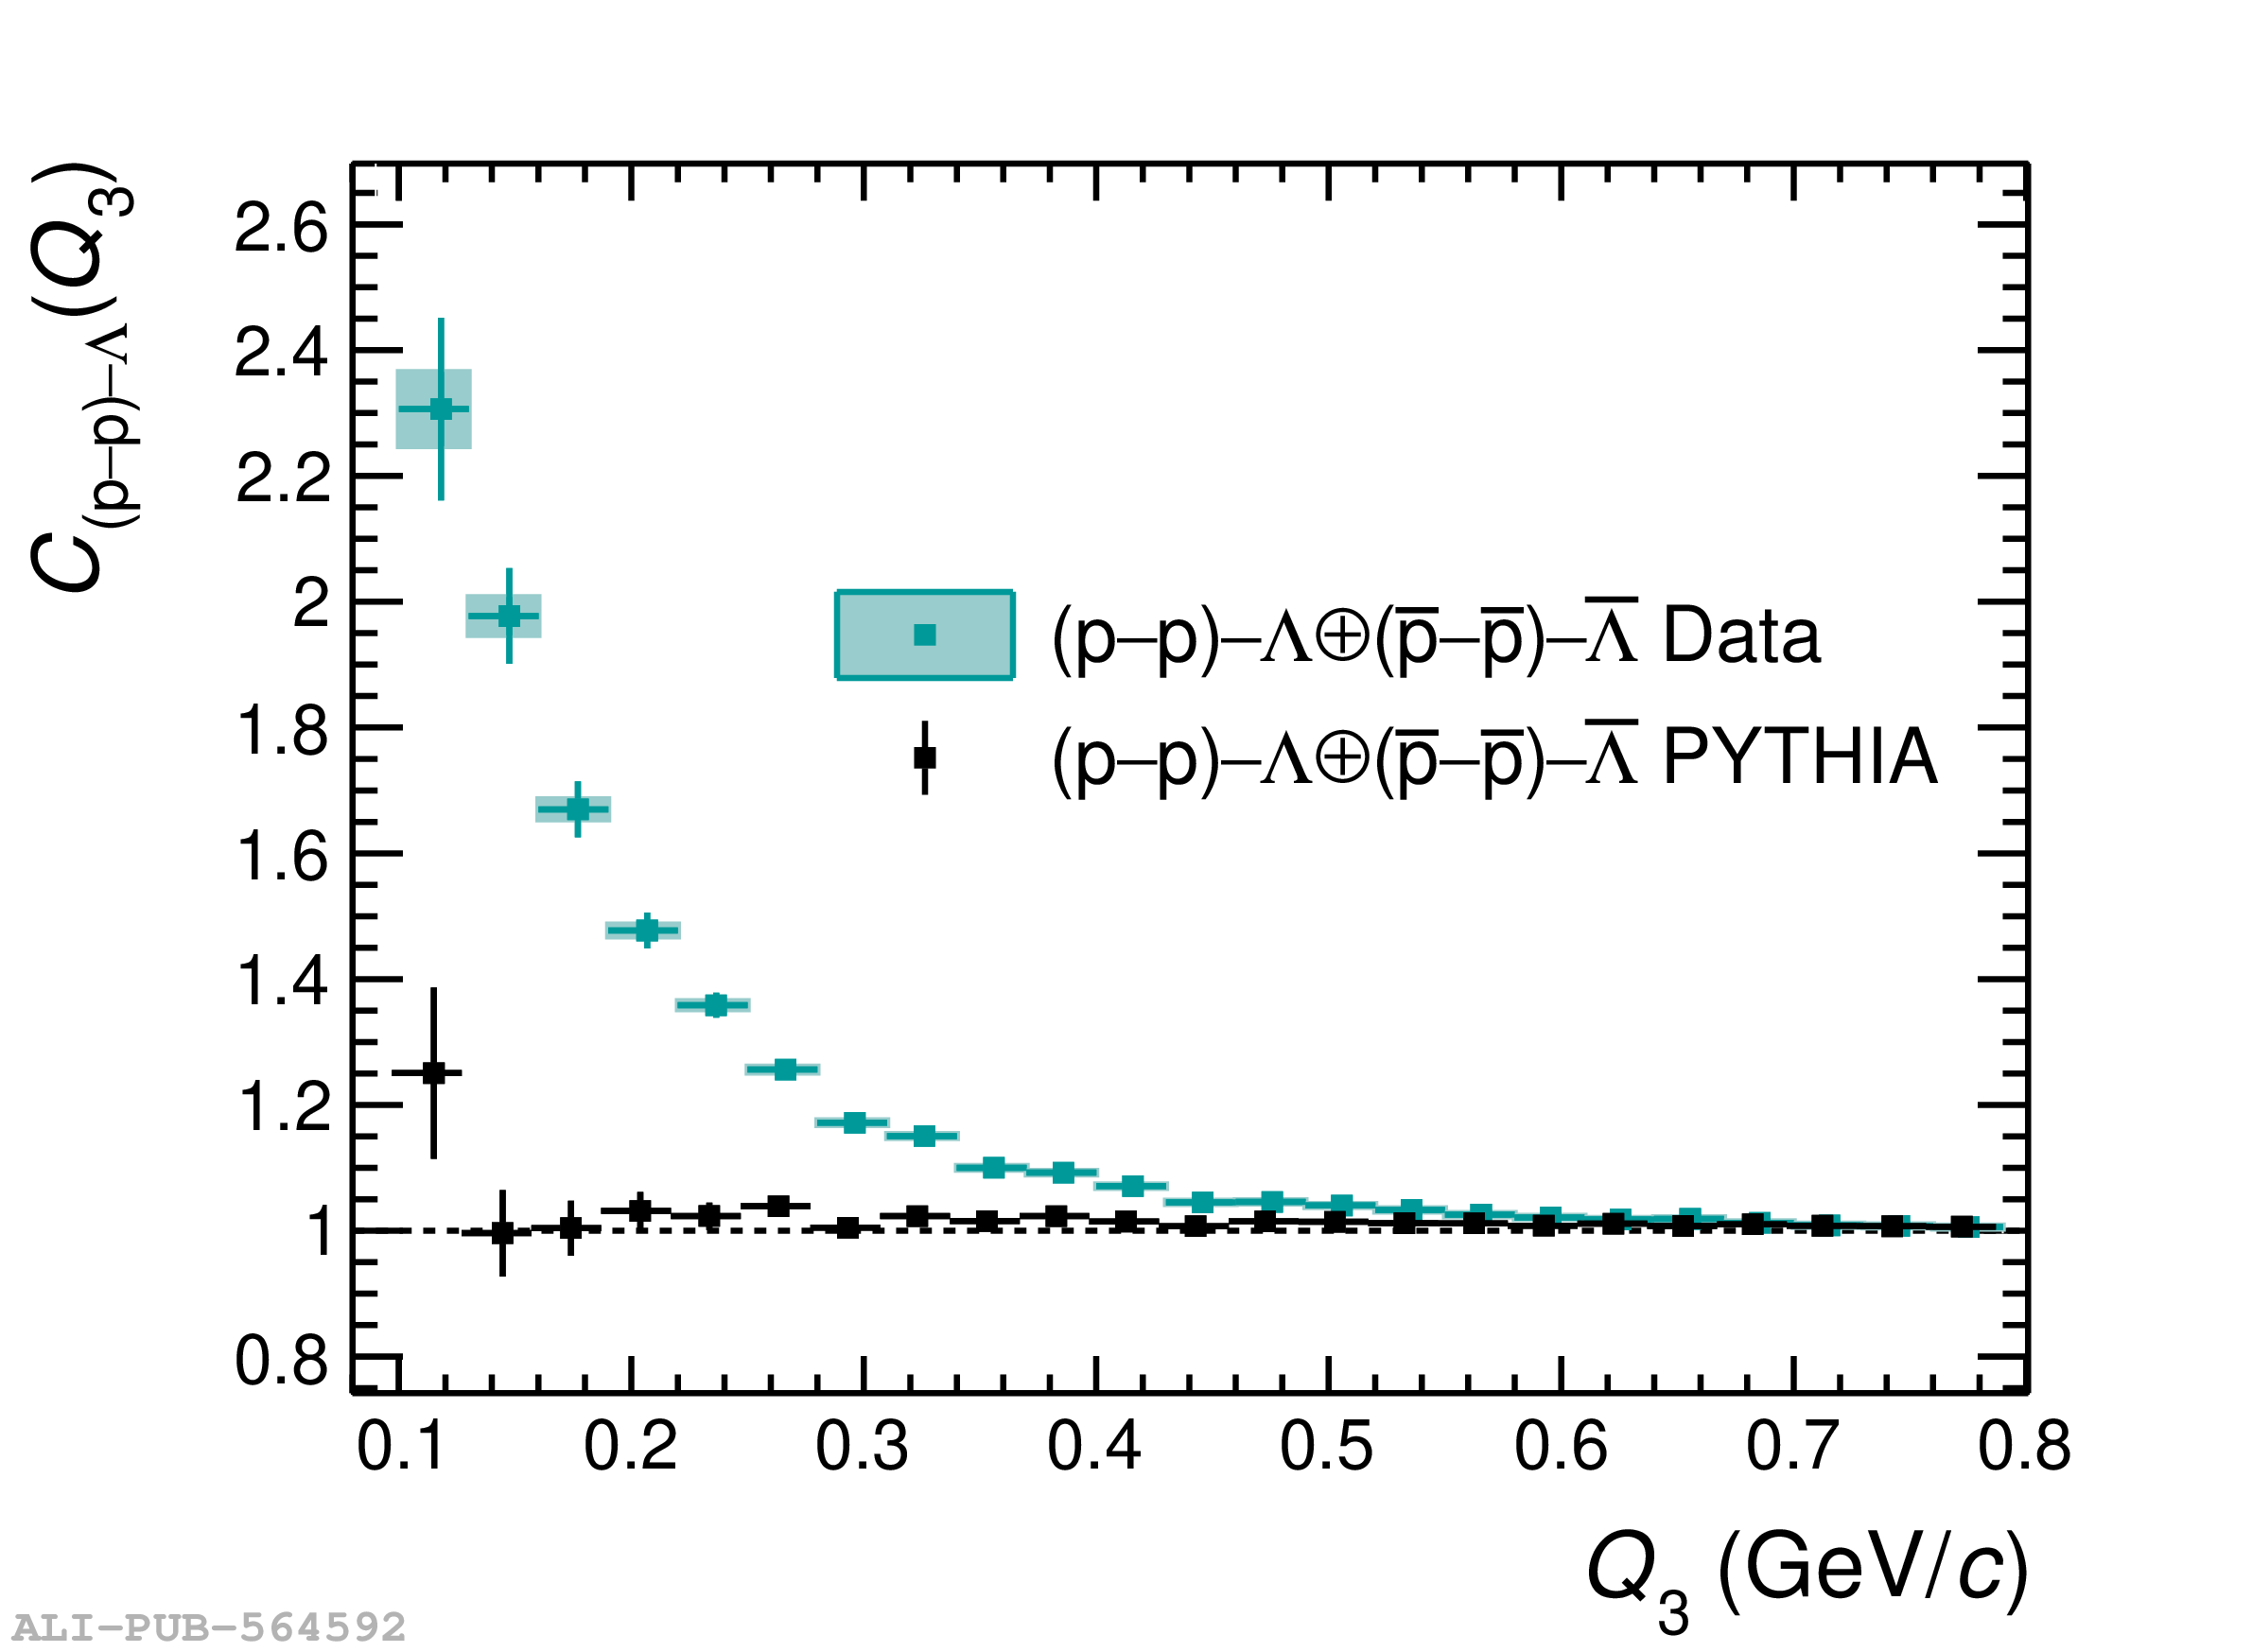 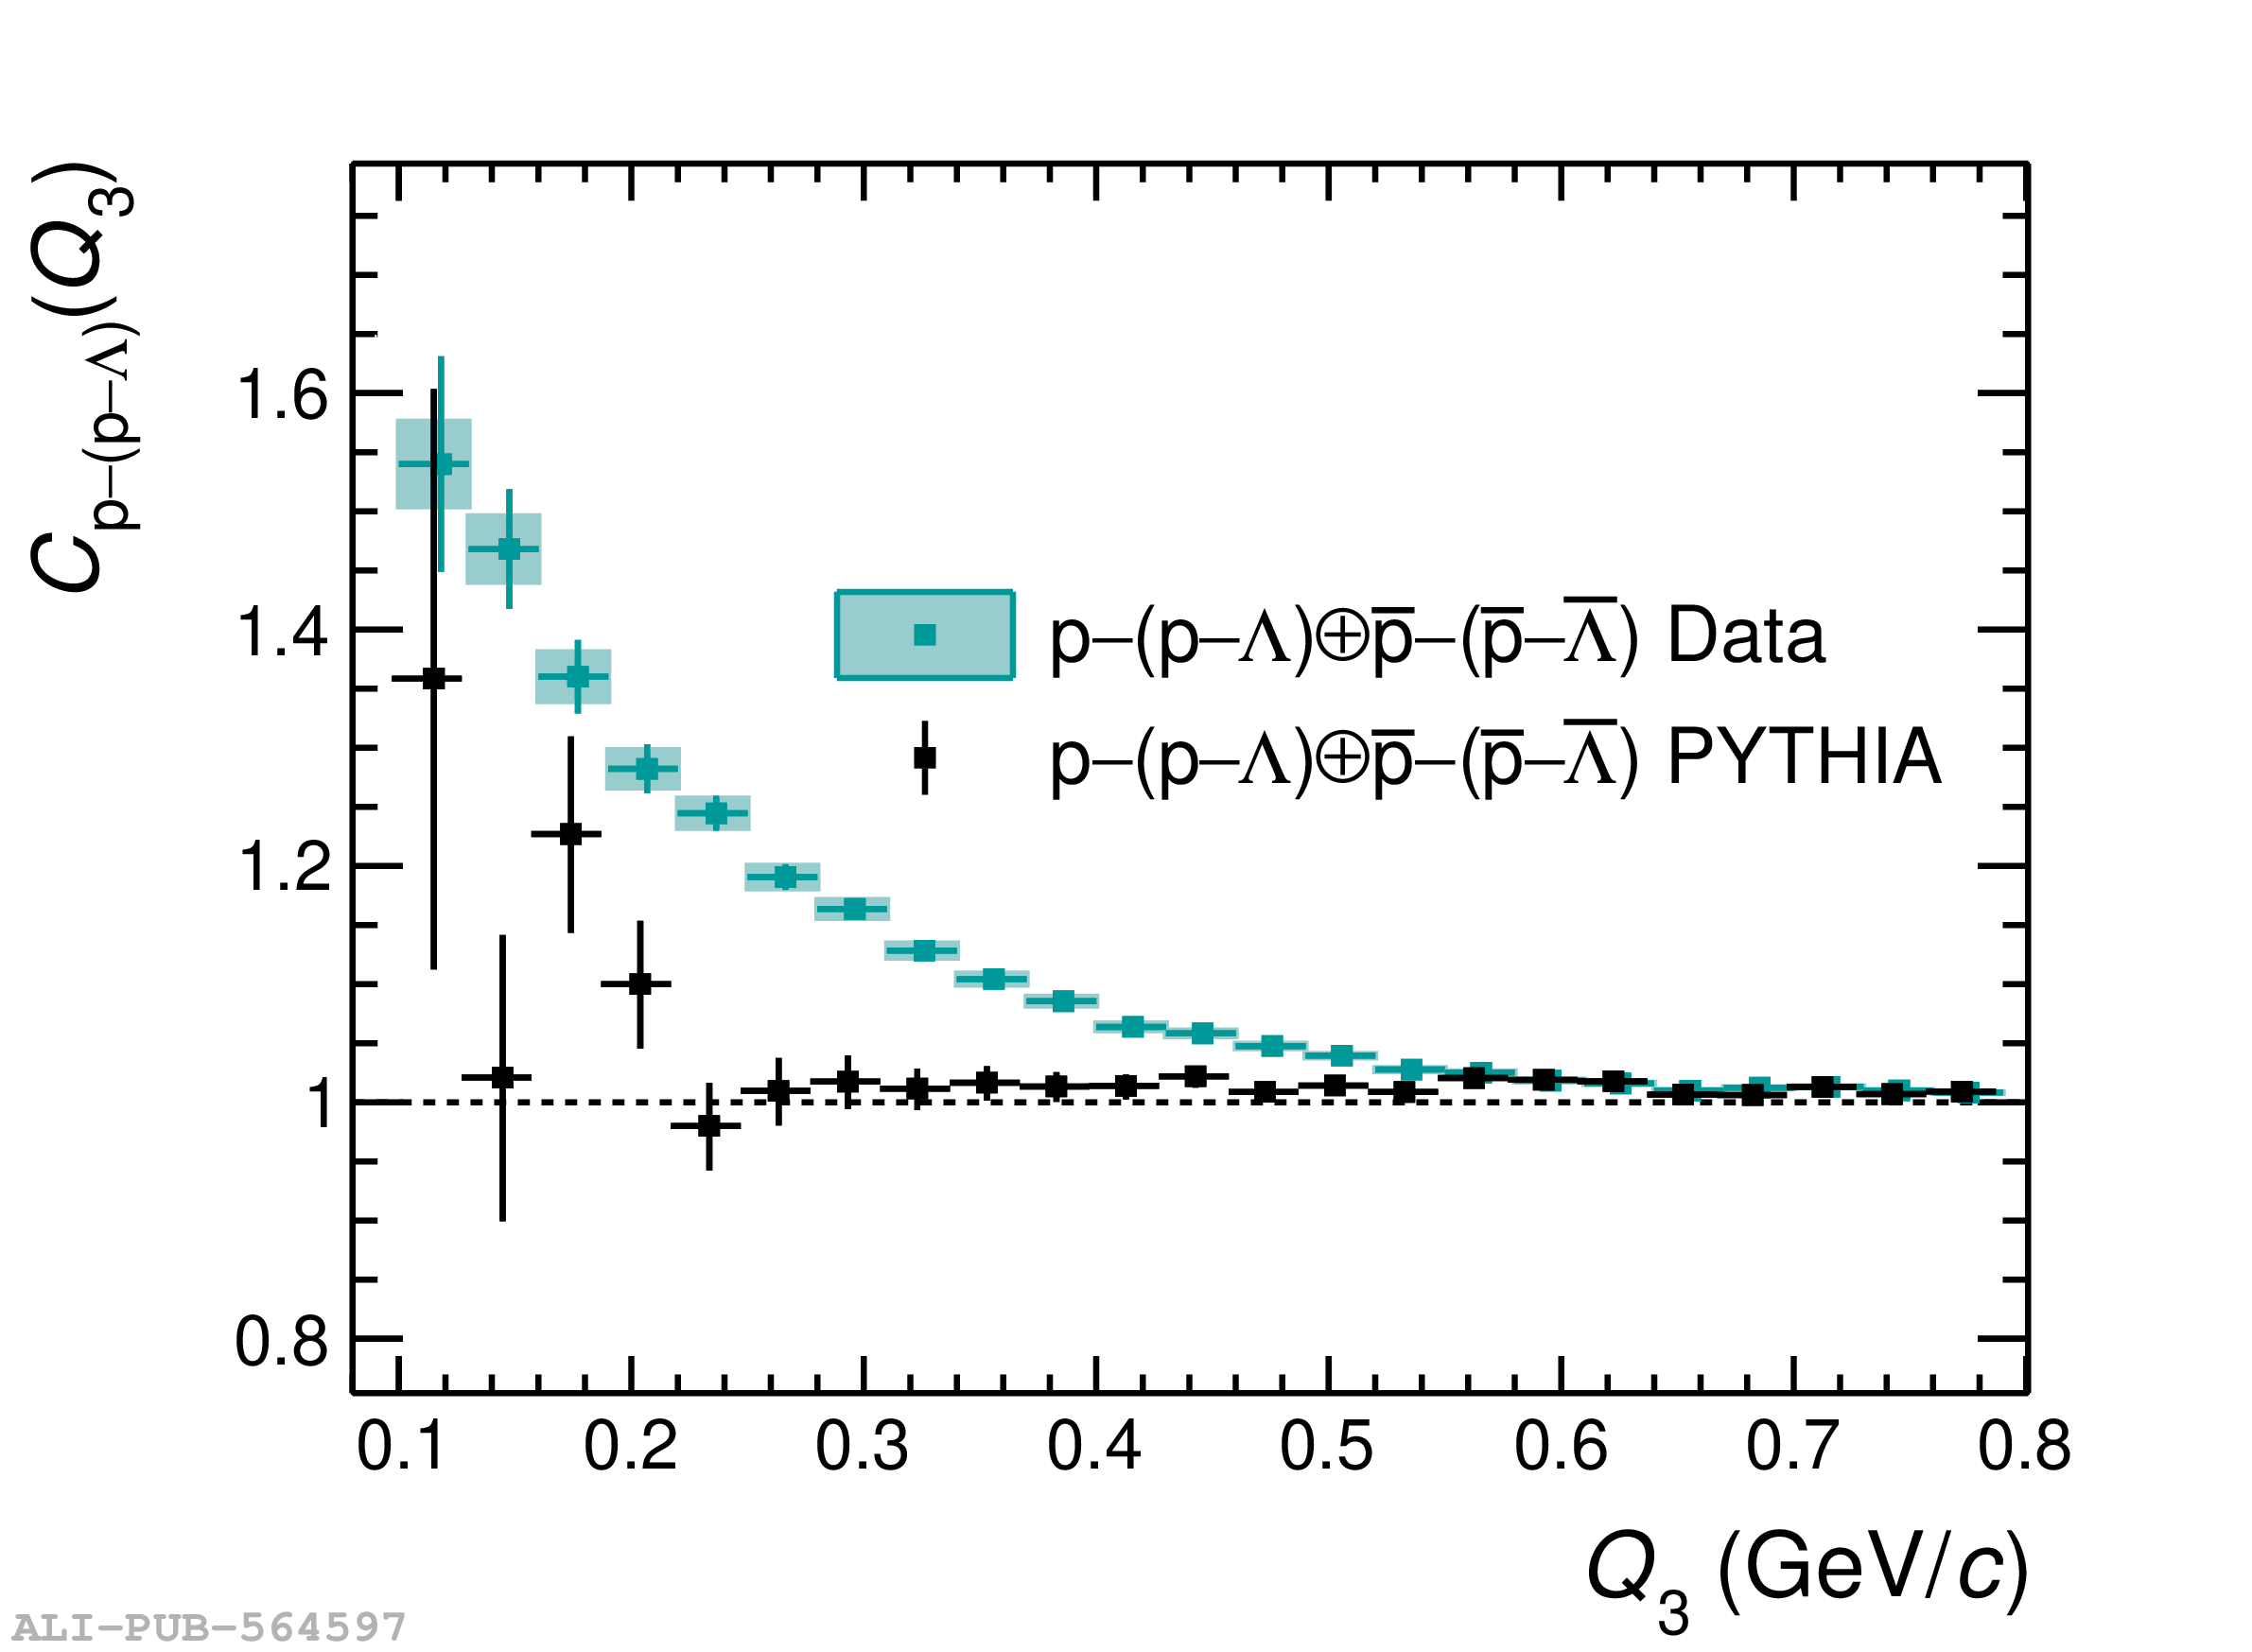 |
Figure B.1
Panel a) shows the correlation function for p$-$p$-\overline{\rm p}$ triplets (green data points) and the total lower order contributions (grey band). Panels b) and c) show the (p$-$p$)-\overline{\rm p}$ and (p$-\overline{\rm p})-$p lower-order contributions to the measured p$-$p$-\overline{\rm p}$ correlation function. The error bars and the boxes represent the statistical and systematic uncertainties, respectively. The grey band includes systematic and statistical uncertainties summed in quadrature obtained from the projector method. | 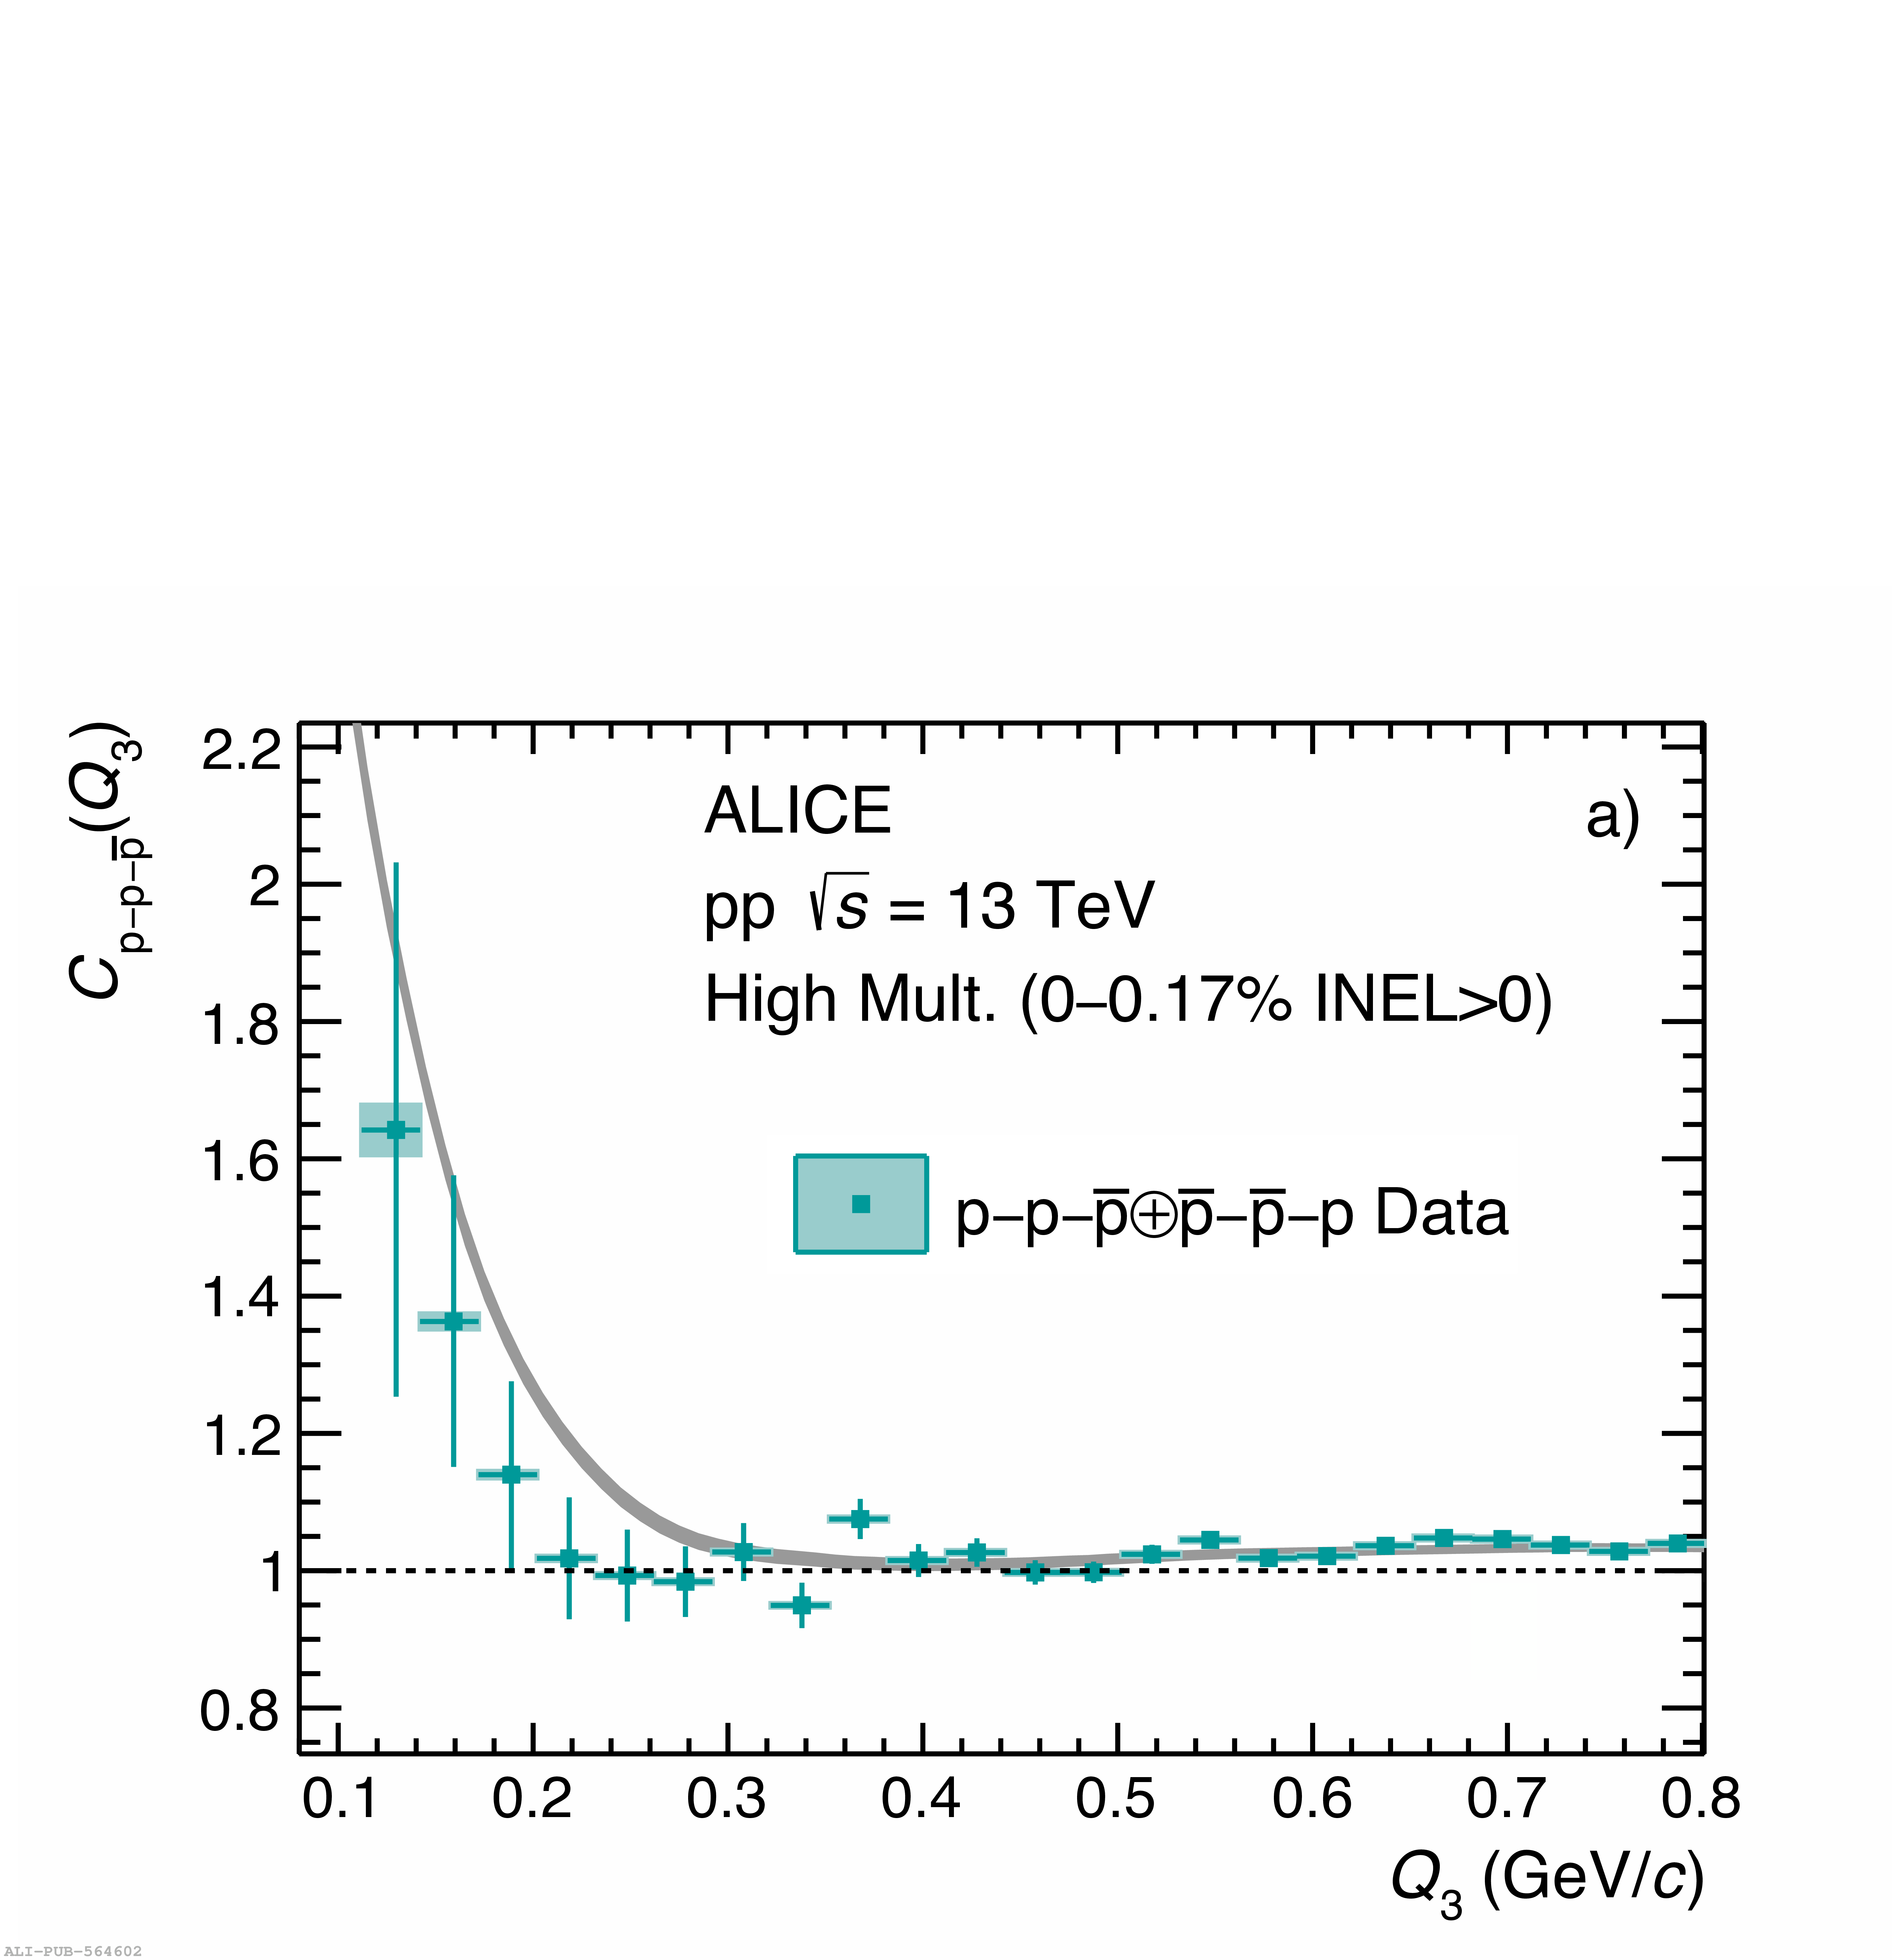 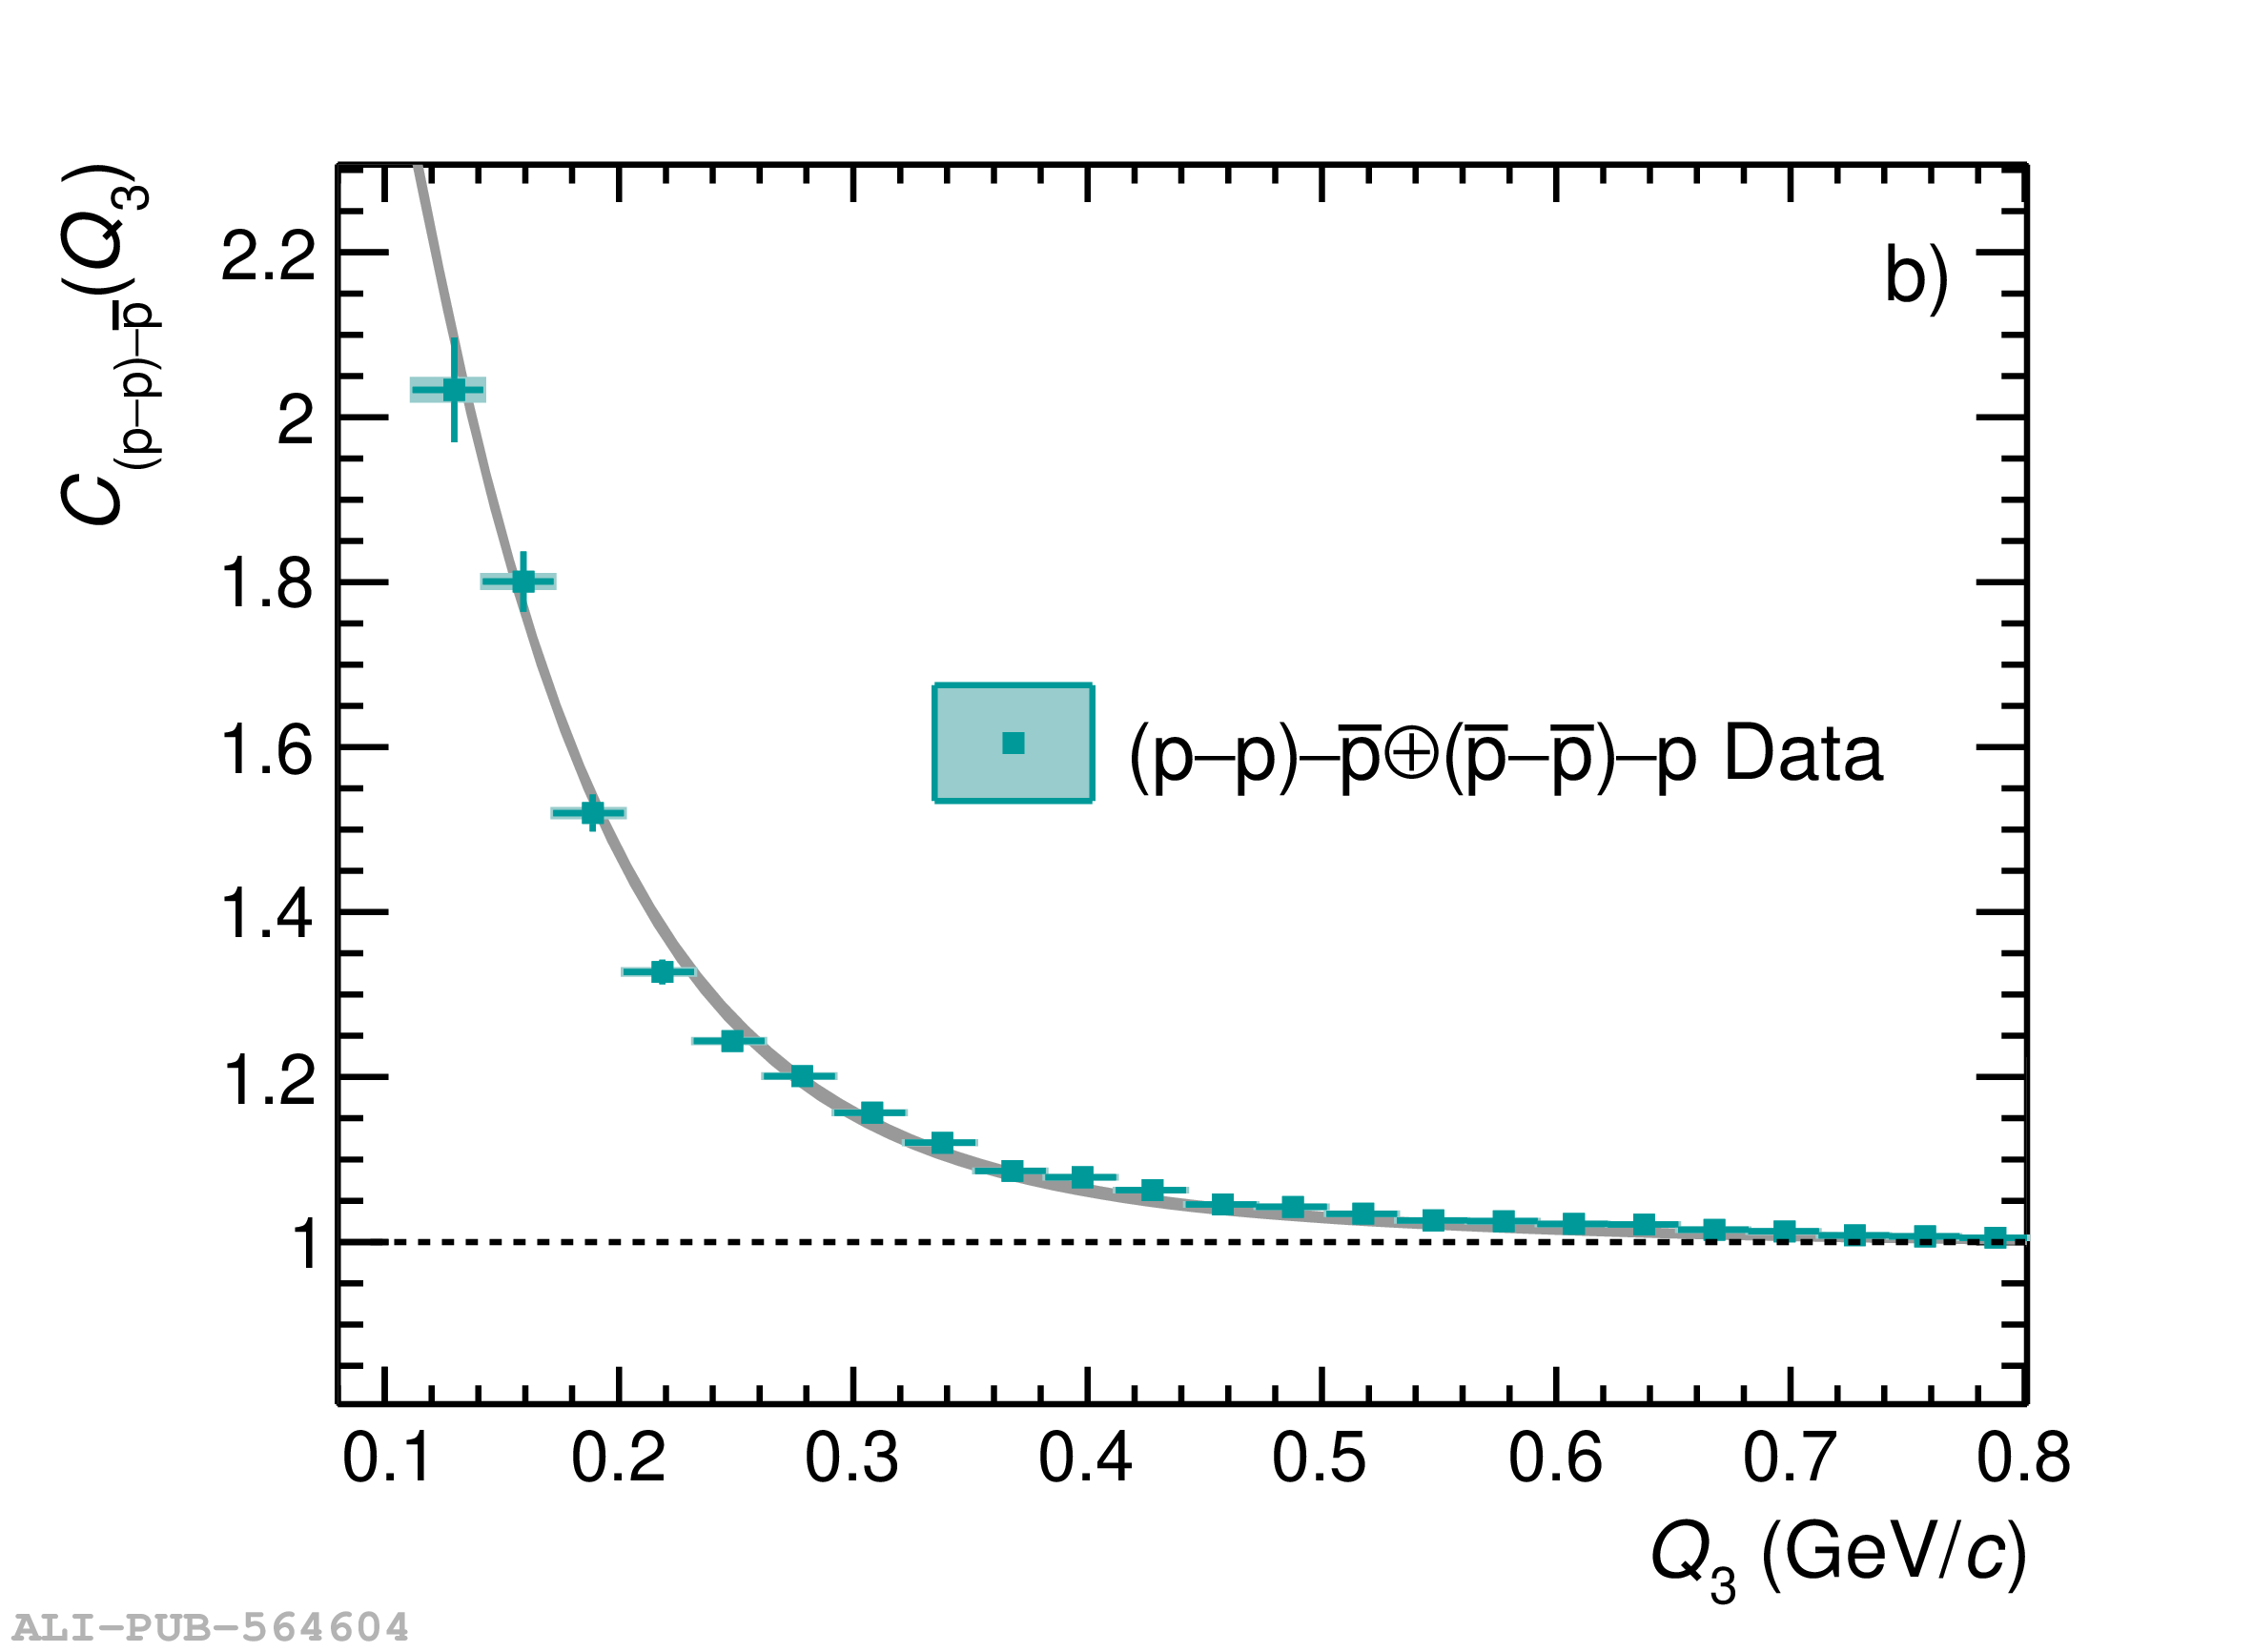 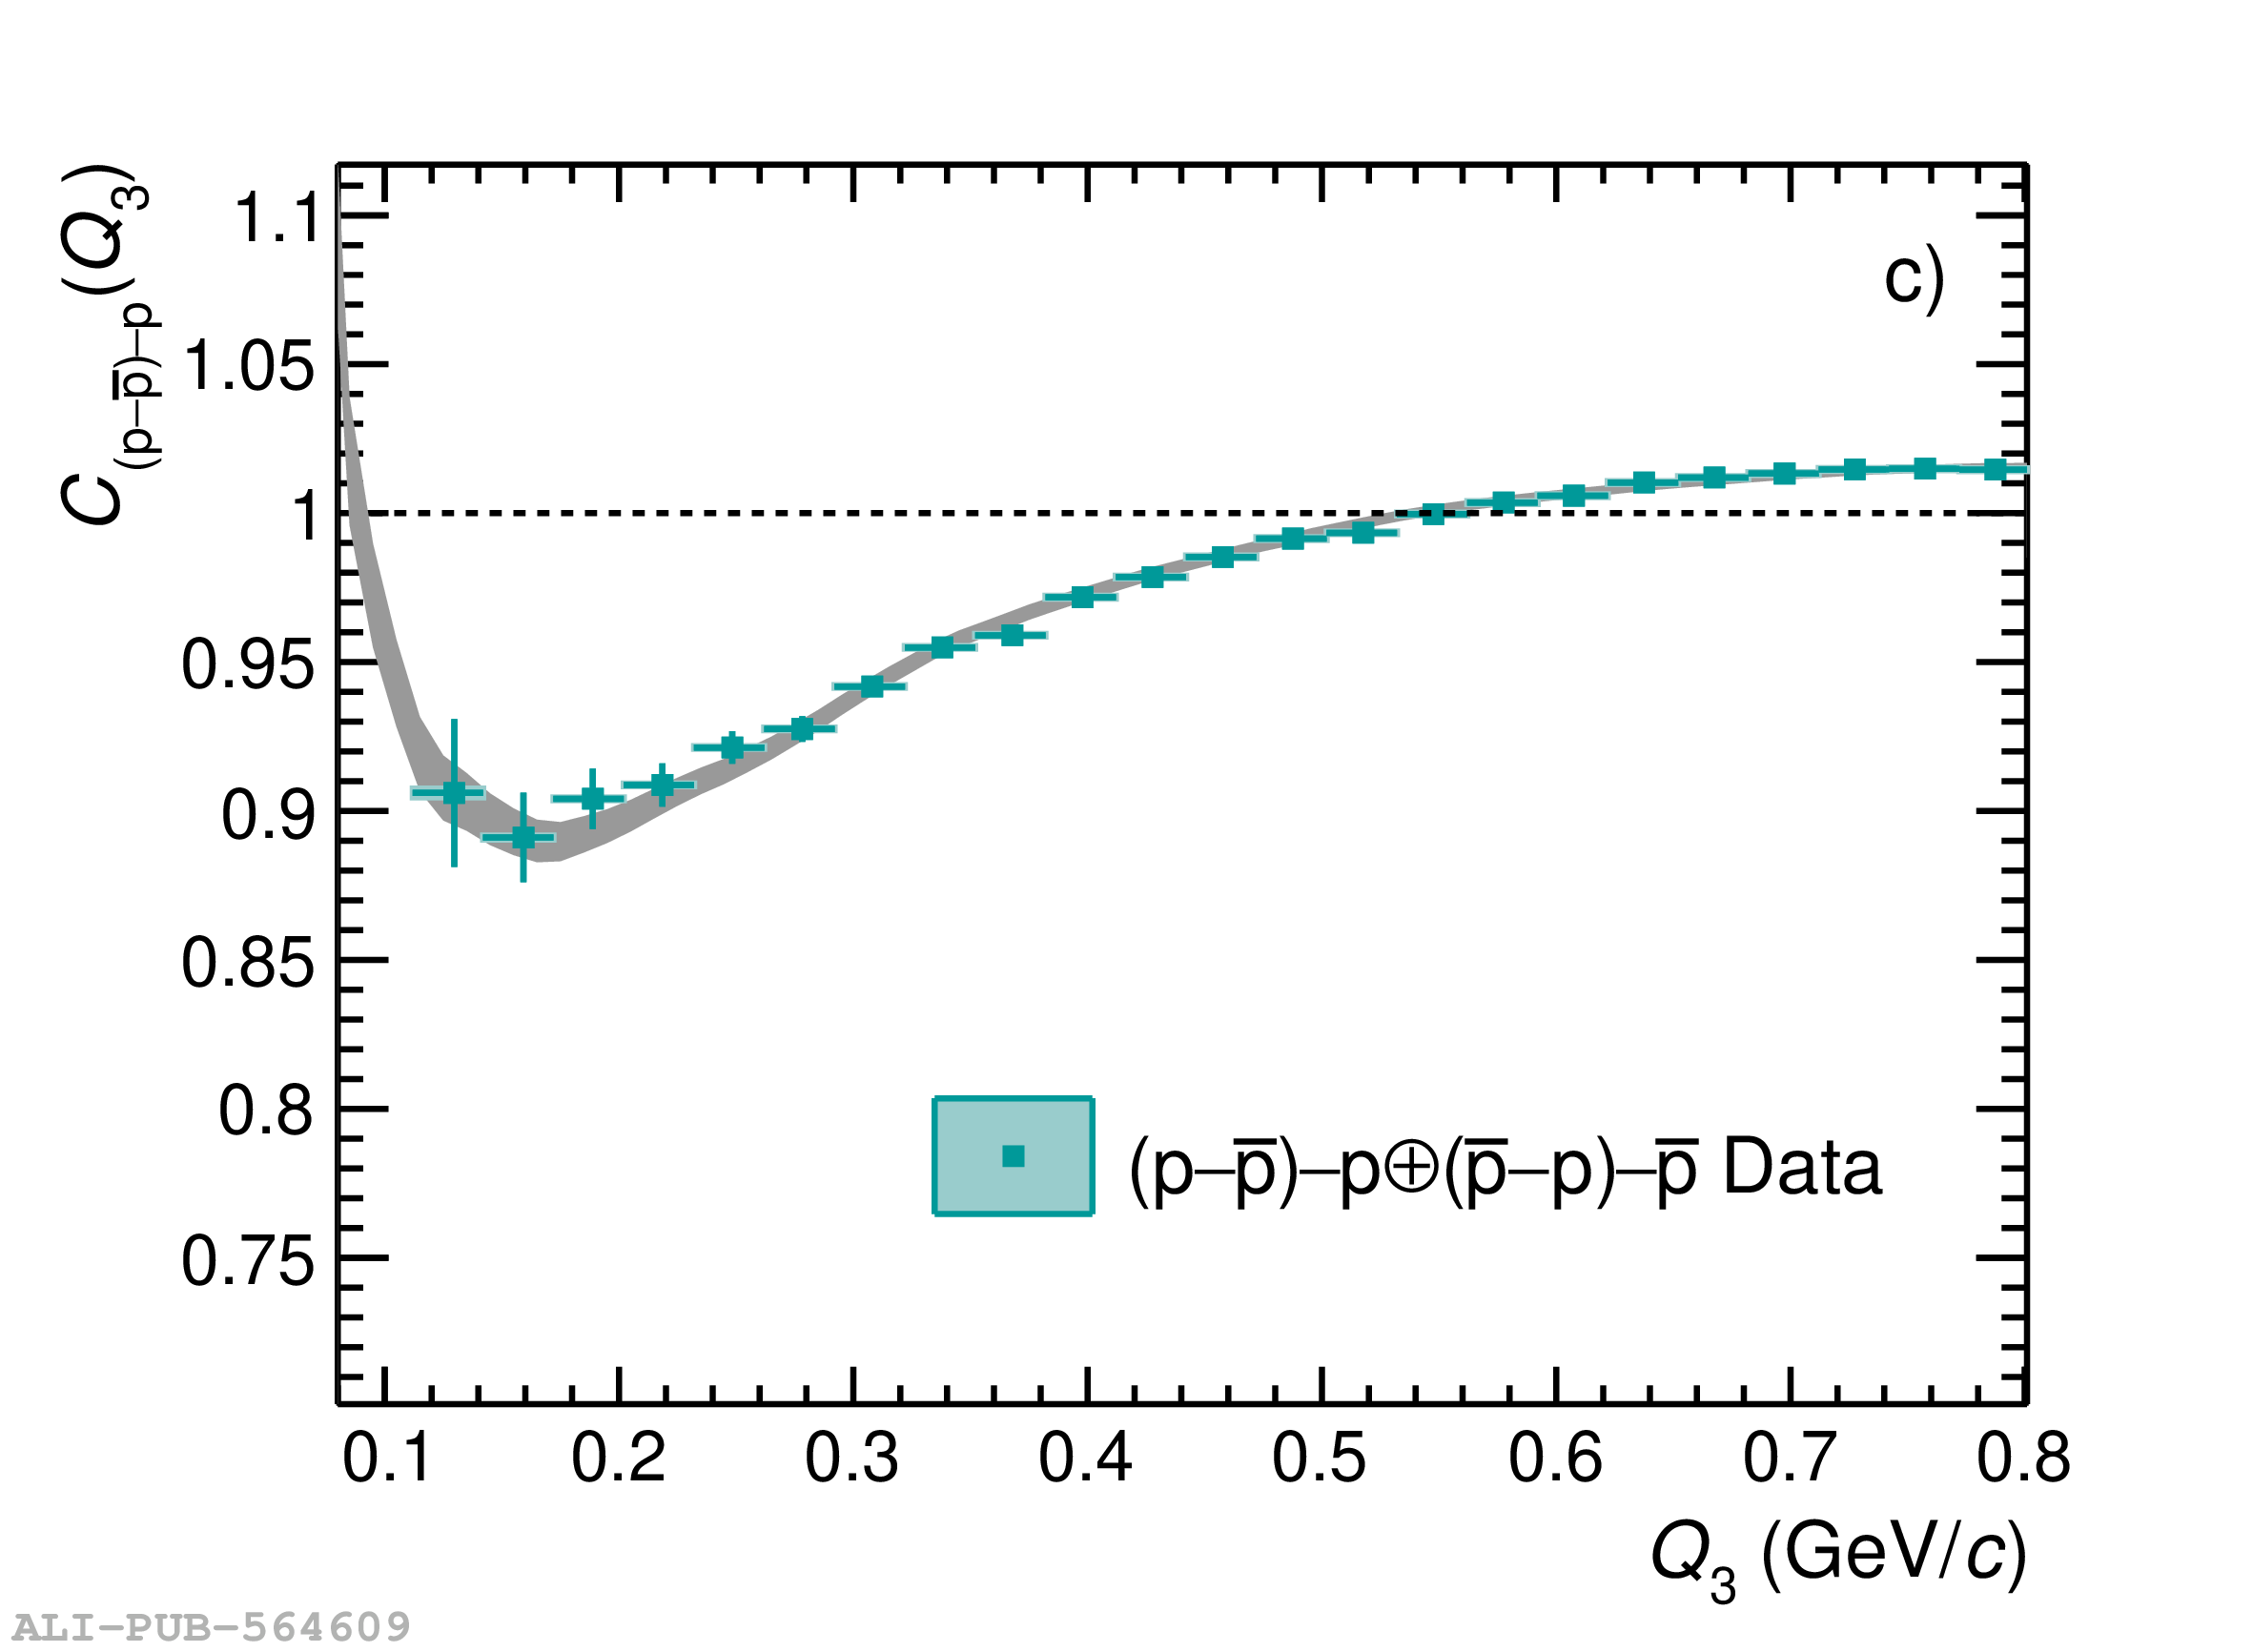 |