Comparison of the total two-particle contribution to the three-particle correlation functions obtained using the data-driven approach (green points) and the projector method (grey band). The resulting correlation functions are shown for p$-$p$-$p (left panel) and p$-$p$-\Lambda$ (right panel). The error bars and the boxes represent the statistical and systematic uncertainties, respectively. The grey band includes systematic and statistical uncertainties summed in quadrature. | 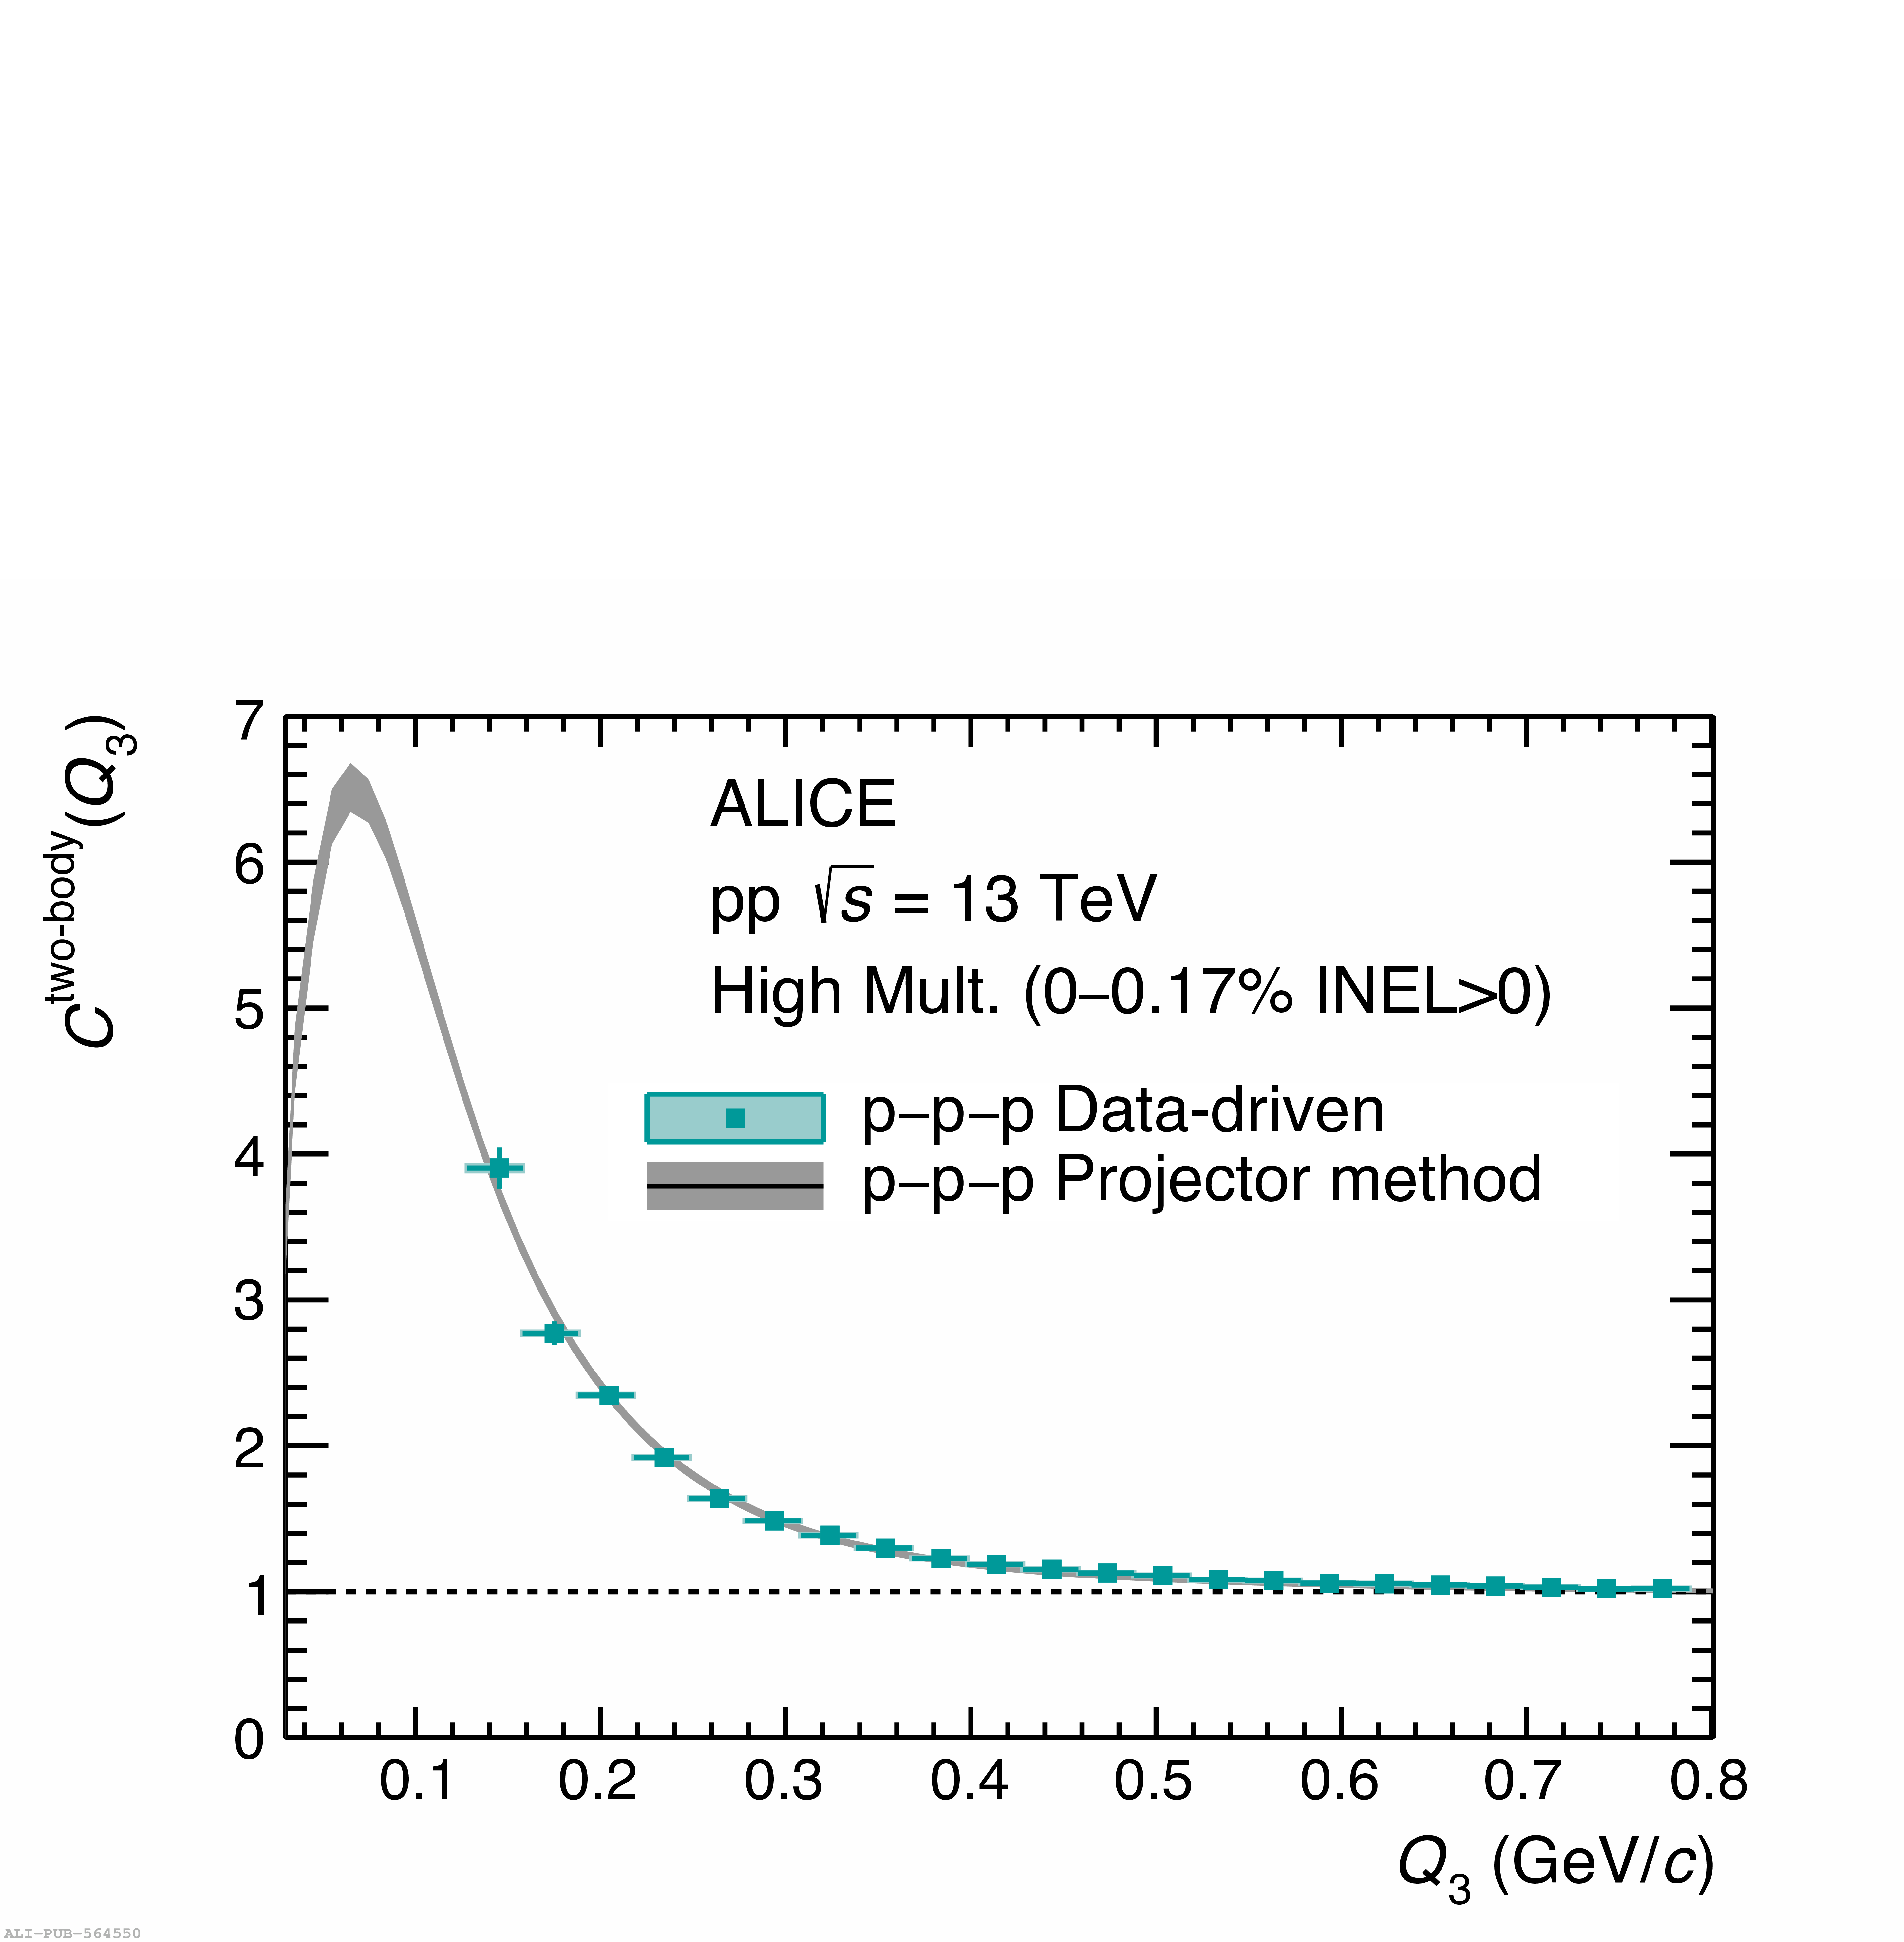 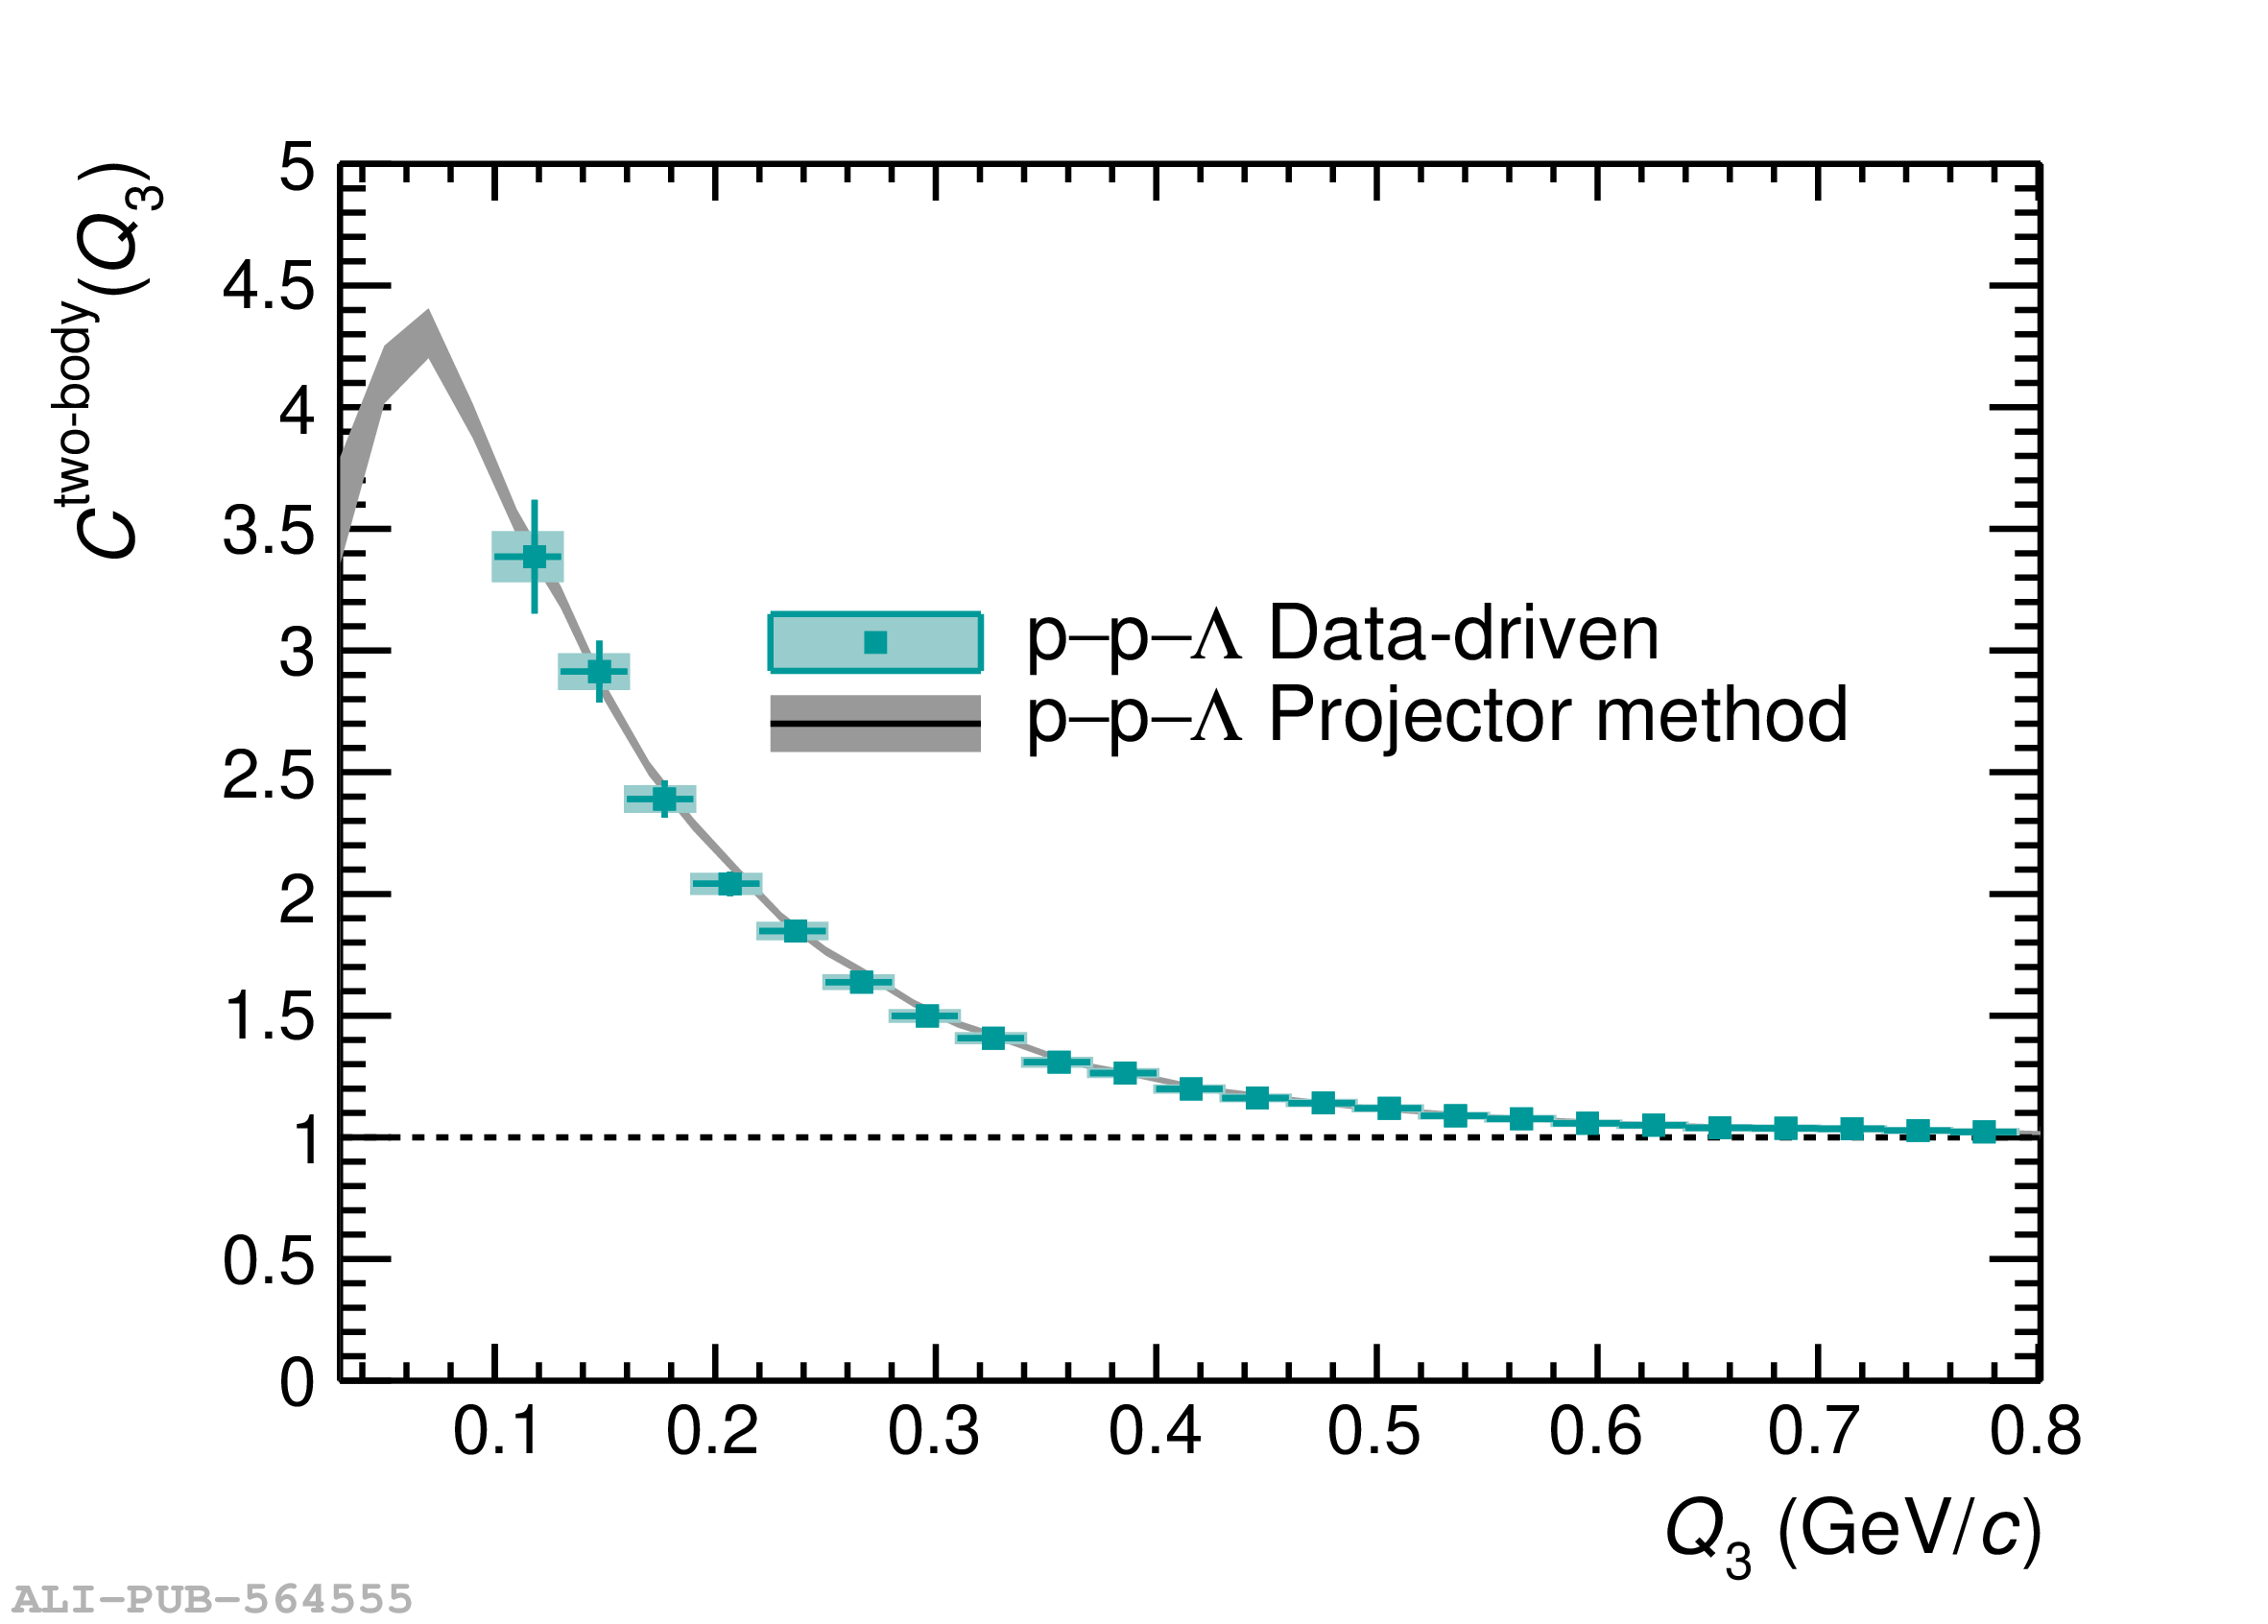 |