Measured p$-$p$-$p (left panel) and p$-$p$-\Lambda$ (right panel) three-particle correlation functions. The green points show the experimental results, the error bars and the boxes represent the statistical and systematic uncertainties, respectively. The grey bands represent the expectations for the lower-order two-particle correlations obtained using the projector method and the band width is obtained including systematic and statistical uncertainties summed in quadrature. | 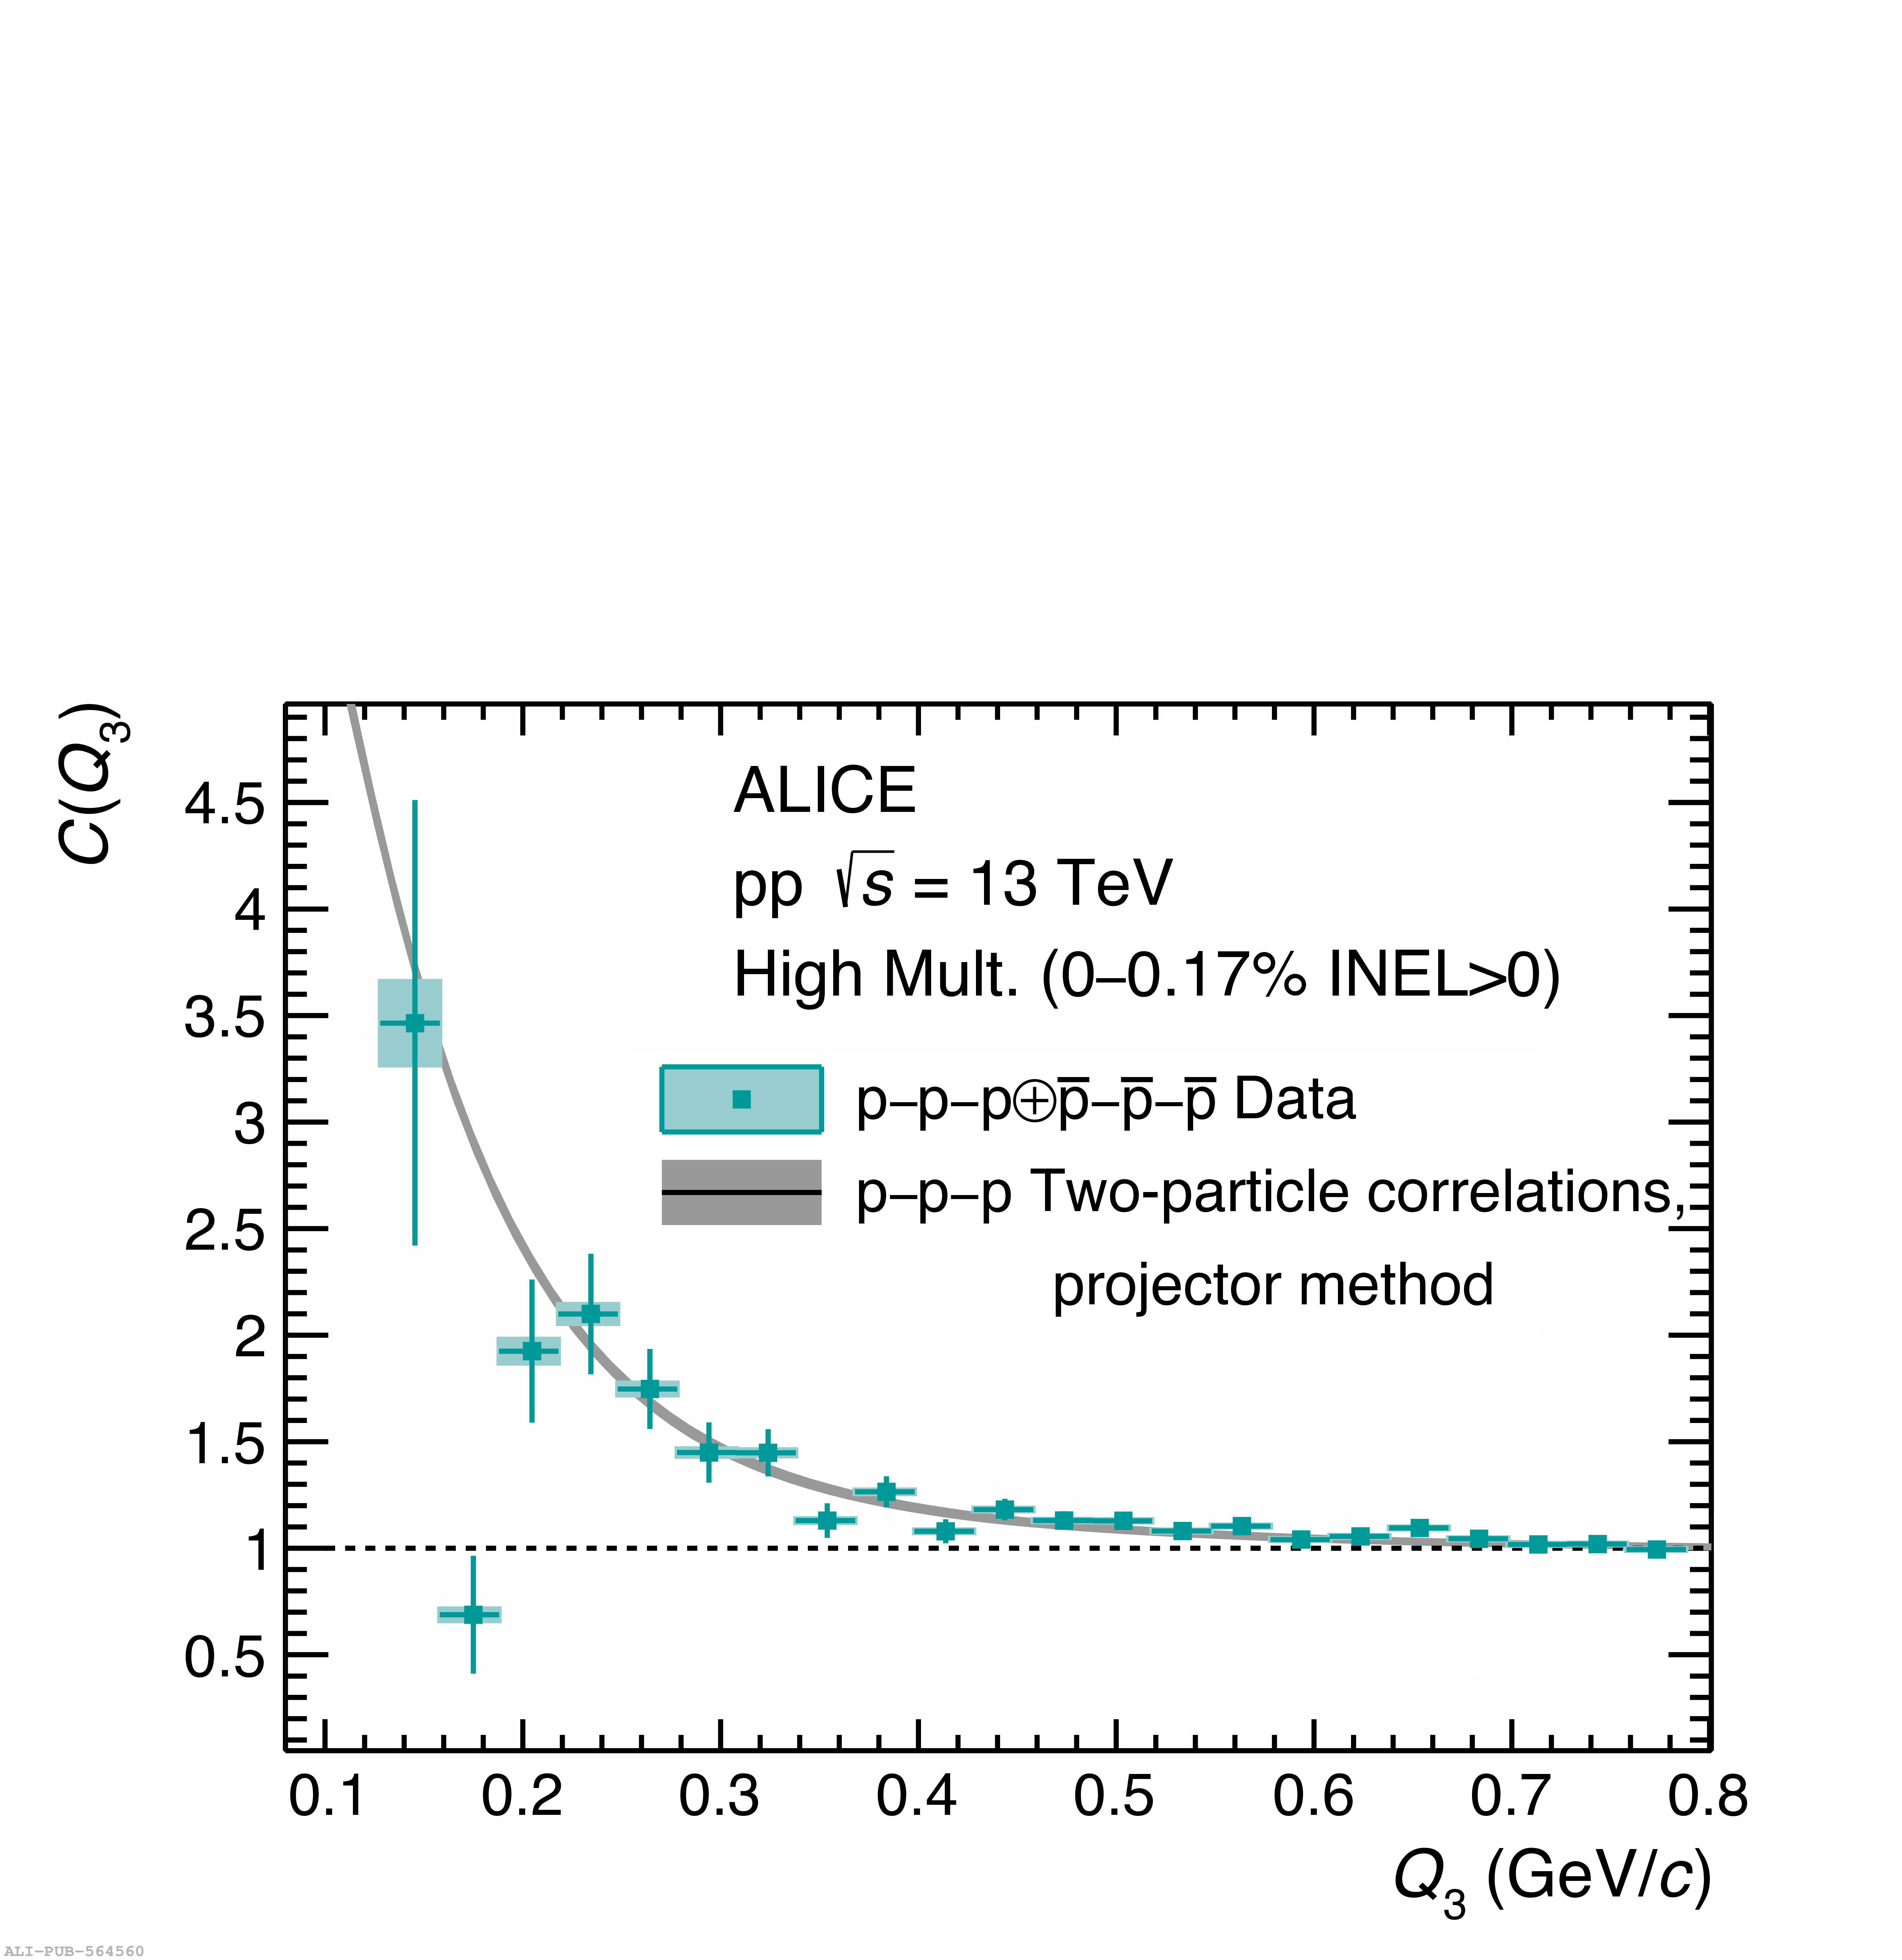  |