The measurement of the production of ${\rm f}_{0}(980)$ in inelastic pp collisions at $\sqrt{s} = 5.02$ TeV is presented. This is the first reported measurement of inclusive ${\rm f}_{0}(980)$ yield at LHC energies. The production is measured at midrapidity, $|y| <~ 0.5$, in a wide transverse momentum range, $0 <~ p_{\rm T} <~ 16$ GeV/$c$, by reconstructing the resonance in the ${\rm f}_{0}(980) \rightarrow \pi^{+}\pi^{-}$ hadronic decay channel using the ALICE detector. The $p_{\rm T}$-differential yields are compared to those of pions, protons and $\phi$ mesons as well as to predictions from the HERWIG 7.2 QCD-inspired Monte Carlo event generator and calculations from a coalescence model that uses the AMPT model as an input. The ratio of the $p_{\rm T}$-integrated yield of ${\rm f}_{0}(980)$ relative to pions is compared to measurements in ${\rm e}^{+}{\rm e}^{-}$ and pp collisions at lower energies and predictions from statistical hadronisation models and HERWIG 7.2. A mild collision energy dependence of the ${\rm f}_{0}(980)$ to pion production is observed in pp collisions from SPS to LHC energies. All considered models underpredict the $p_{\rm T}$-integrated $2{\rm f}_{0}(980)/(\pi^{+}+\pi^{-})$ ratio. The prediction from the canonical statistical hadronisation model assuming a zero total strangeness content of ${\rm f}_{0}(980)$ is consistent with the data within 1.9$\sigma$ and is the closest to the data. The results provide an essential reference for future measurements of the particle yield and nuclear modification in p$-$Pb and Pb$-$Pb collisions, which have been proposed to be instrumental to probe the elusive nature and quark composition of the ${\rm f}_{0}(980)$ scalar meson.
Phys. Lett. B 846 (2023) 137644
HEP Data
e-Print: arXiv:2206.06216 | PDF | inSPIRE
CERN-EP-2022-126
Figure group
Figure 1
Left (right) plot shows the invariant mass distribution of $\pi^{+}\pi^{-}$ pairs after like-sign background subtraction in low (high) transverse-momentum interval in pp collisions at $\sqrt{s}$ = 5.02 TeV in $\vert y\vert < 0.5$. Solid blue curves represent fits with the function shown in Eq. (1) and a residual background shown in Eq. (3). Solid red curve represents ${\rm f_0(980)}$ signal while other dashed curves represent the background contributions from $\rho{\rm(770)}$, ${\rm f_2(1270)}$ and residual background. | 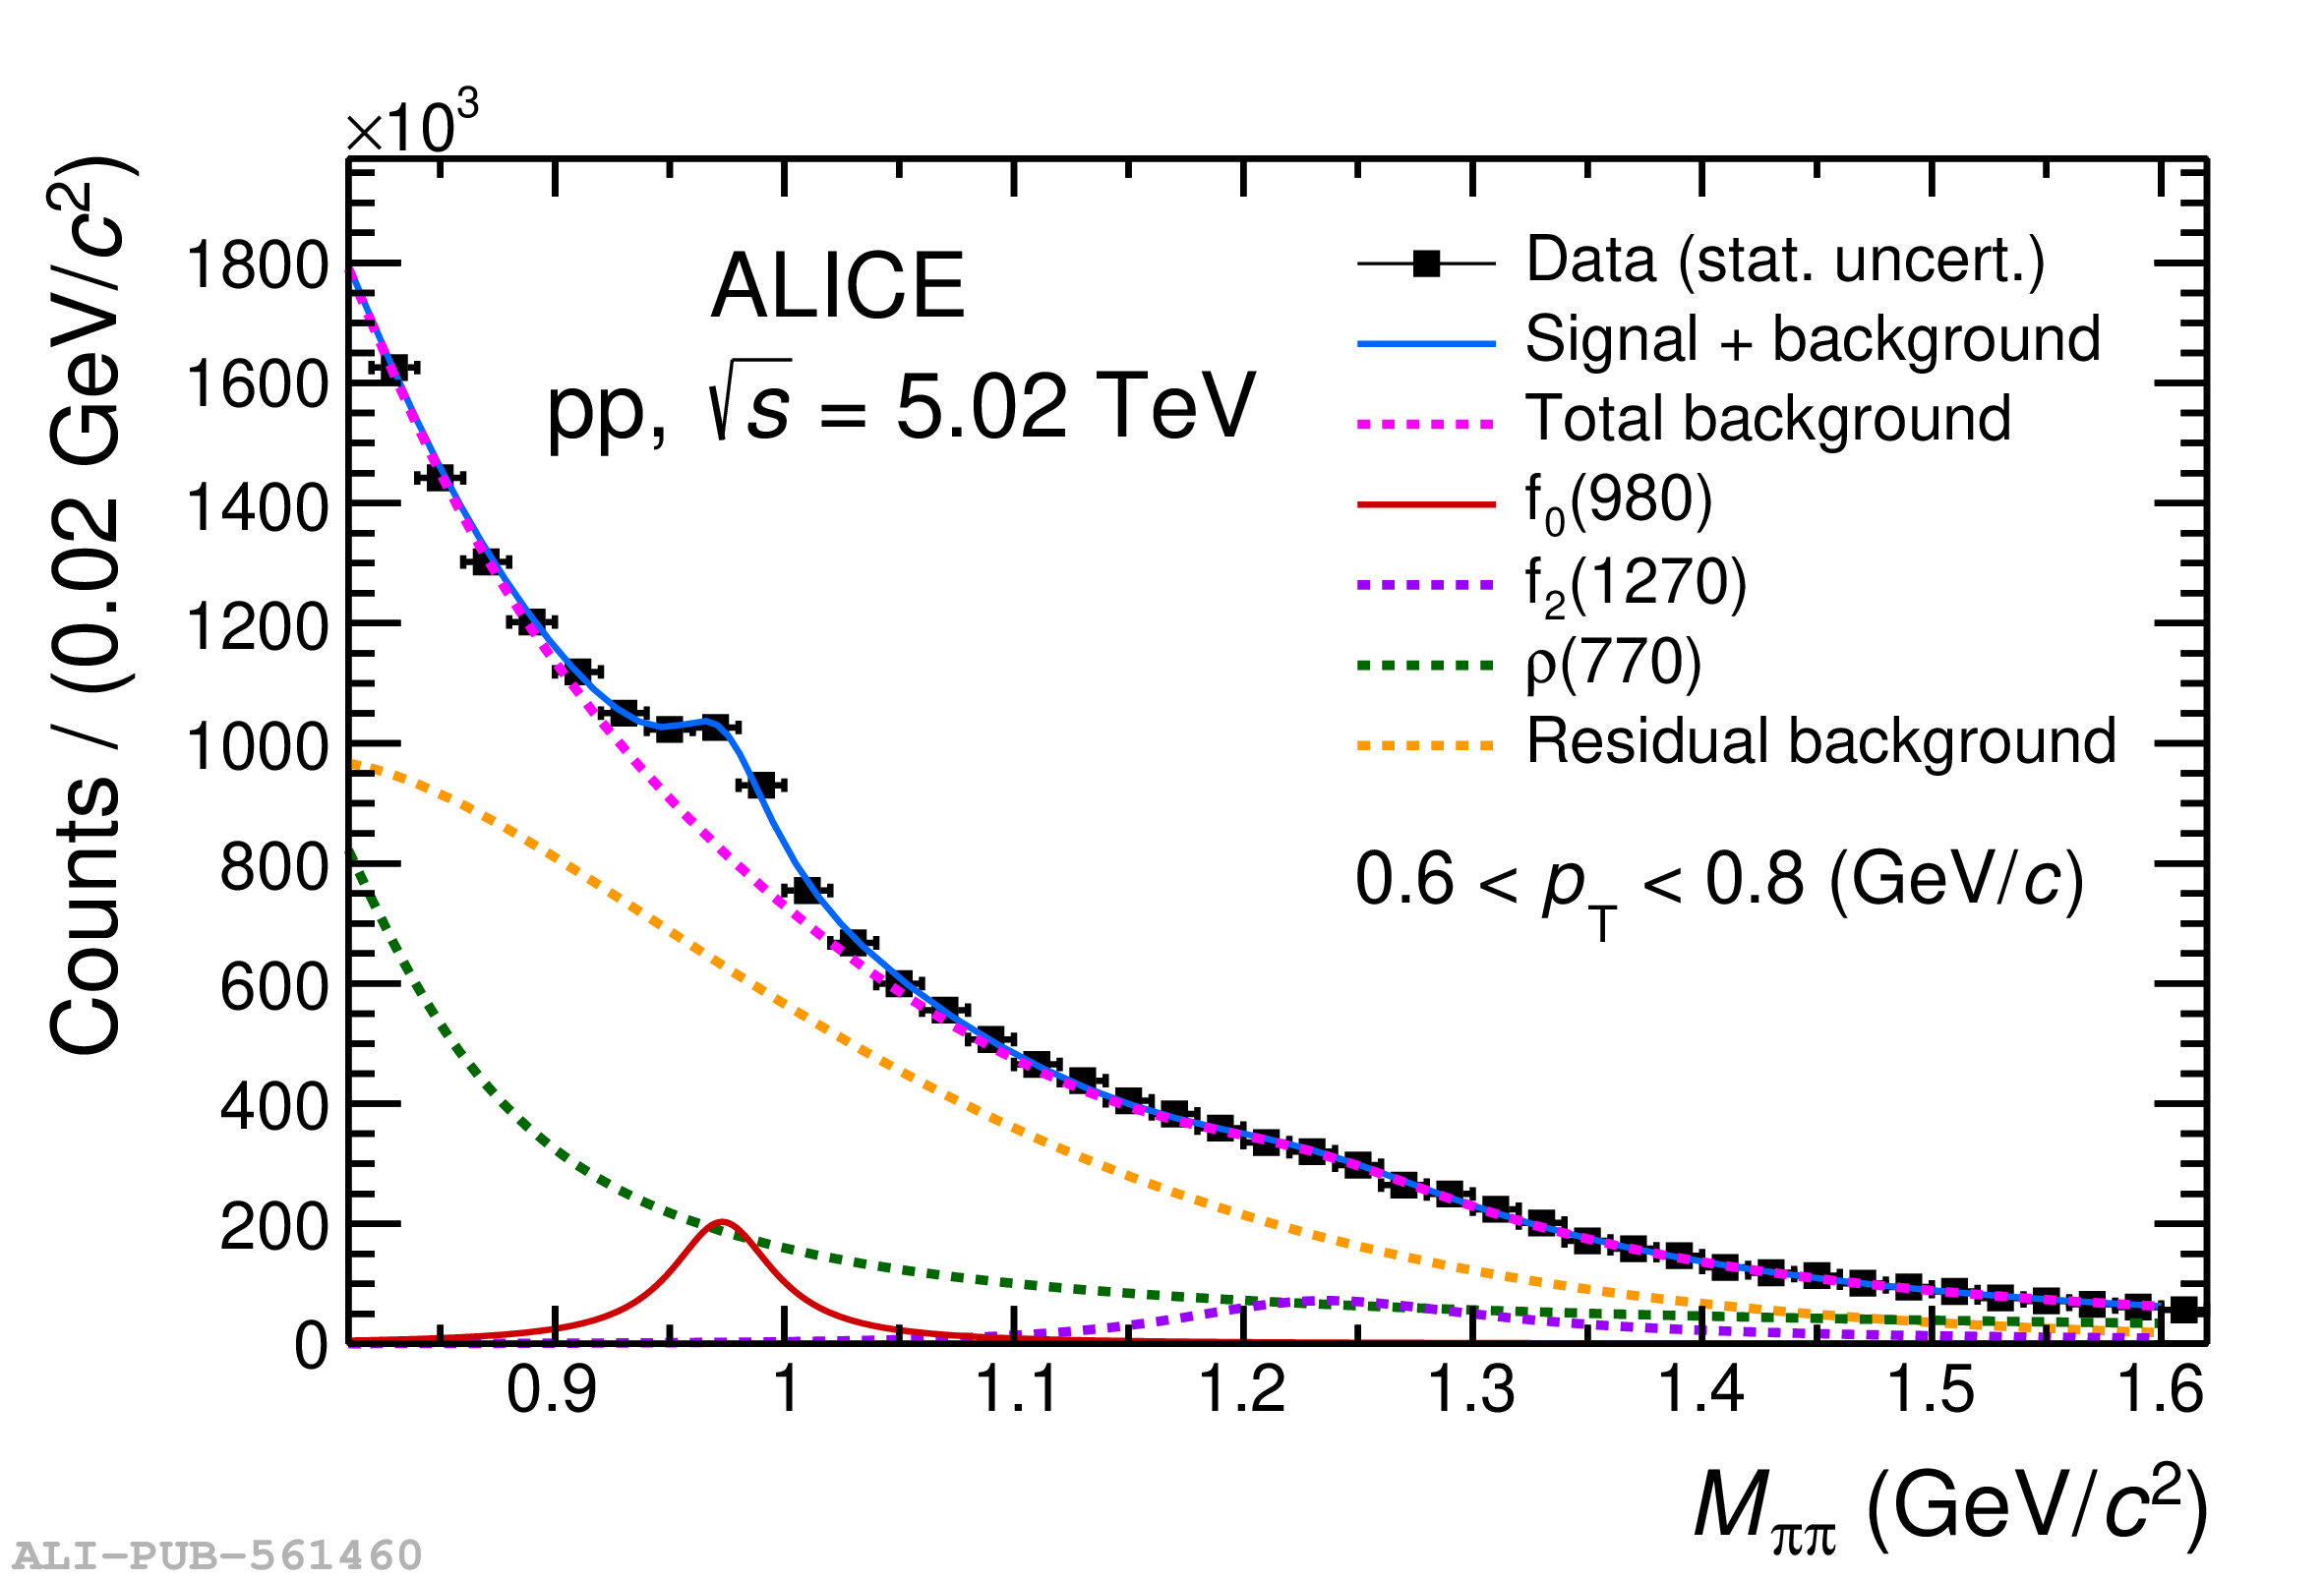 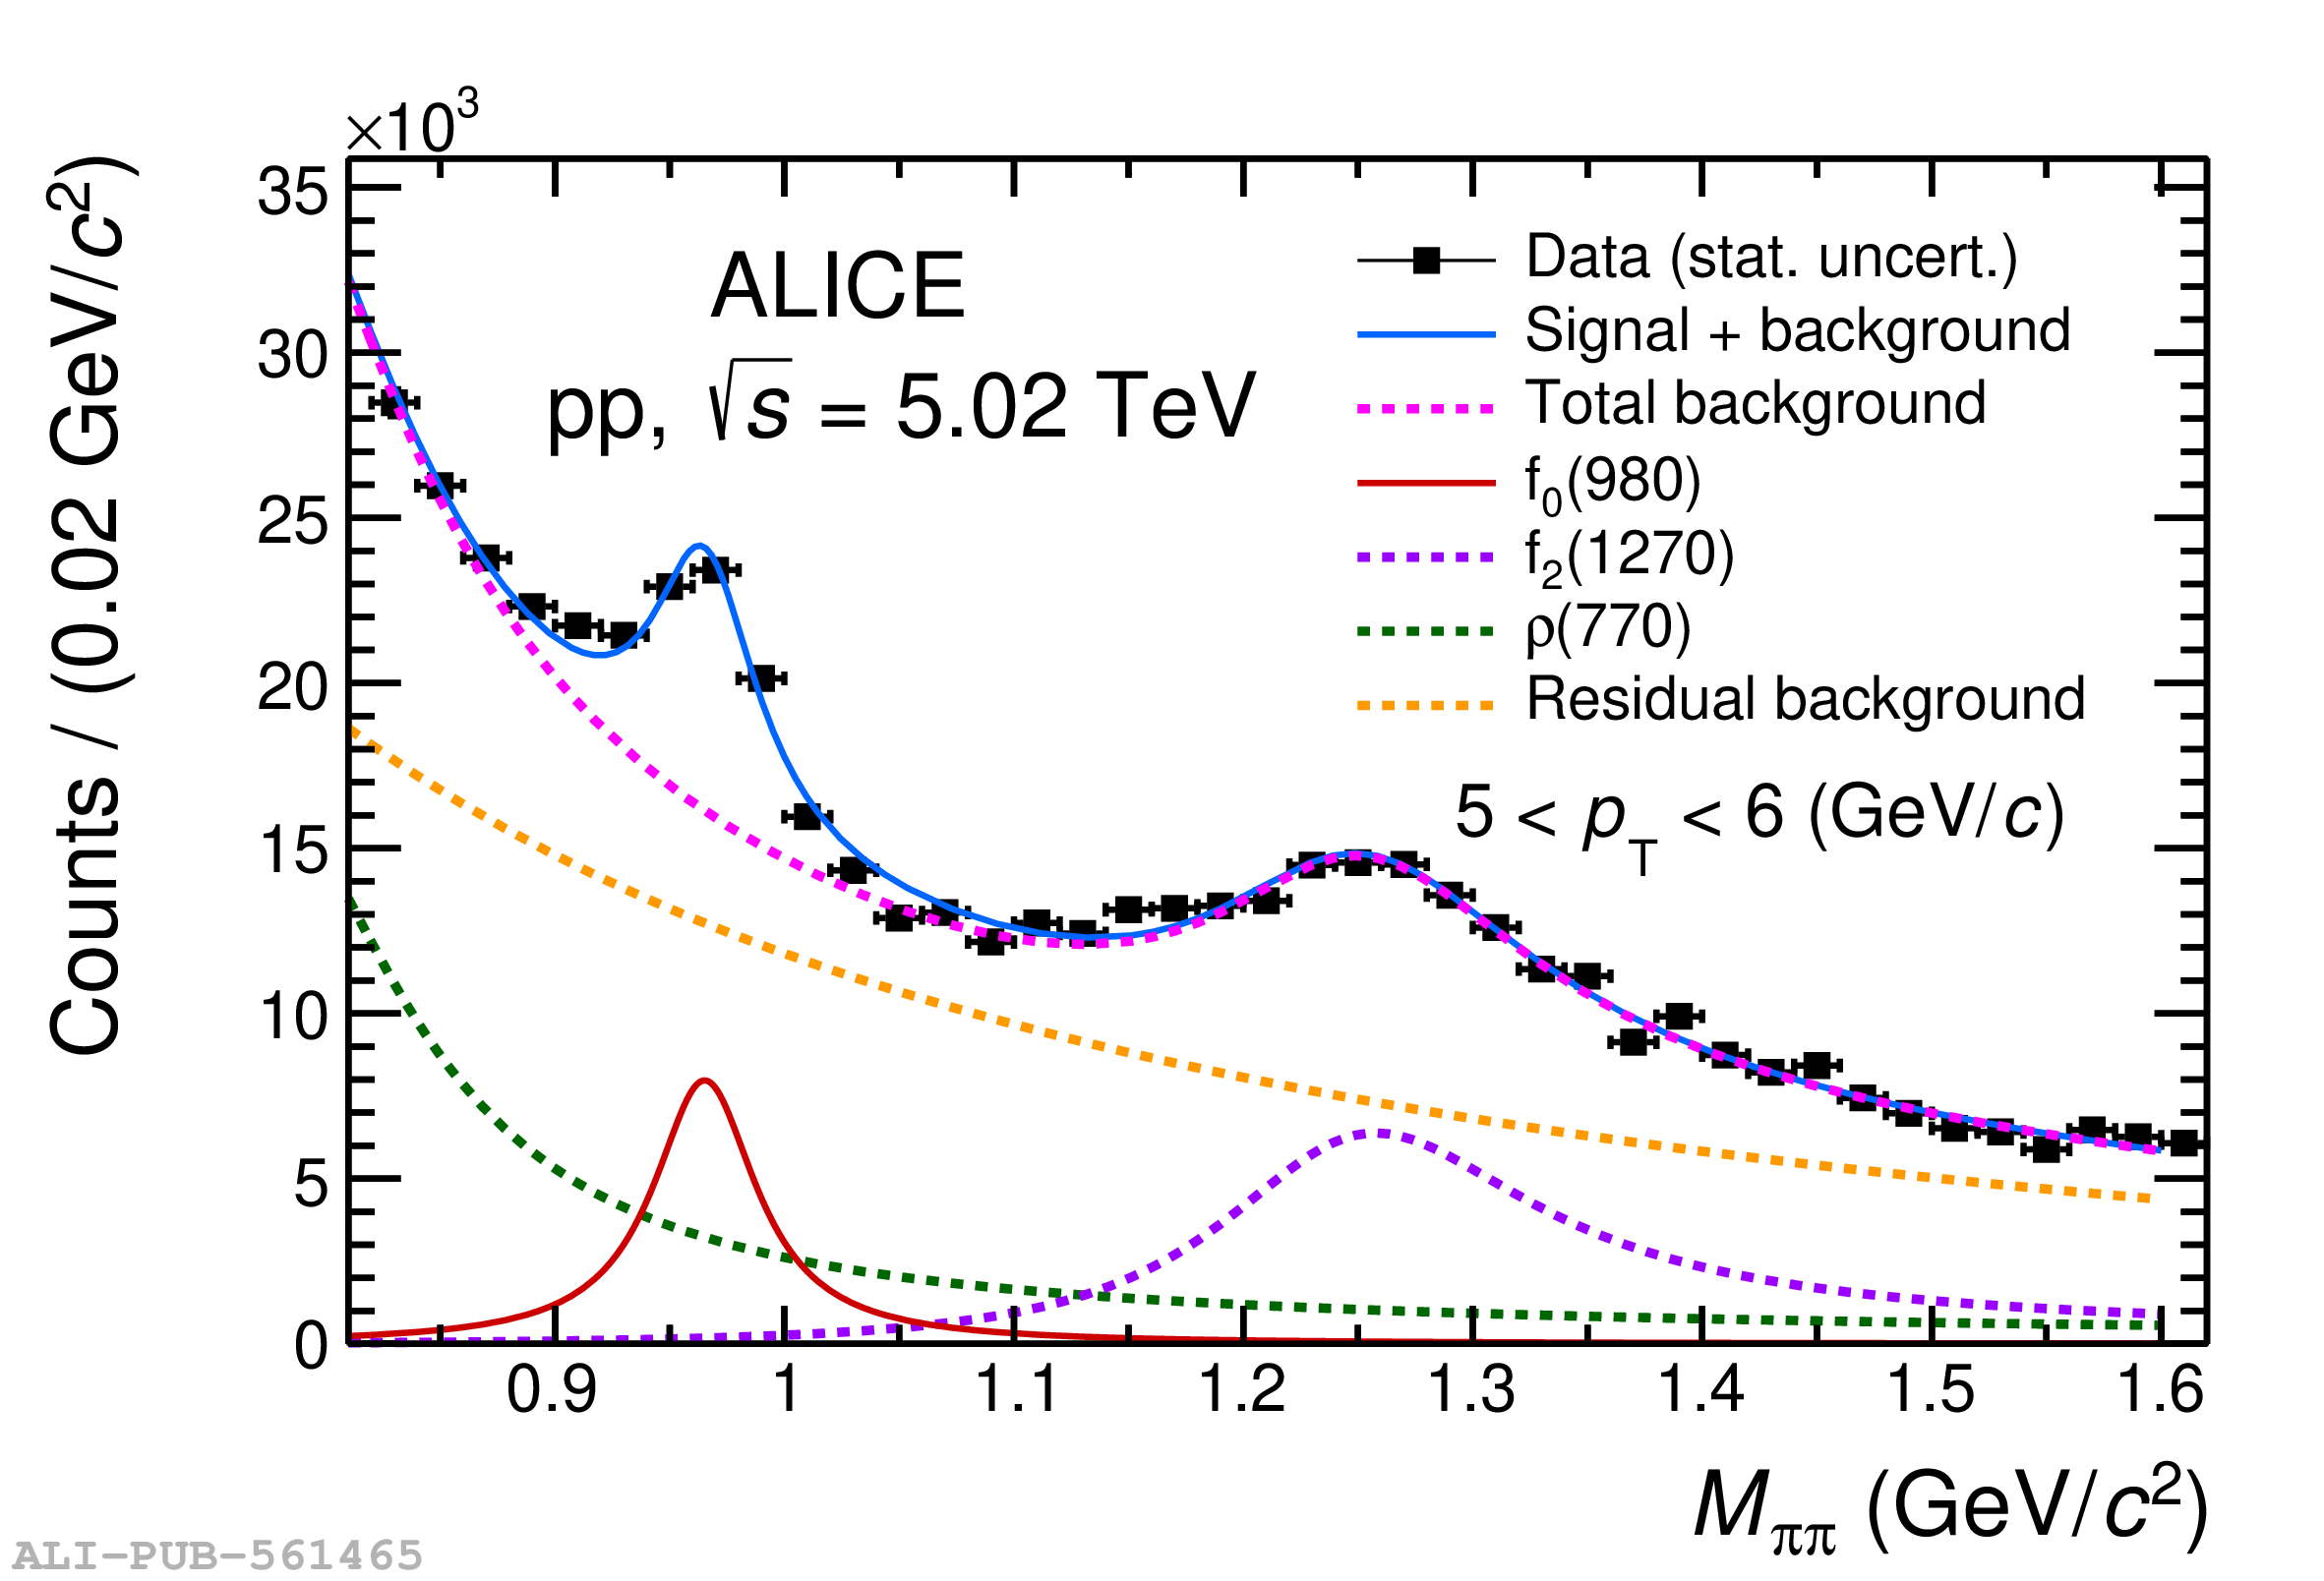 |
Figure 2
The $p_{\rm T}$-differential yield of ${\rm f_0(980)}$ in pp collisions at $\sqrt{s}$ = 5.02 TeV is compared with predictions from the HERWIG 7.2 event generator and with a coalescence calculation based on the AMPT model. The statistical and systematic uncertainties on data (full black markers) are shown as bars and boxes, respectively. The middle and bottom panels show the model to data ratios. The grey boxes at unity represent the sum in quadrature of the statistical and systematic uncertainty on the data. The ratios of $\rm{u\bar{u}s\bar{s}}$ tetraquark and $\rm{K^+K^-}$ molecule configurations from AMPT model predictions to data are multiplied by 100 to improve visibility. In all three panels, the uncertainties associated with the models are statistical ones. | 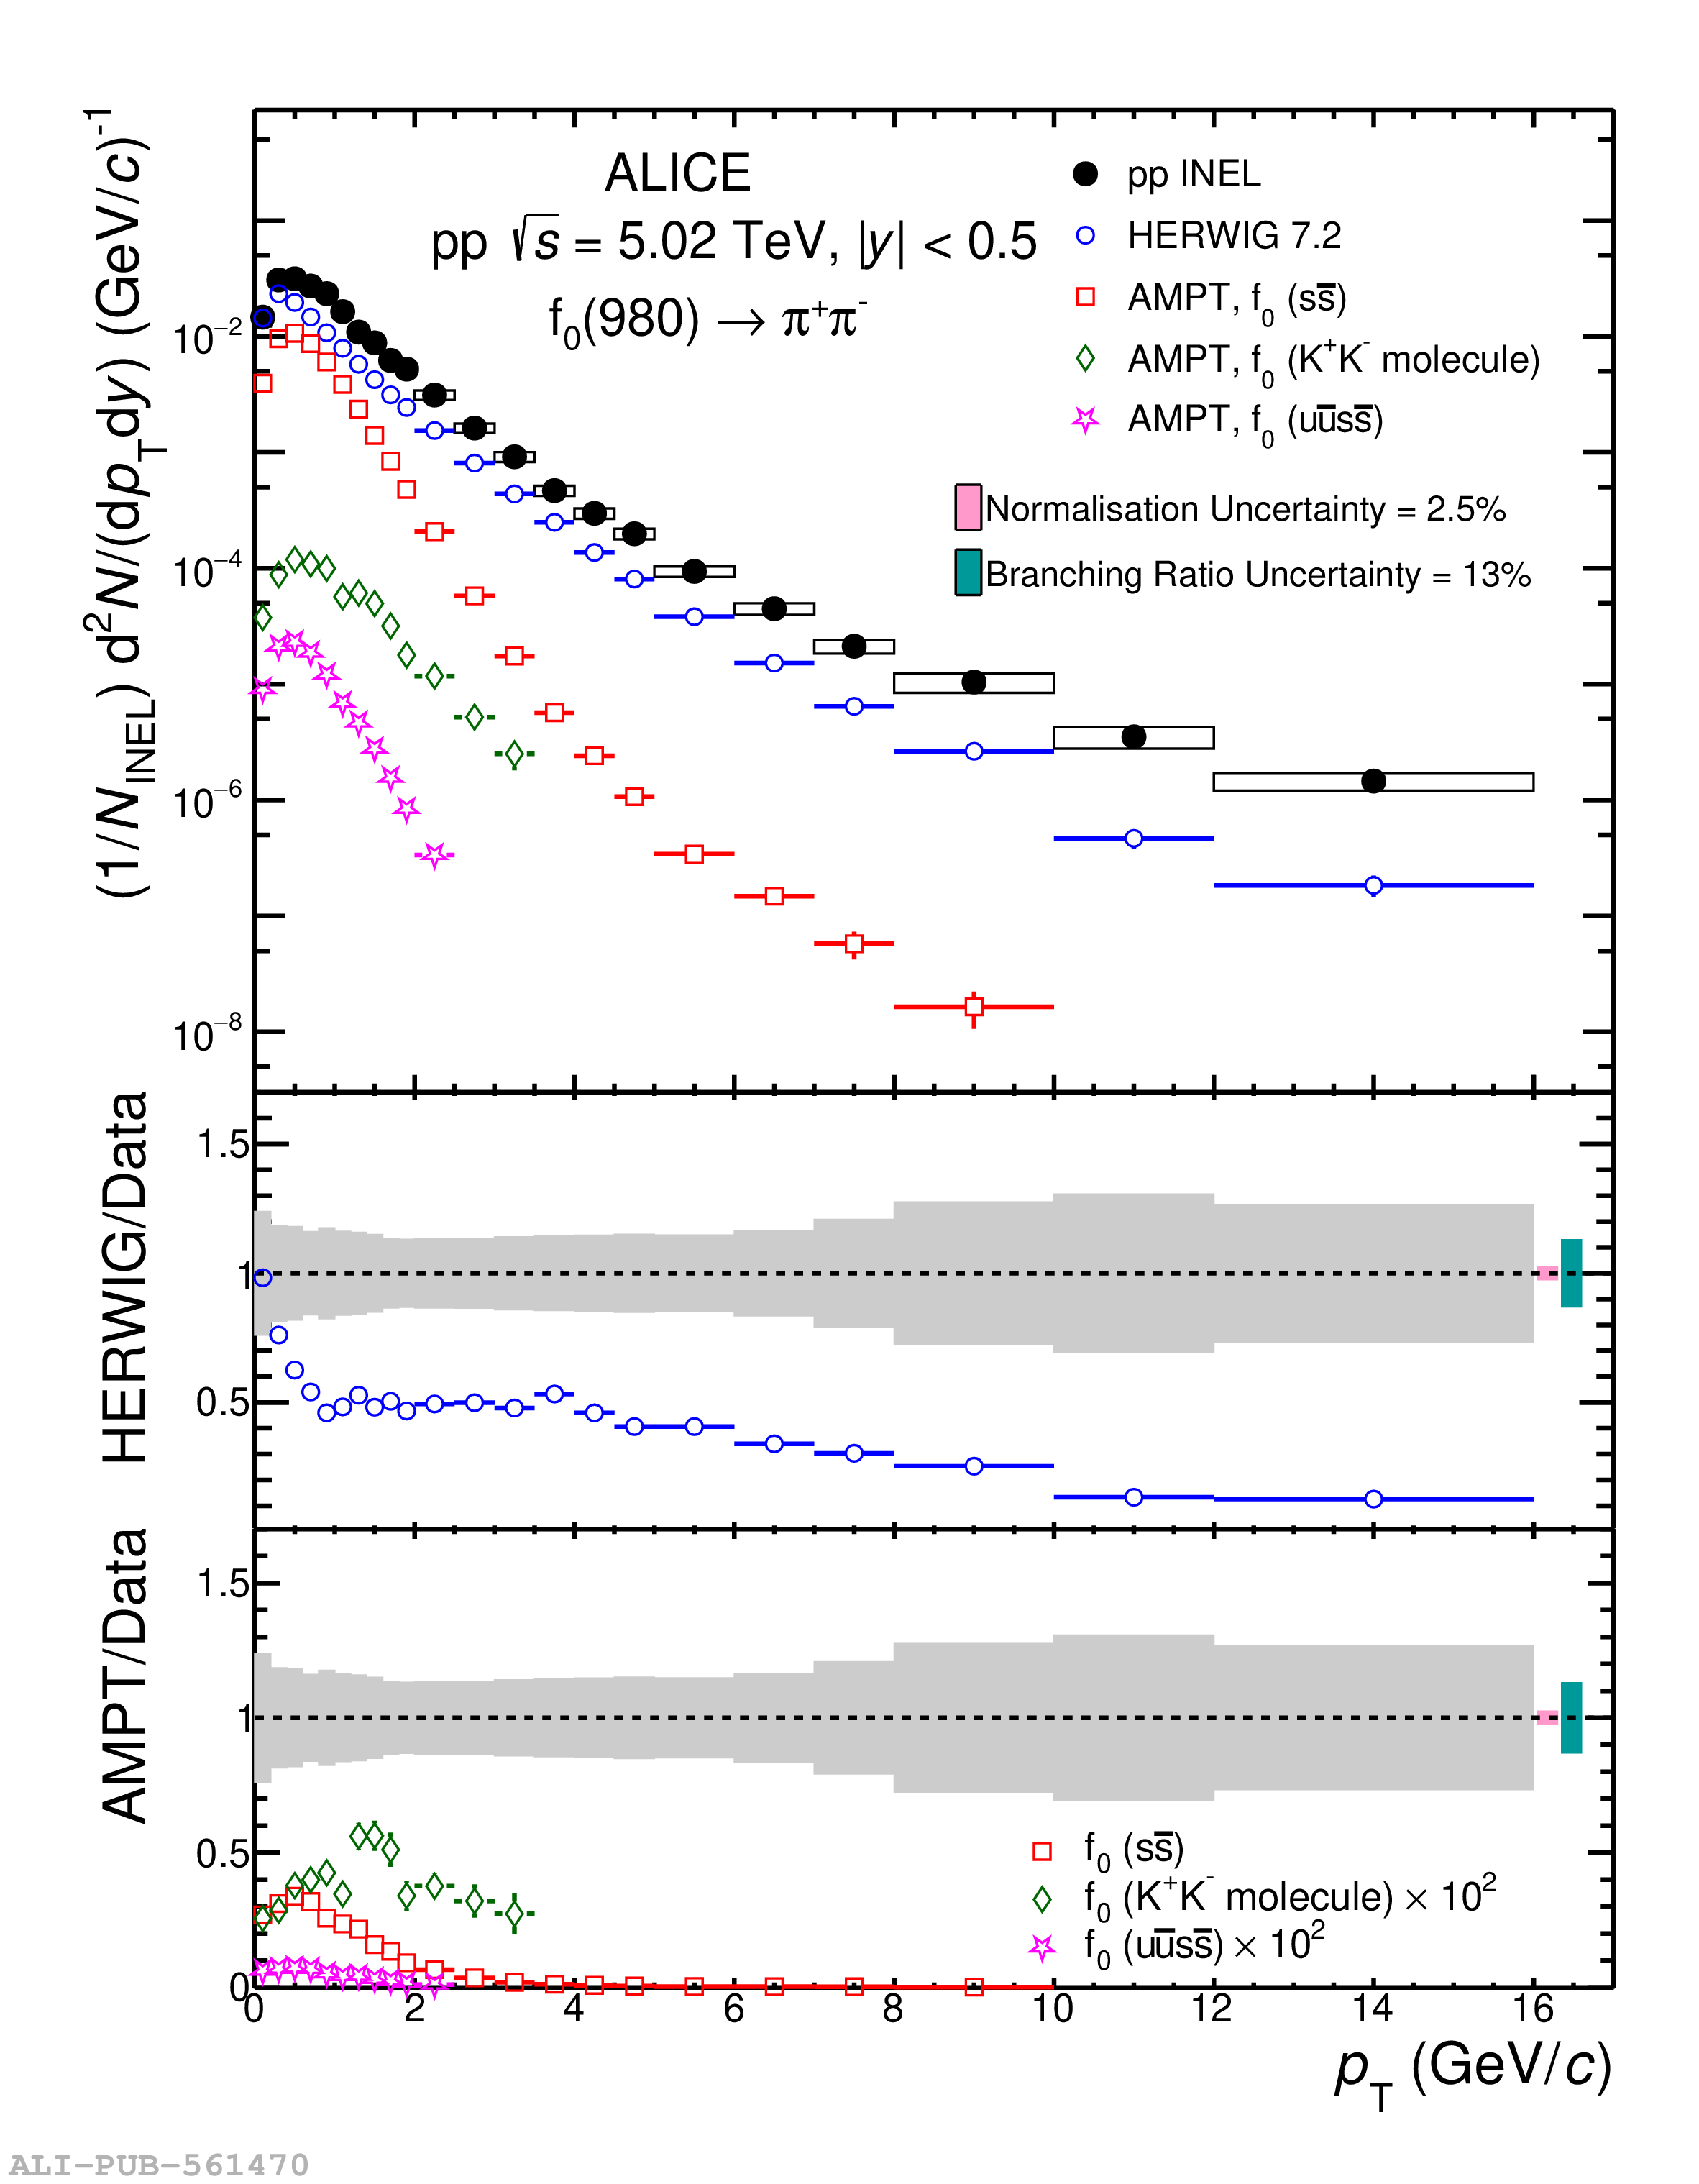 |
Figure 3
(Upper panels) Particle yield ratios of ${\rm f_0(980)}$ to $\pi^{+}+\pi^{-}$ (left panel), $\rm{p}+\overline{\rm{p}}$ (middle panel), and $\phi$ (right panel) measured in inelastic pp collisions at $\sqrt{s}=$ 5.02 TeV as a function of $p_{\mathrm{T}}$. Data are compared to HERWIG 7.2 model predictions. The statistical and systematic uncertainties are shown as bars and boxes, respectively (Lower panels) Ratio of measured particle ratios to the HERWIG model calculations (dashed histogram). The grey boxes at unity represent the sum in quadrature of the statistical and systematic uncertainty on the data. In the right panel, the ratio in the region for $\pt<0.8$ GeV/$c$ is off-scale. The relative uncertainty of 13% due to the branching ratio correction is shown as a green box with an arbitrary horizontal width for visibility. | 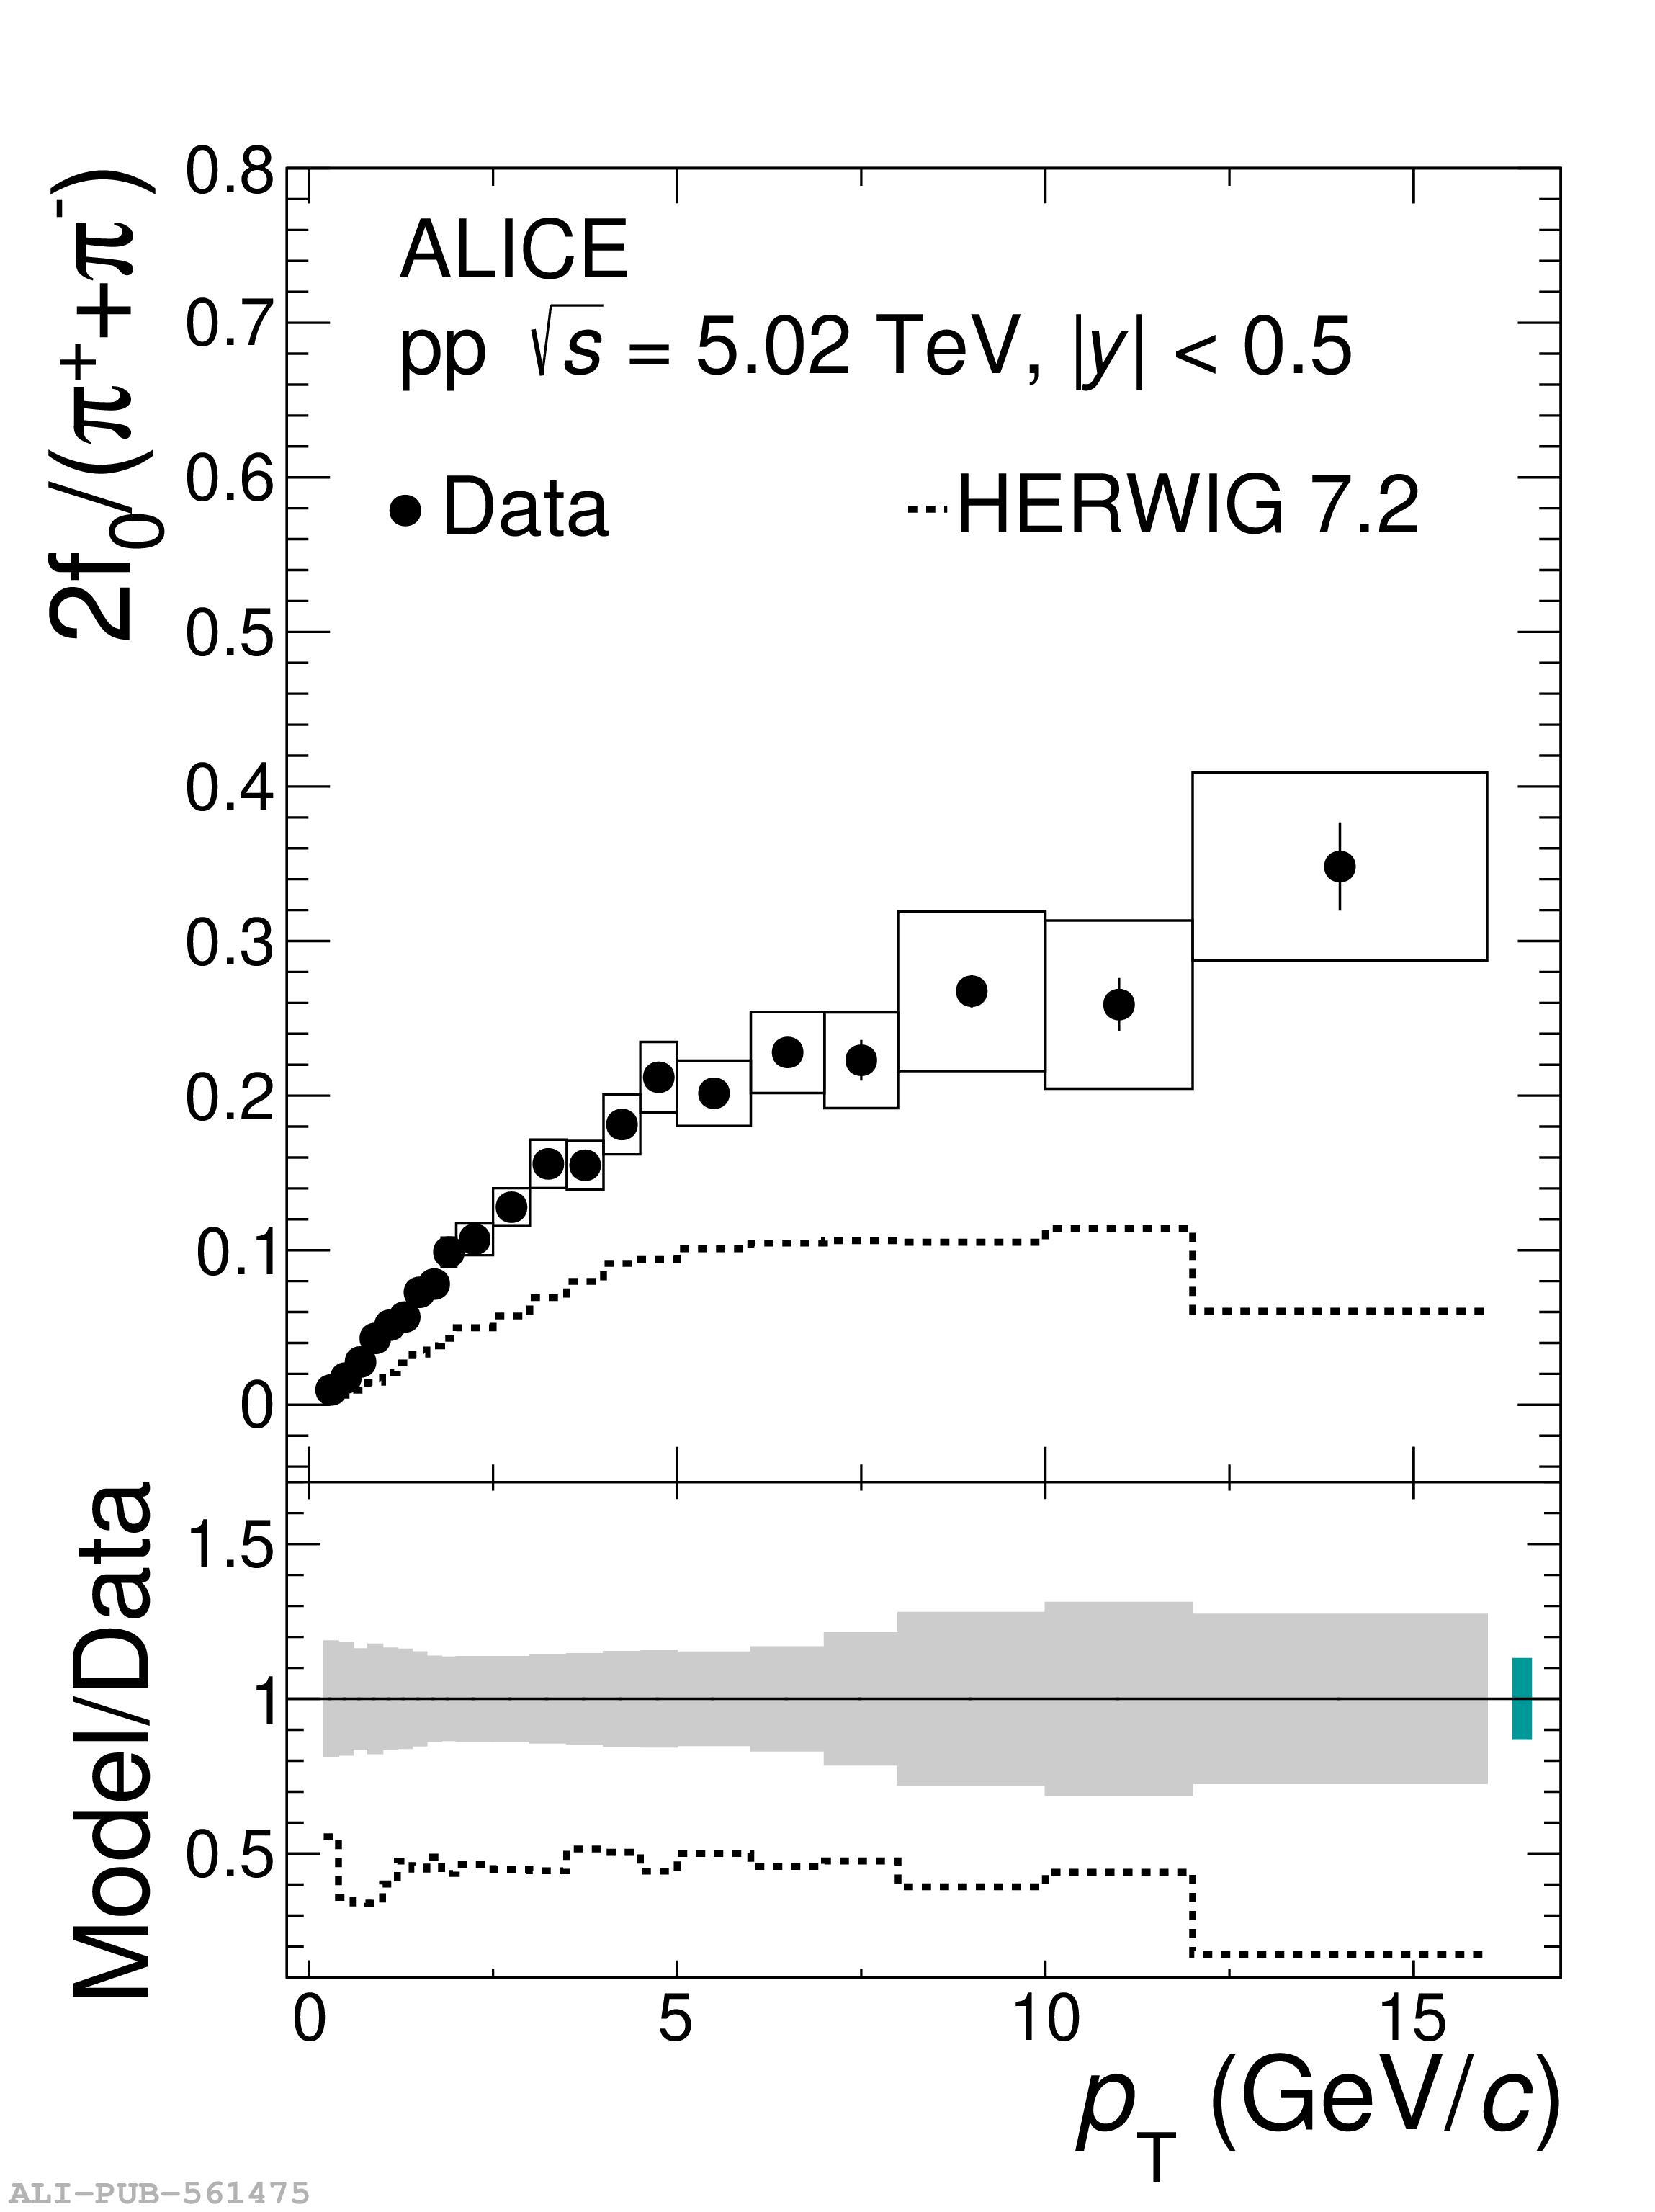 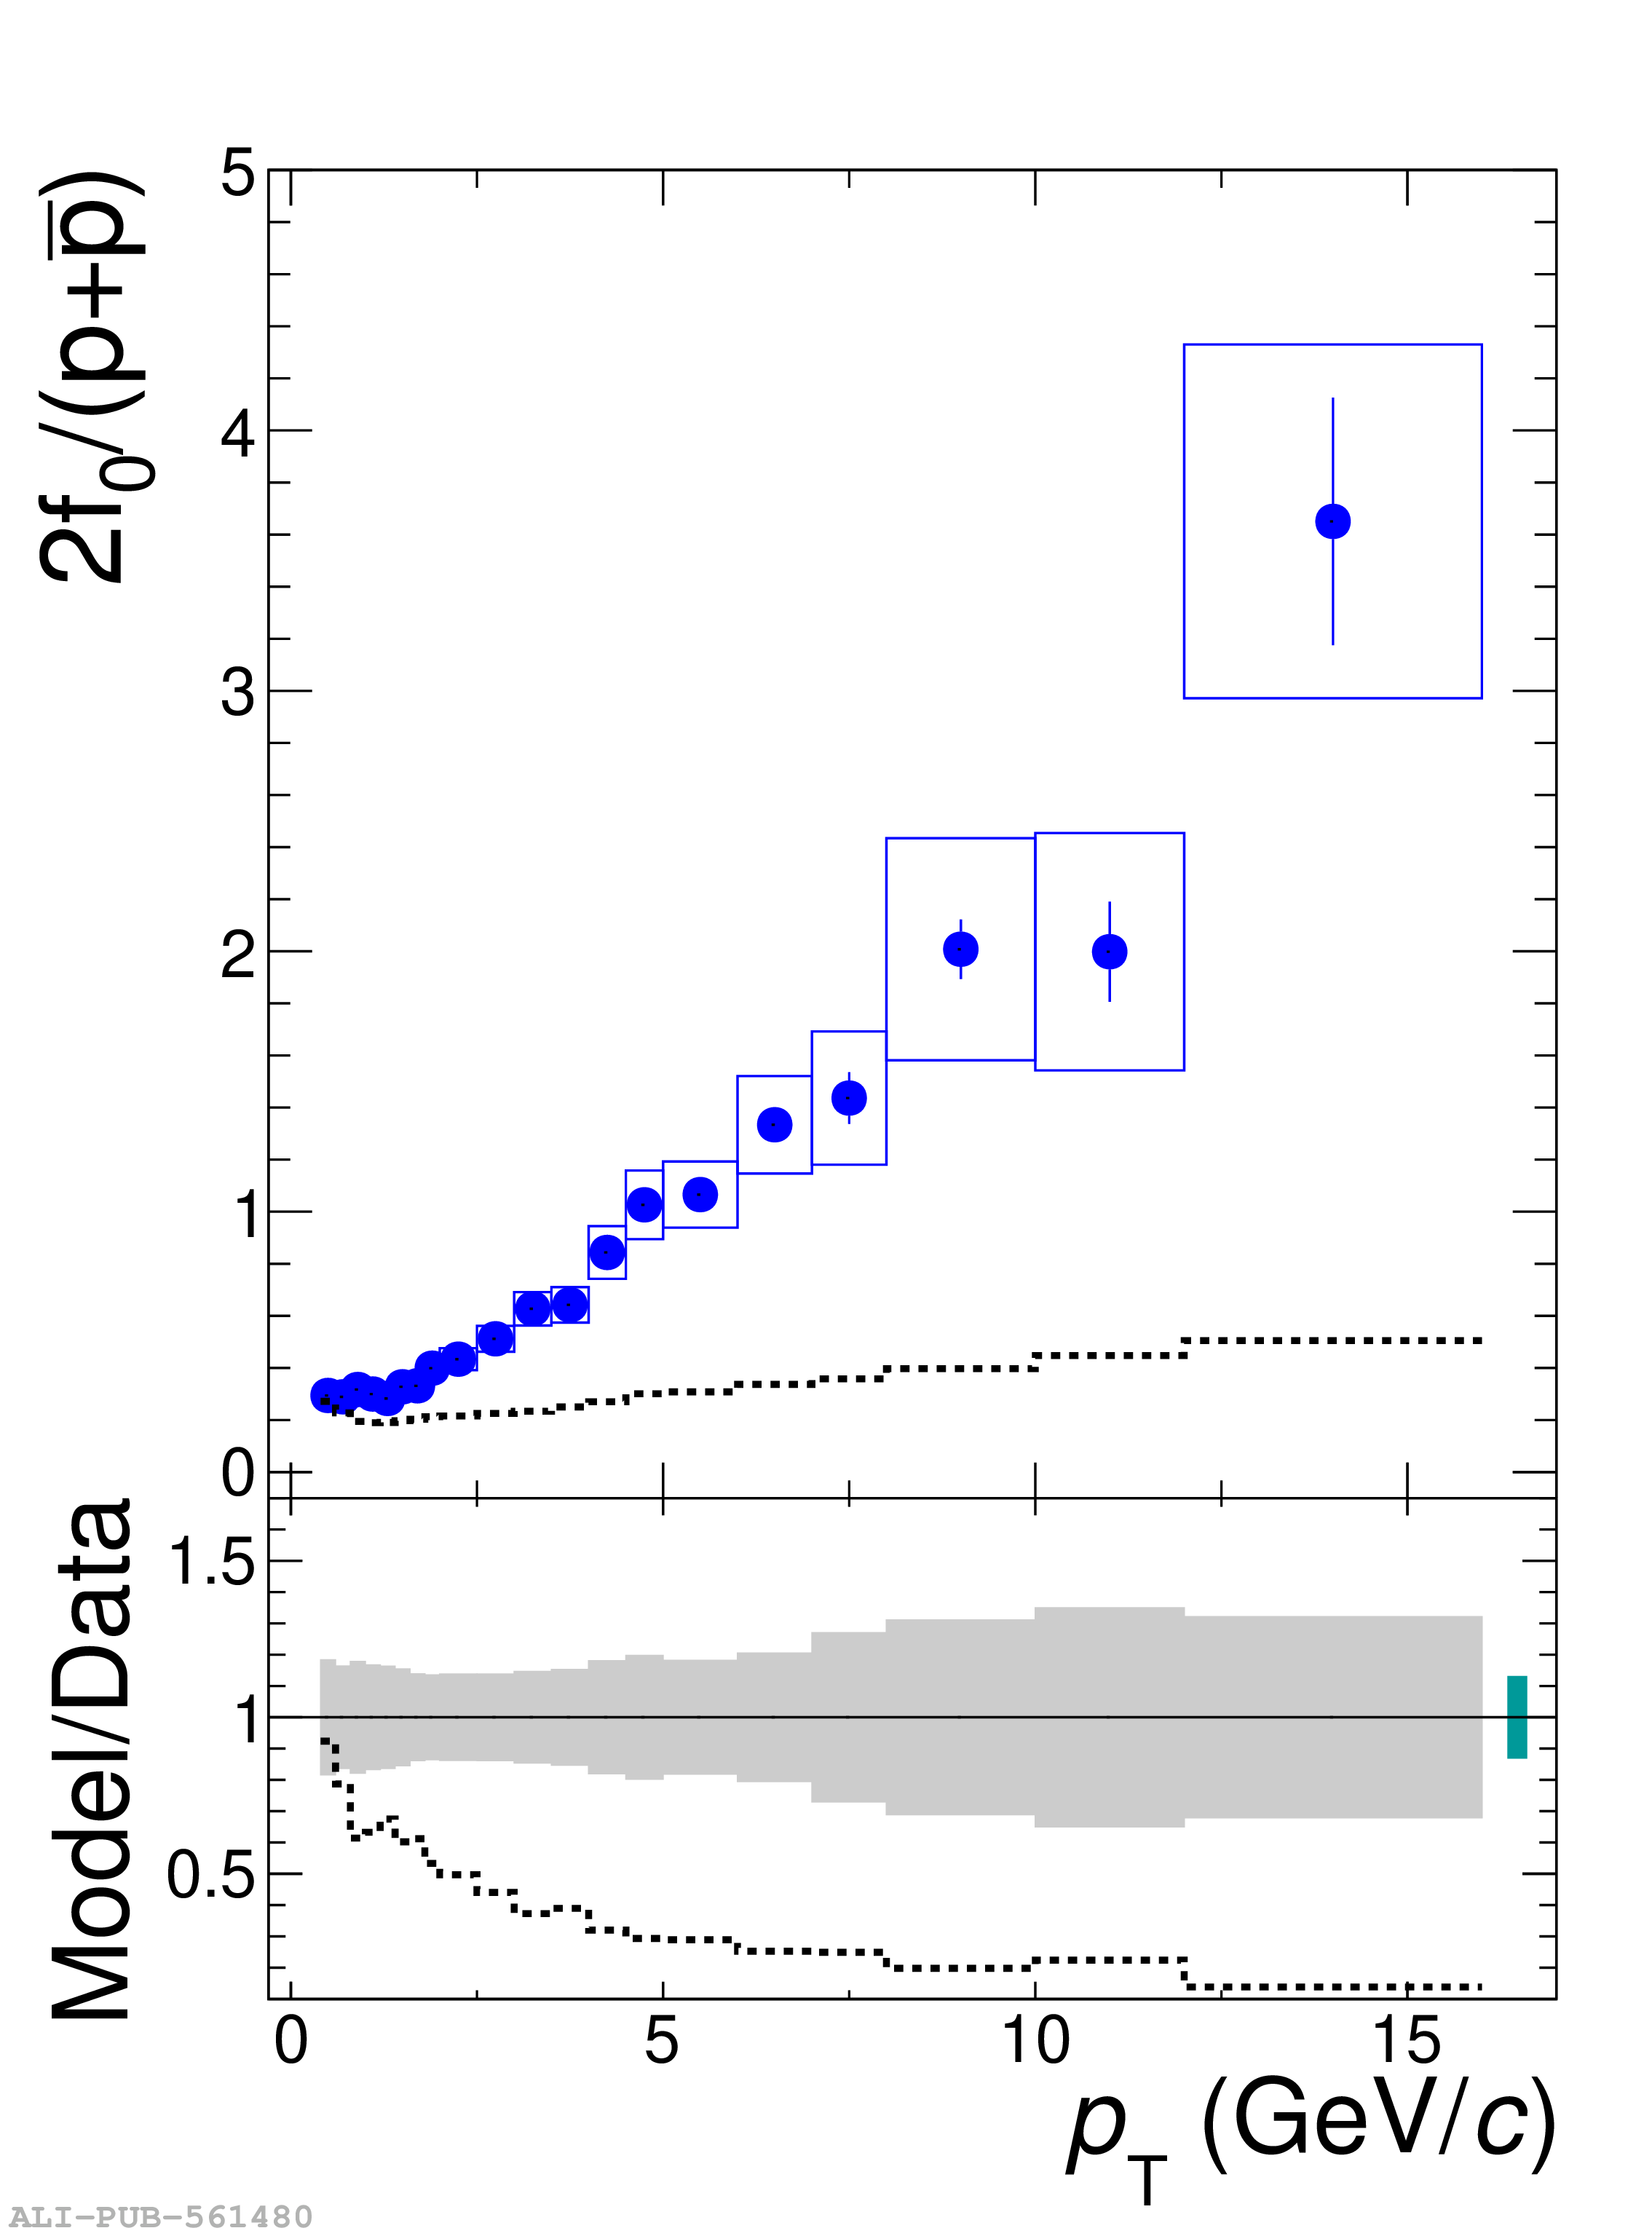 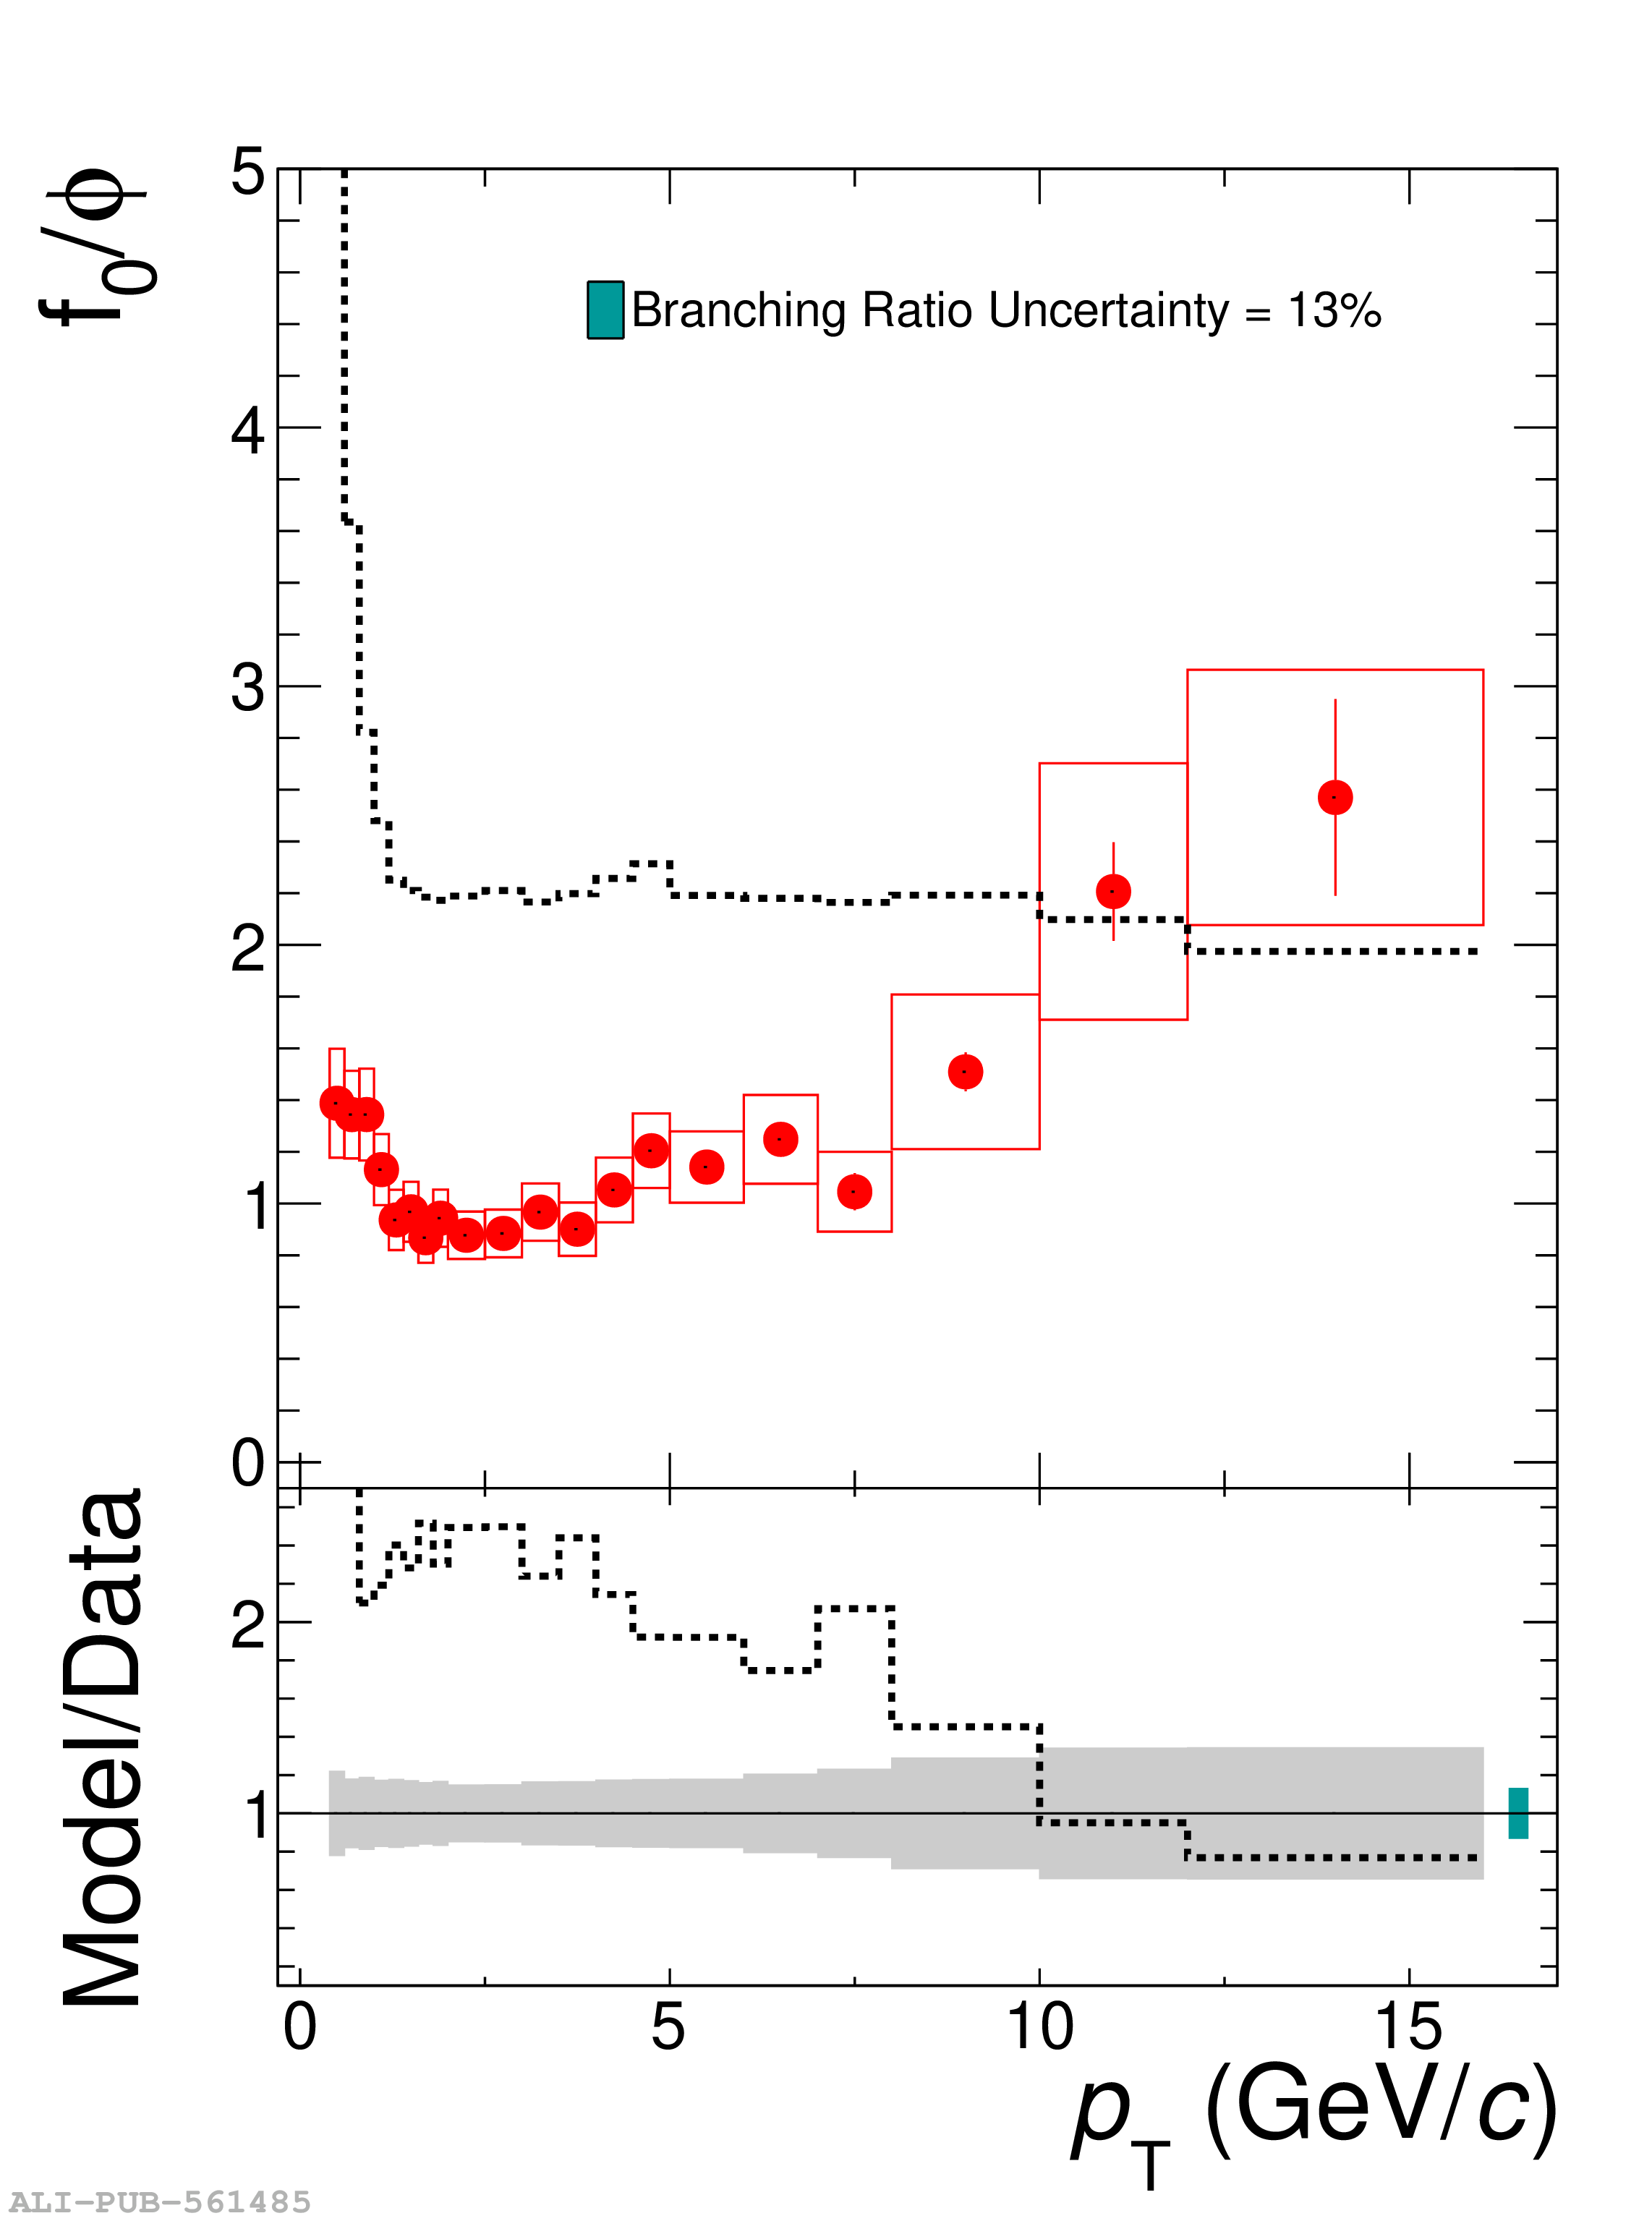 |
Figure 4
Comparison of the measured $2{\rm f_0}/(\pi^{+}+\pi^{-})$ ratio with measurements in ${\rm e^+e^-}$ collisions at $\sqrt{s}$ = 29 GeV, $\sqrt{s}$ = 91 GeV and in pp collisions at $\sqrt{s}$ = 27.5 GeV. The ratios are compared to predictions from statistical hadronisation model (SHM) calculations for ${\rm e^+e^-}$ collisions and pp collisions, GC-SHM and HERWIG 7.2. The hollow boxes represent the total uncertainty on data. The relative uncertainty of 13% due to the branching ratio correction applies to all data points and is shown as a yellow box. All error boxes are drawn with an arbitrary horizontal width for visibility. | 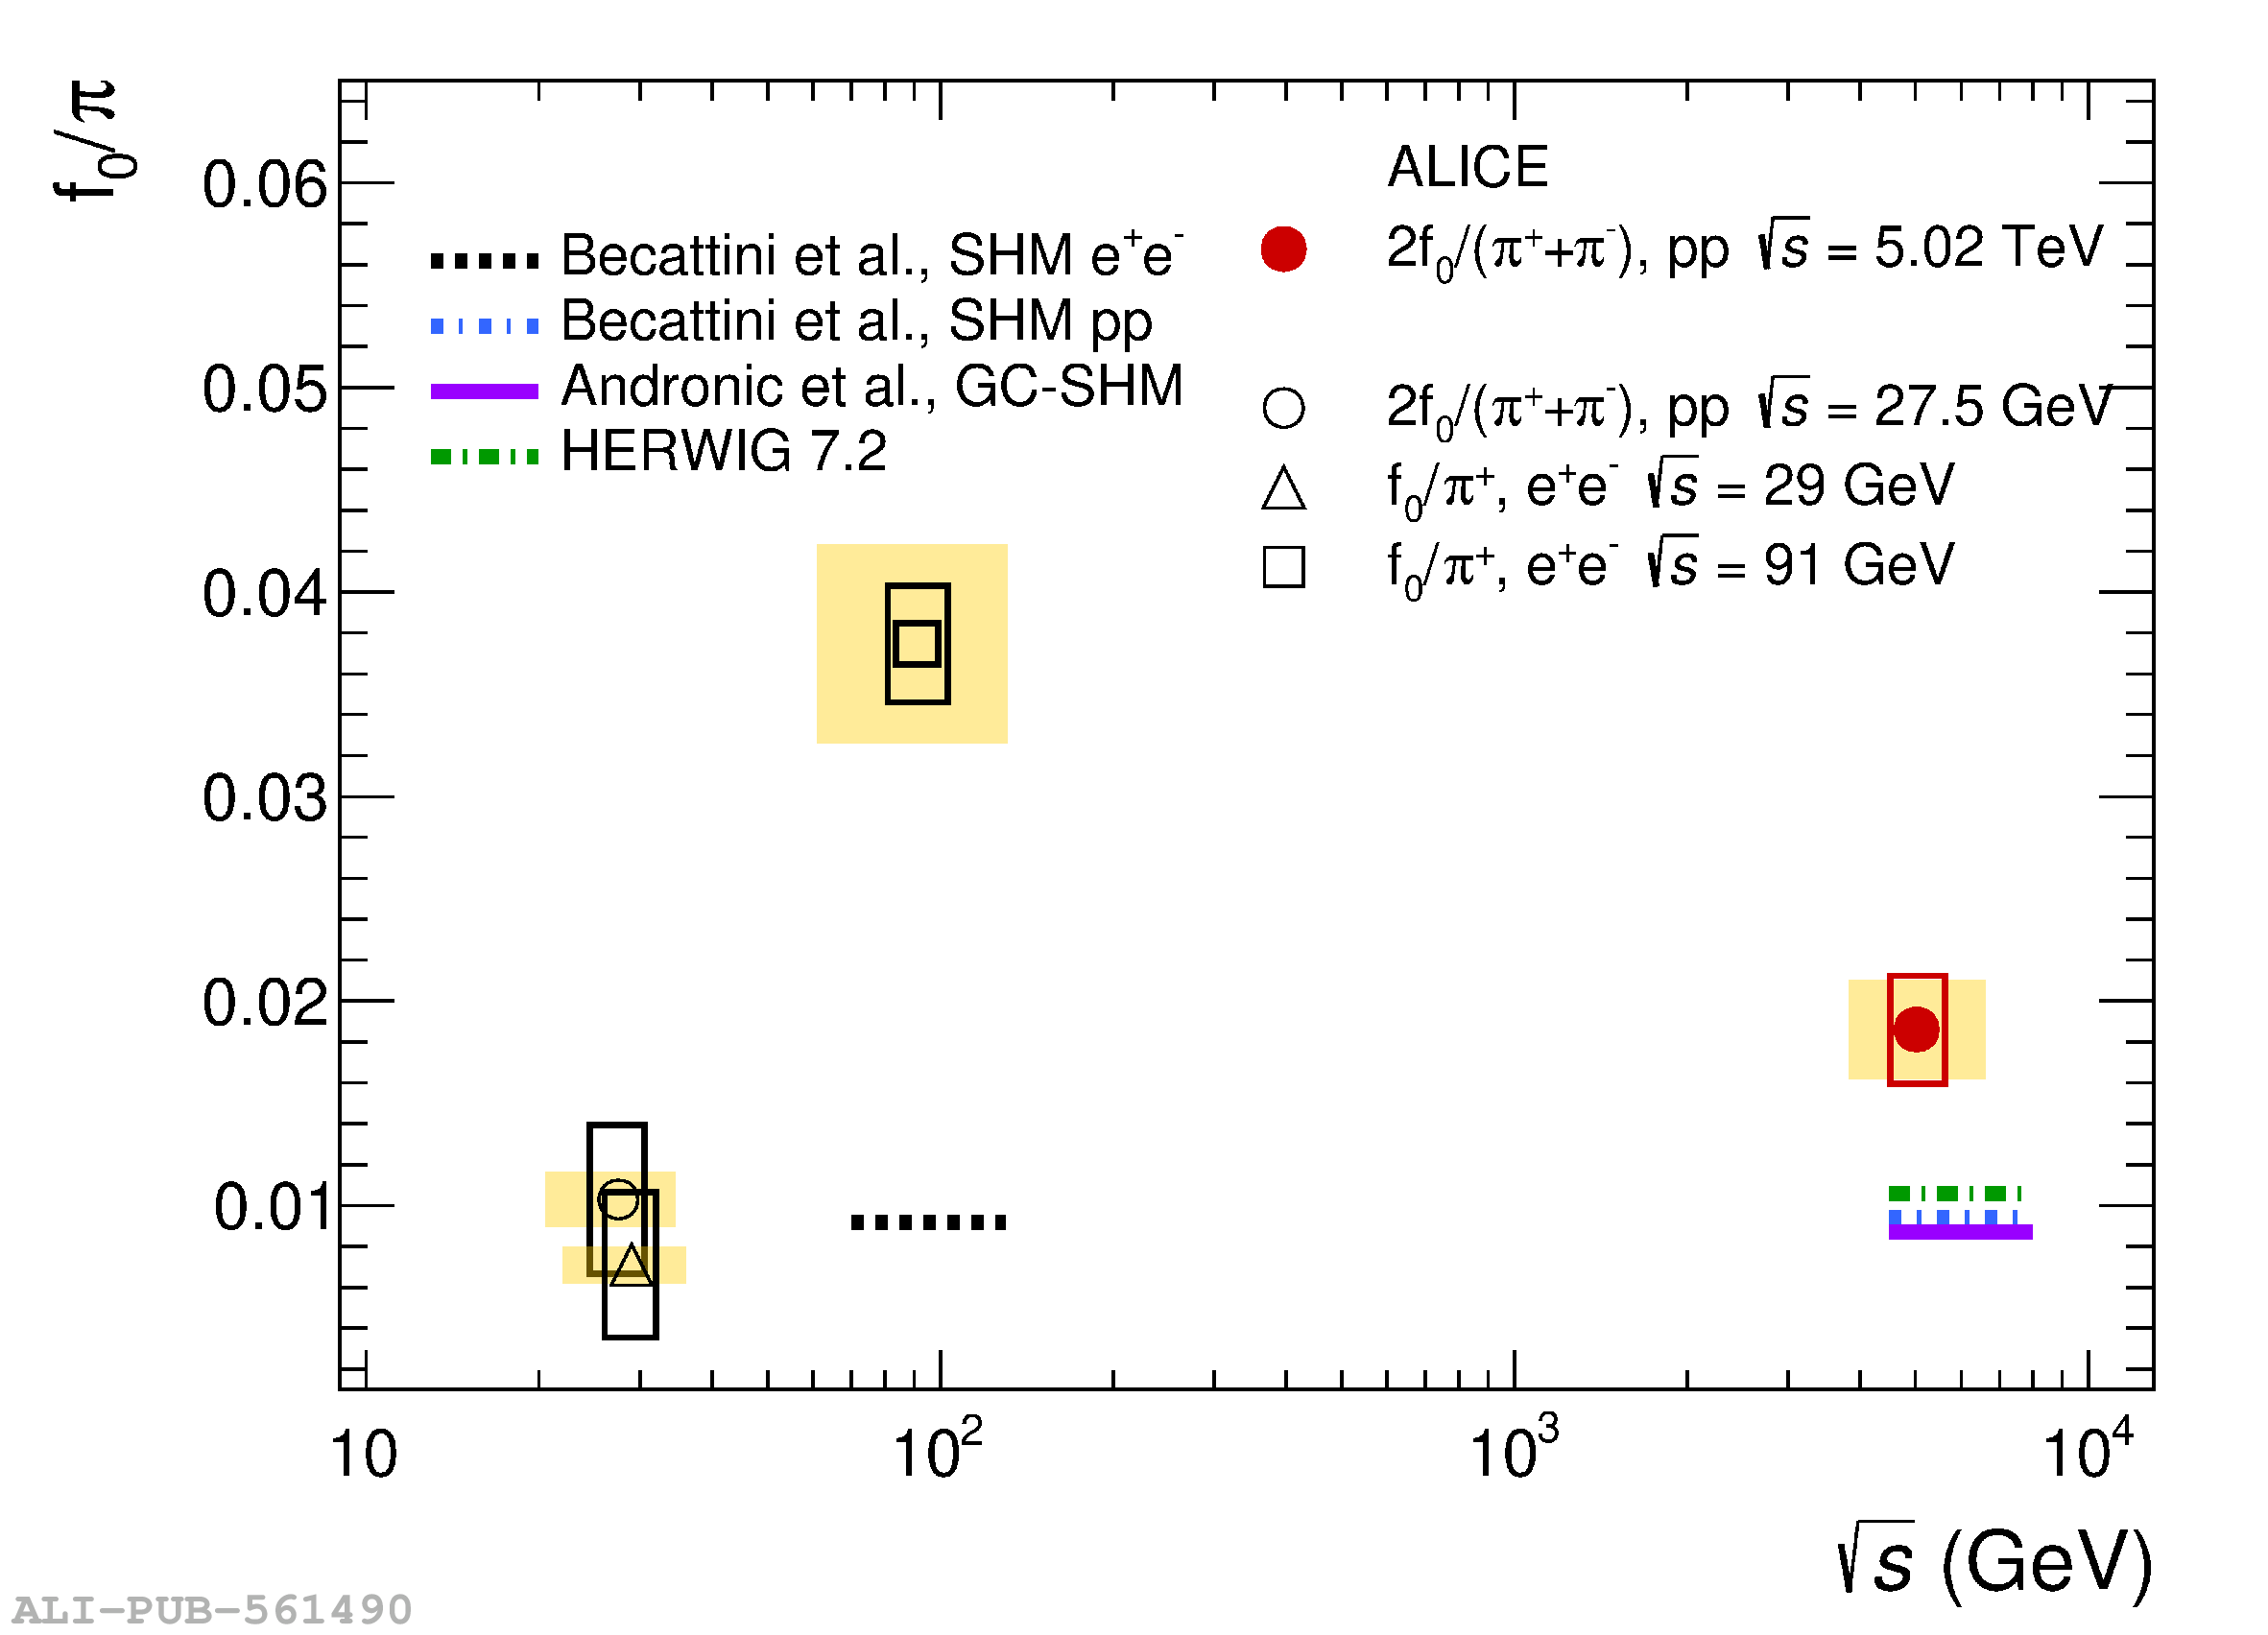 |
Figure 5
The $2{\rm f_0}/(\pi^{+}+\pi^{-})$ ratio measured in pp collisions at $\sqrt{s}$ = 5.02 TeV is compared to two distinct predictions for ${\rm f_o}/\pi^{+}$ from a canonical statistical model ($\gamma_{\mathrm{s}}-$CSM, see text for details) as a function of $\langle {\rm d}N_{\rm ch}/{\rm d}\eta \rangle$. The two calculations differ by the assumed strangeness content of ${\rm f_0(980)}$ and correspond to zero total strangeness, $|S| = 0$ and $|S| = 2$. The height of the hollow red box represents the total uncertainty on the ratio, its width represents the uncertainty on the $\langle {\rm d}N_{\rm ch}/{\rm d}\eta \rangle$. The relative uncertainty of 13% due to the branching ratio correction is shown as a yellow box with an arbitrary horizontal width for visibility. | 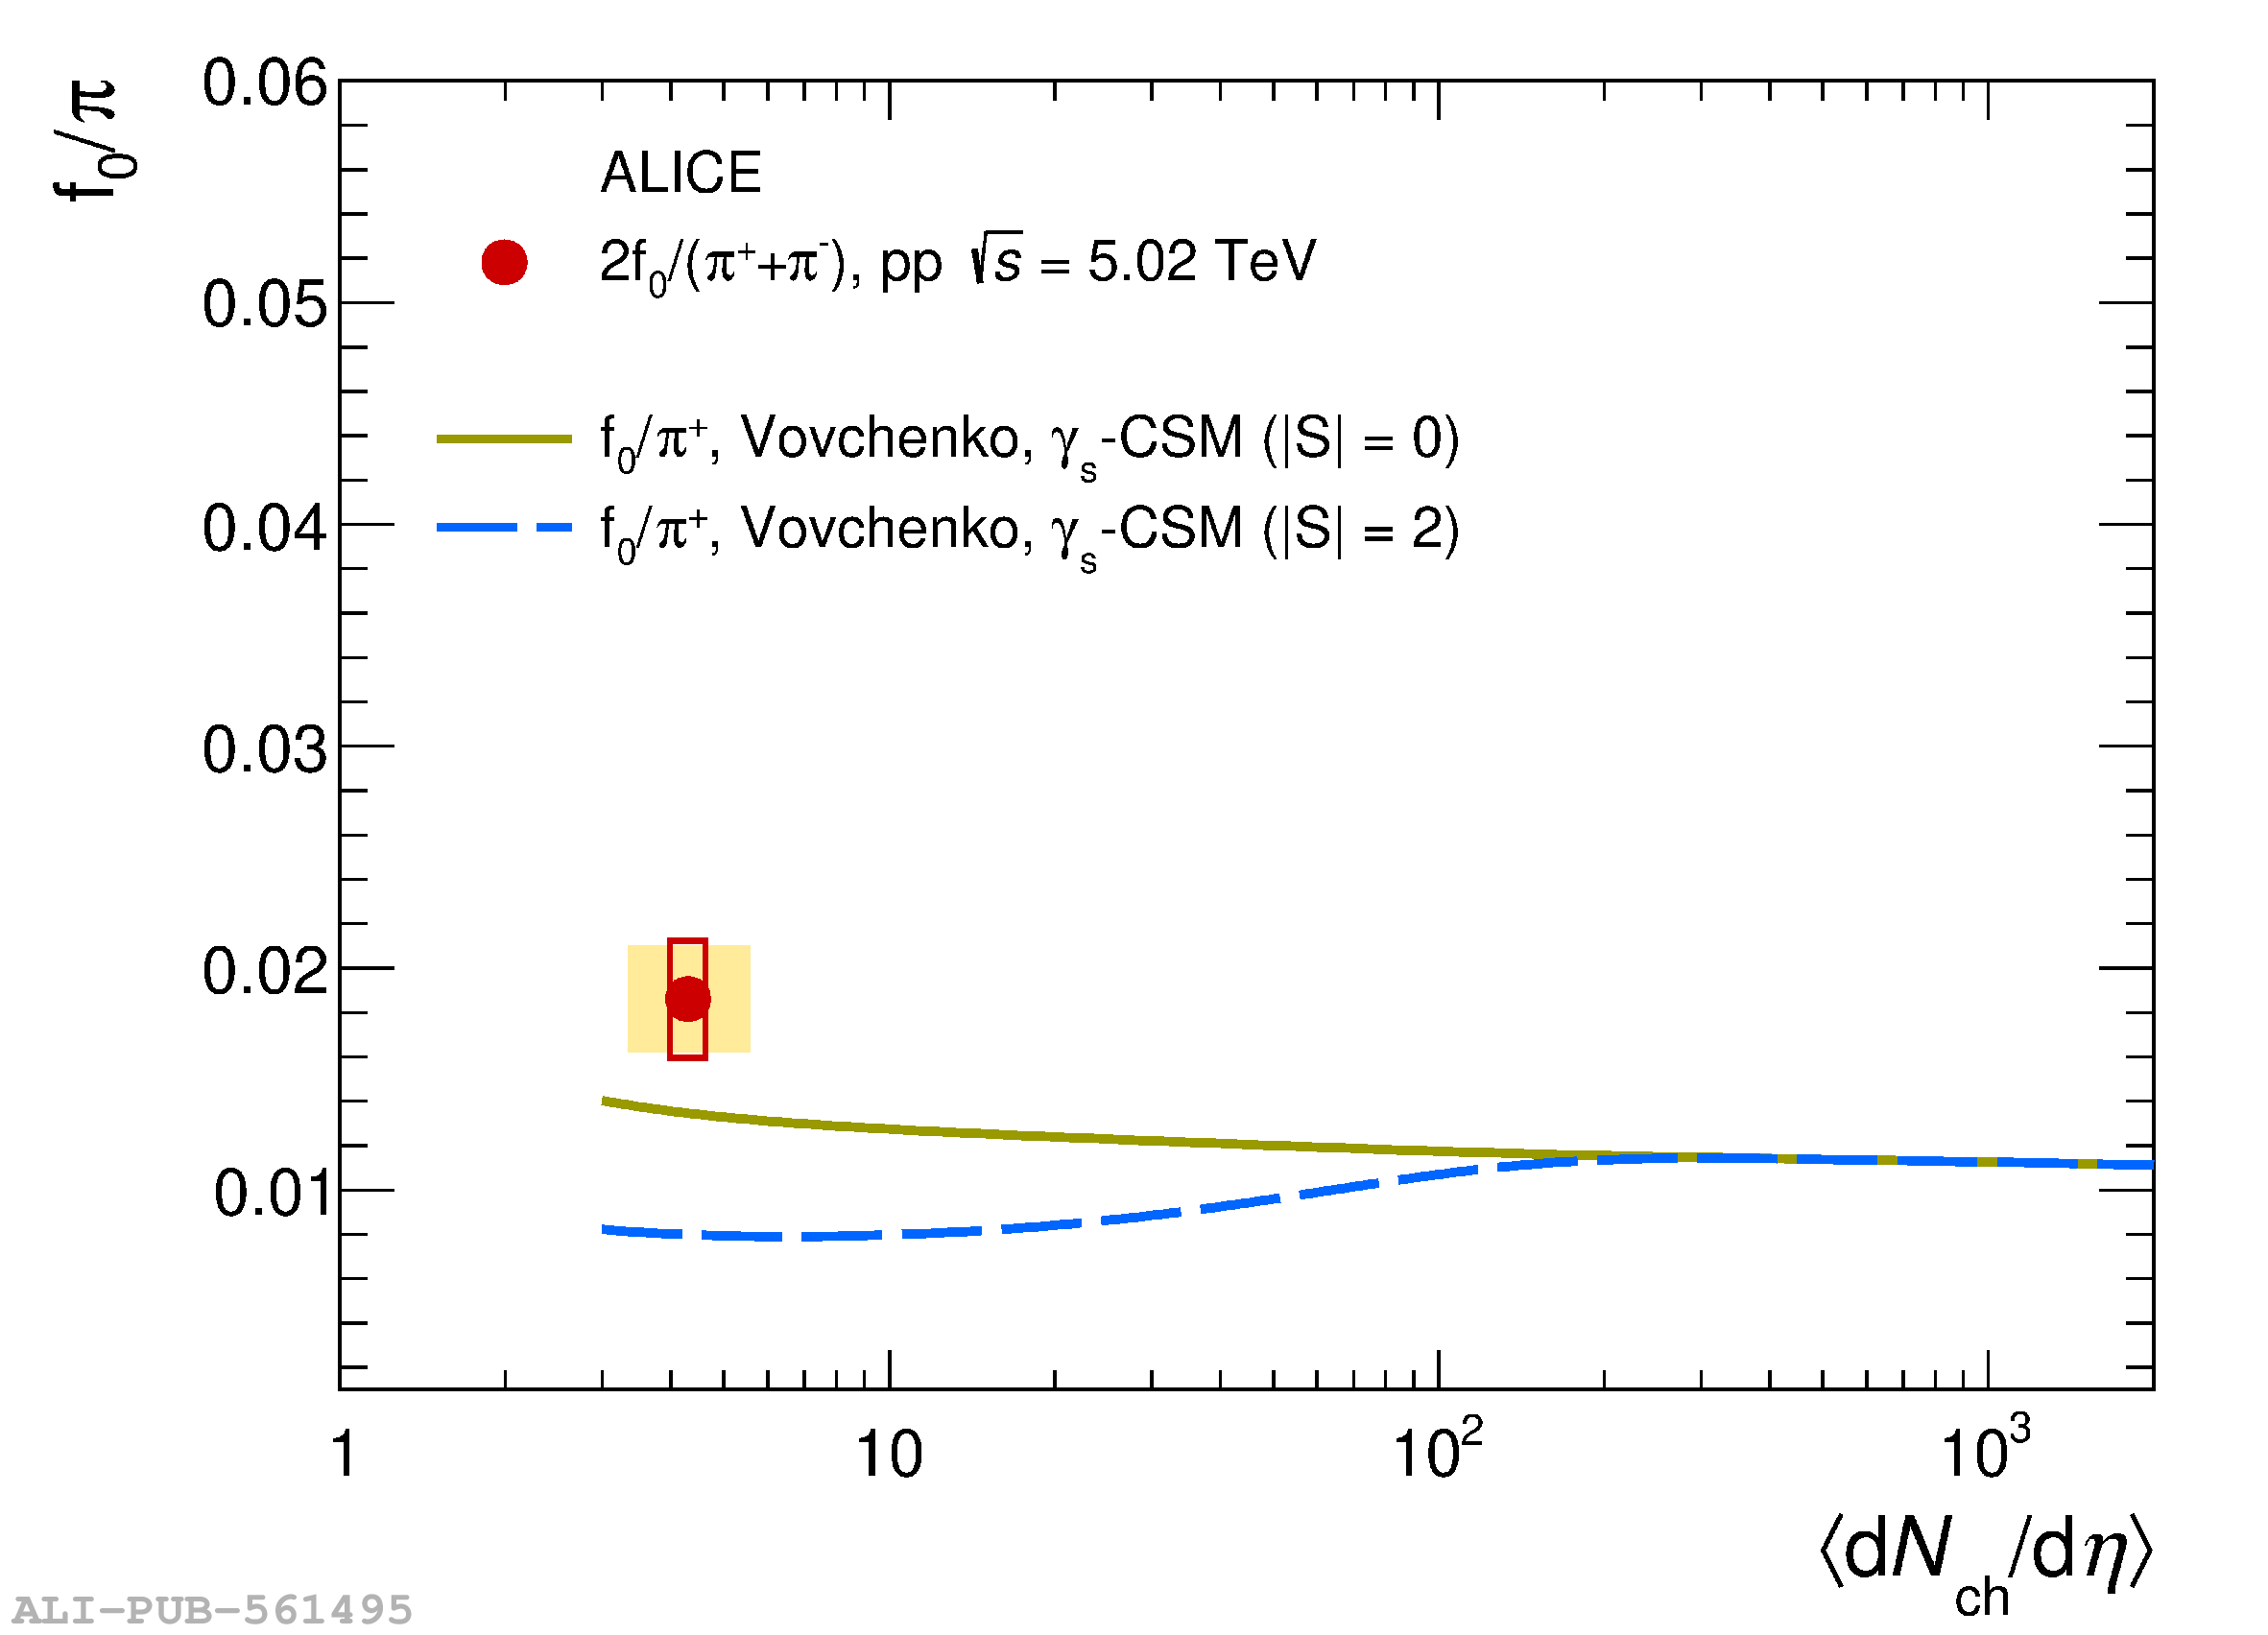 |