Comparison of the measured $2{\rm f_0}/(\pi^{+}+\pi^{-})$ ratio with measurements in ${\rm e^+e^-}$ collisions at $\sqrt{s}$ = 29 GeV, $\sqrt{s}$ = 91 GeV and in pp collisions at $\sqrt{s}$ = 27.5 GeV. The ratios are compared to predictions from statistical hadronisation model (SHM) calculations for ${\rm e^+e^-}$ collisions and pp collisions, GC-SHM and HERWIG 7.2. The hollow boxes represent the total uncertainty on data. The relative uncertainty of 13% due to the branching ratio correction applies to all data points and is shown as a yellow box. All error boxes are drawn with an arbitrary horizontal width for visibility. | 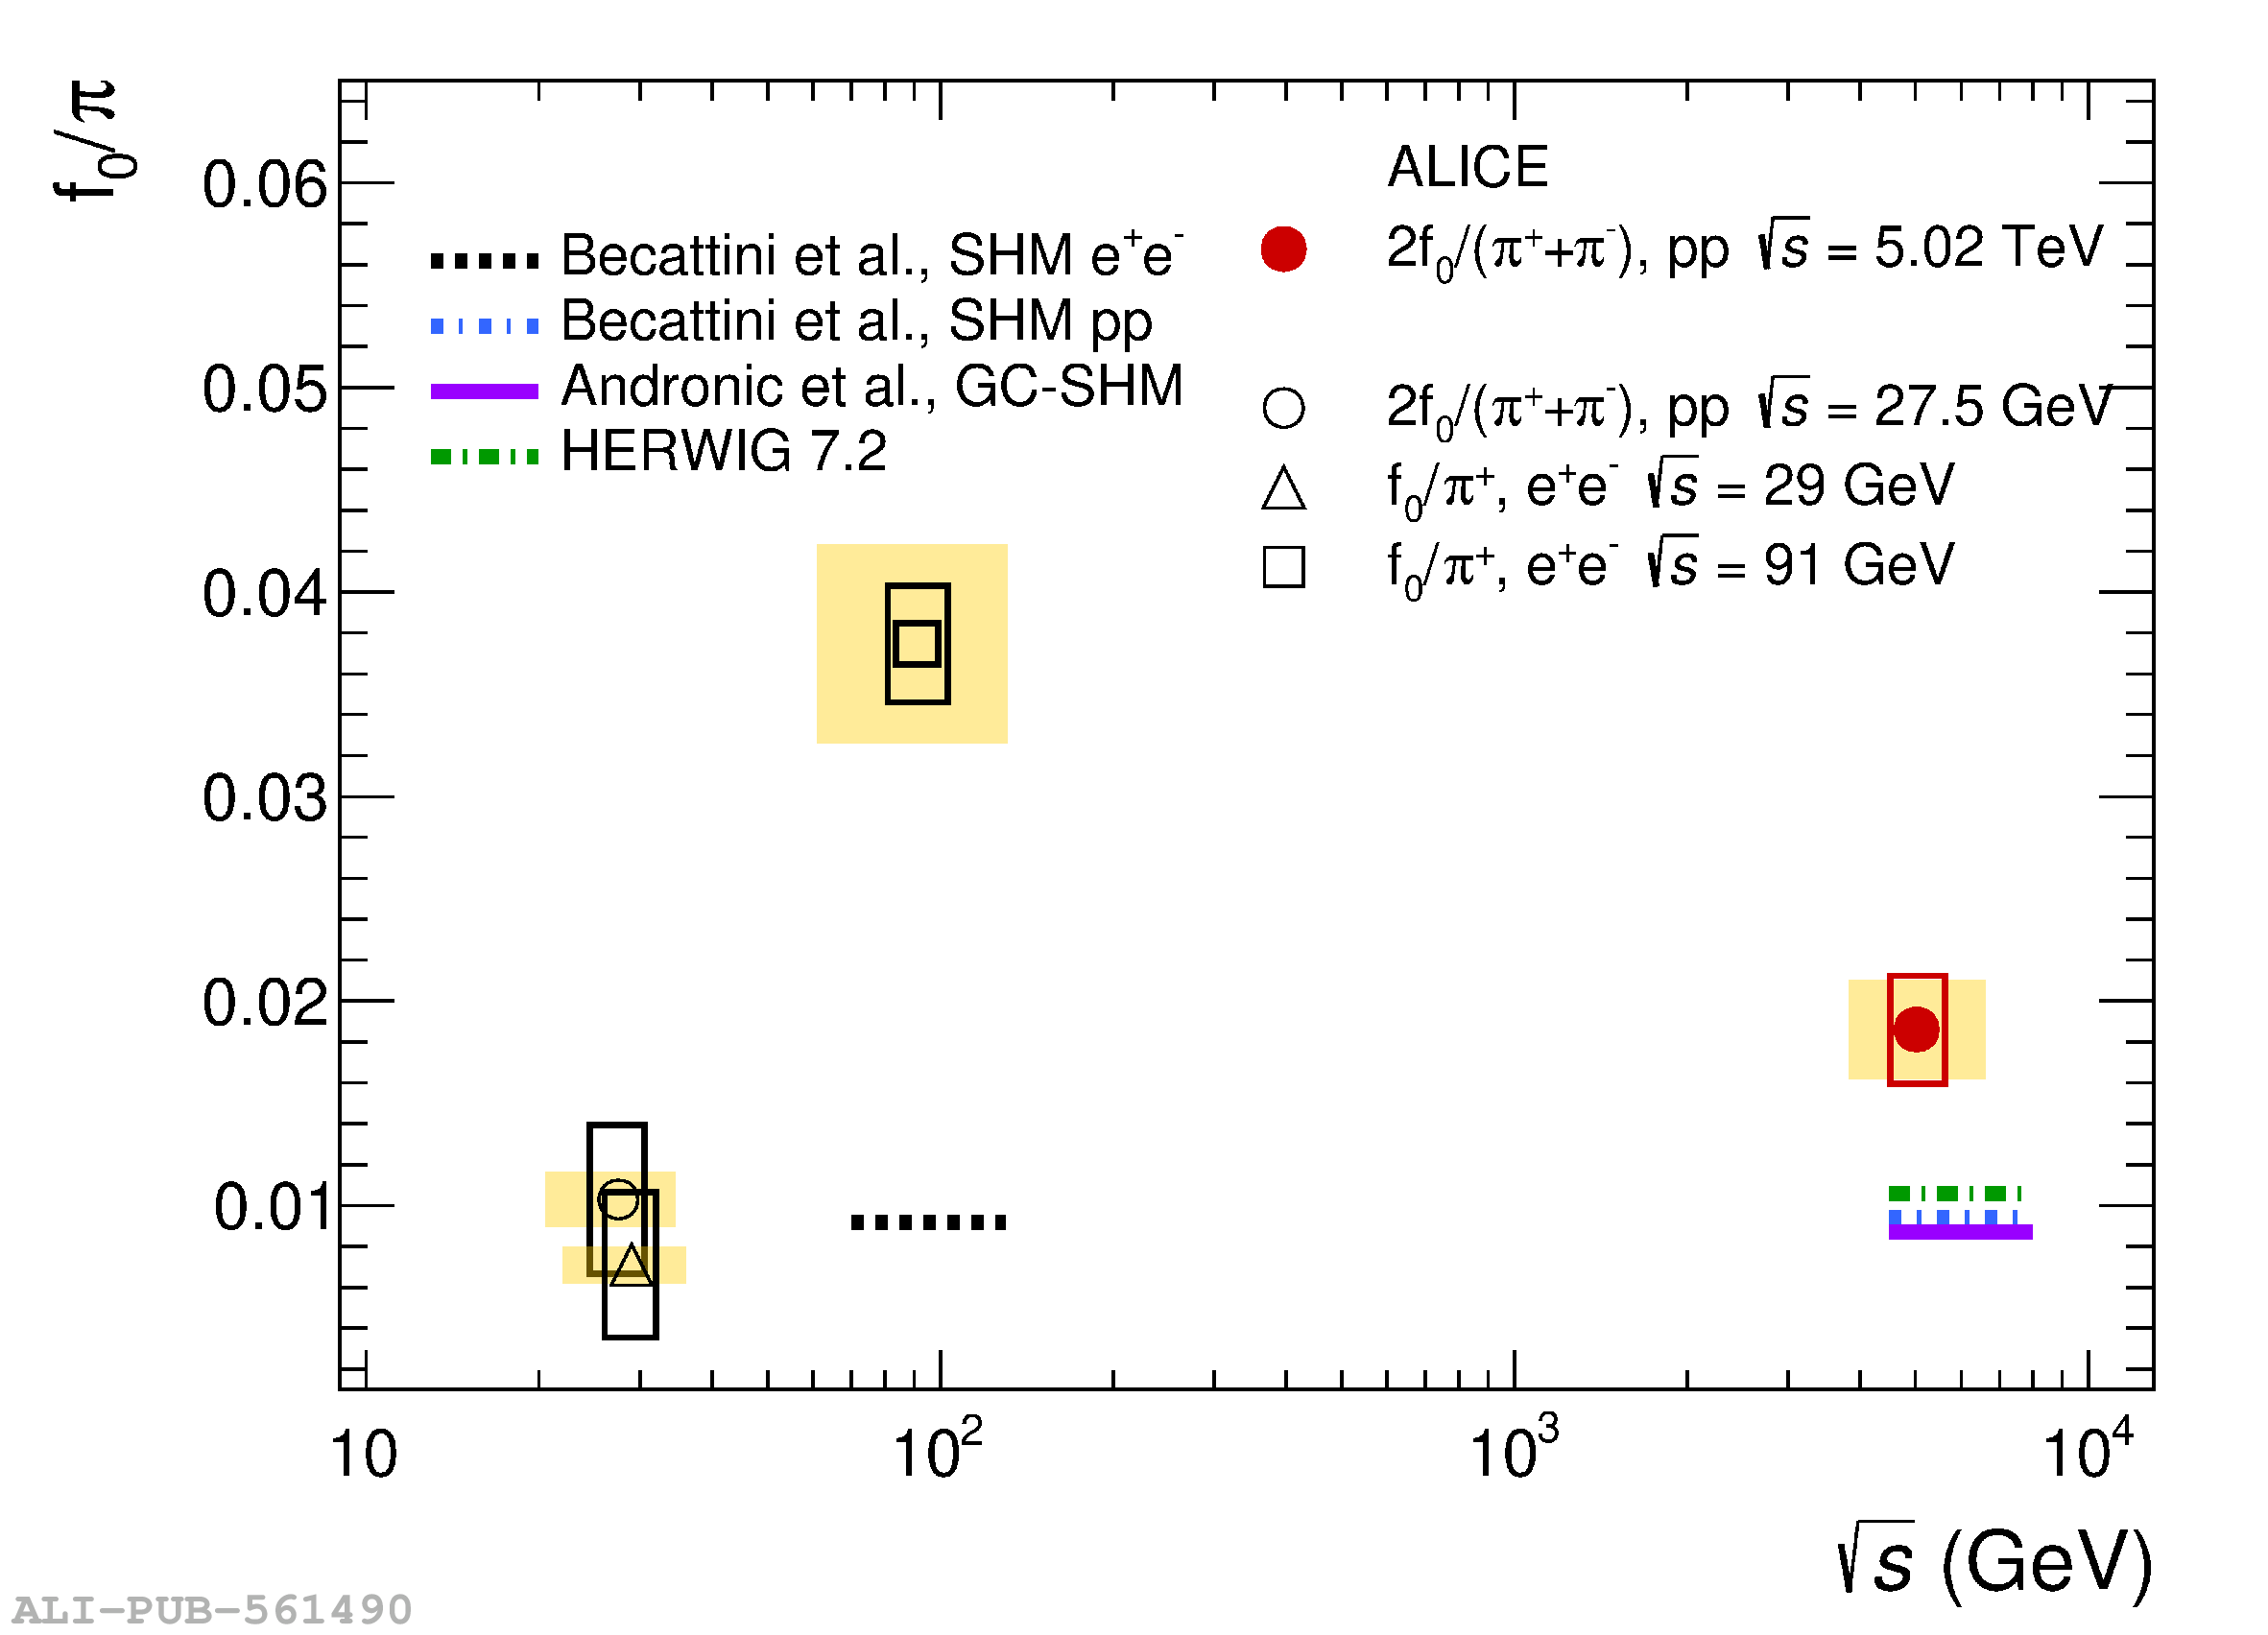 |