The $2{\rm f_0}/(\pi^{+}+\pi^{-})$ ratio measured in pp collisions at $\sqrt{s}$ = 5.02 TeV is compared to two distinct predictions for ${\rm f_o}/\pi^{+}$ from a canonical statistical model ($\gamma_{\mathrm{s}}-$CSM, see text for details) as a function of $\langle {\rm d}N_{\rm ch}/{\rm d}\eta \rangle$. The two calculations differ by the assumed strangeness content of ${\rm f_0(980)}$ and correspond to zero total strangeness, $|S| = 0$ and $|S| = 2$. The height of the hollow red box represents the total uncertainty on the ratio, its width represents the uncertainty on the $\langle {\rm d}N_{\rm ch}/{\rm d}\eta \rangle$. The relative uncertainty of 13% due to the branching ratio correction is shown as a yellow box with an arbitrary horizontal width for visibility. | 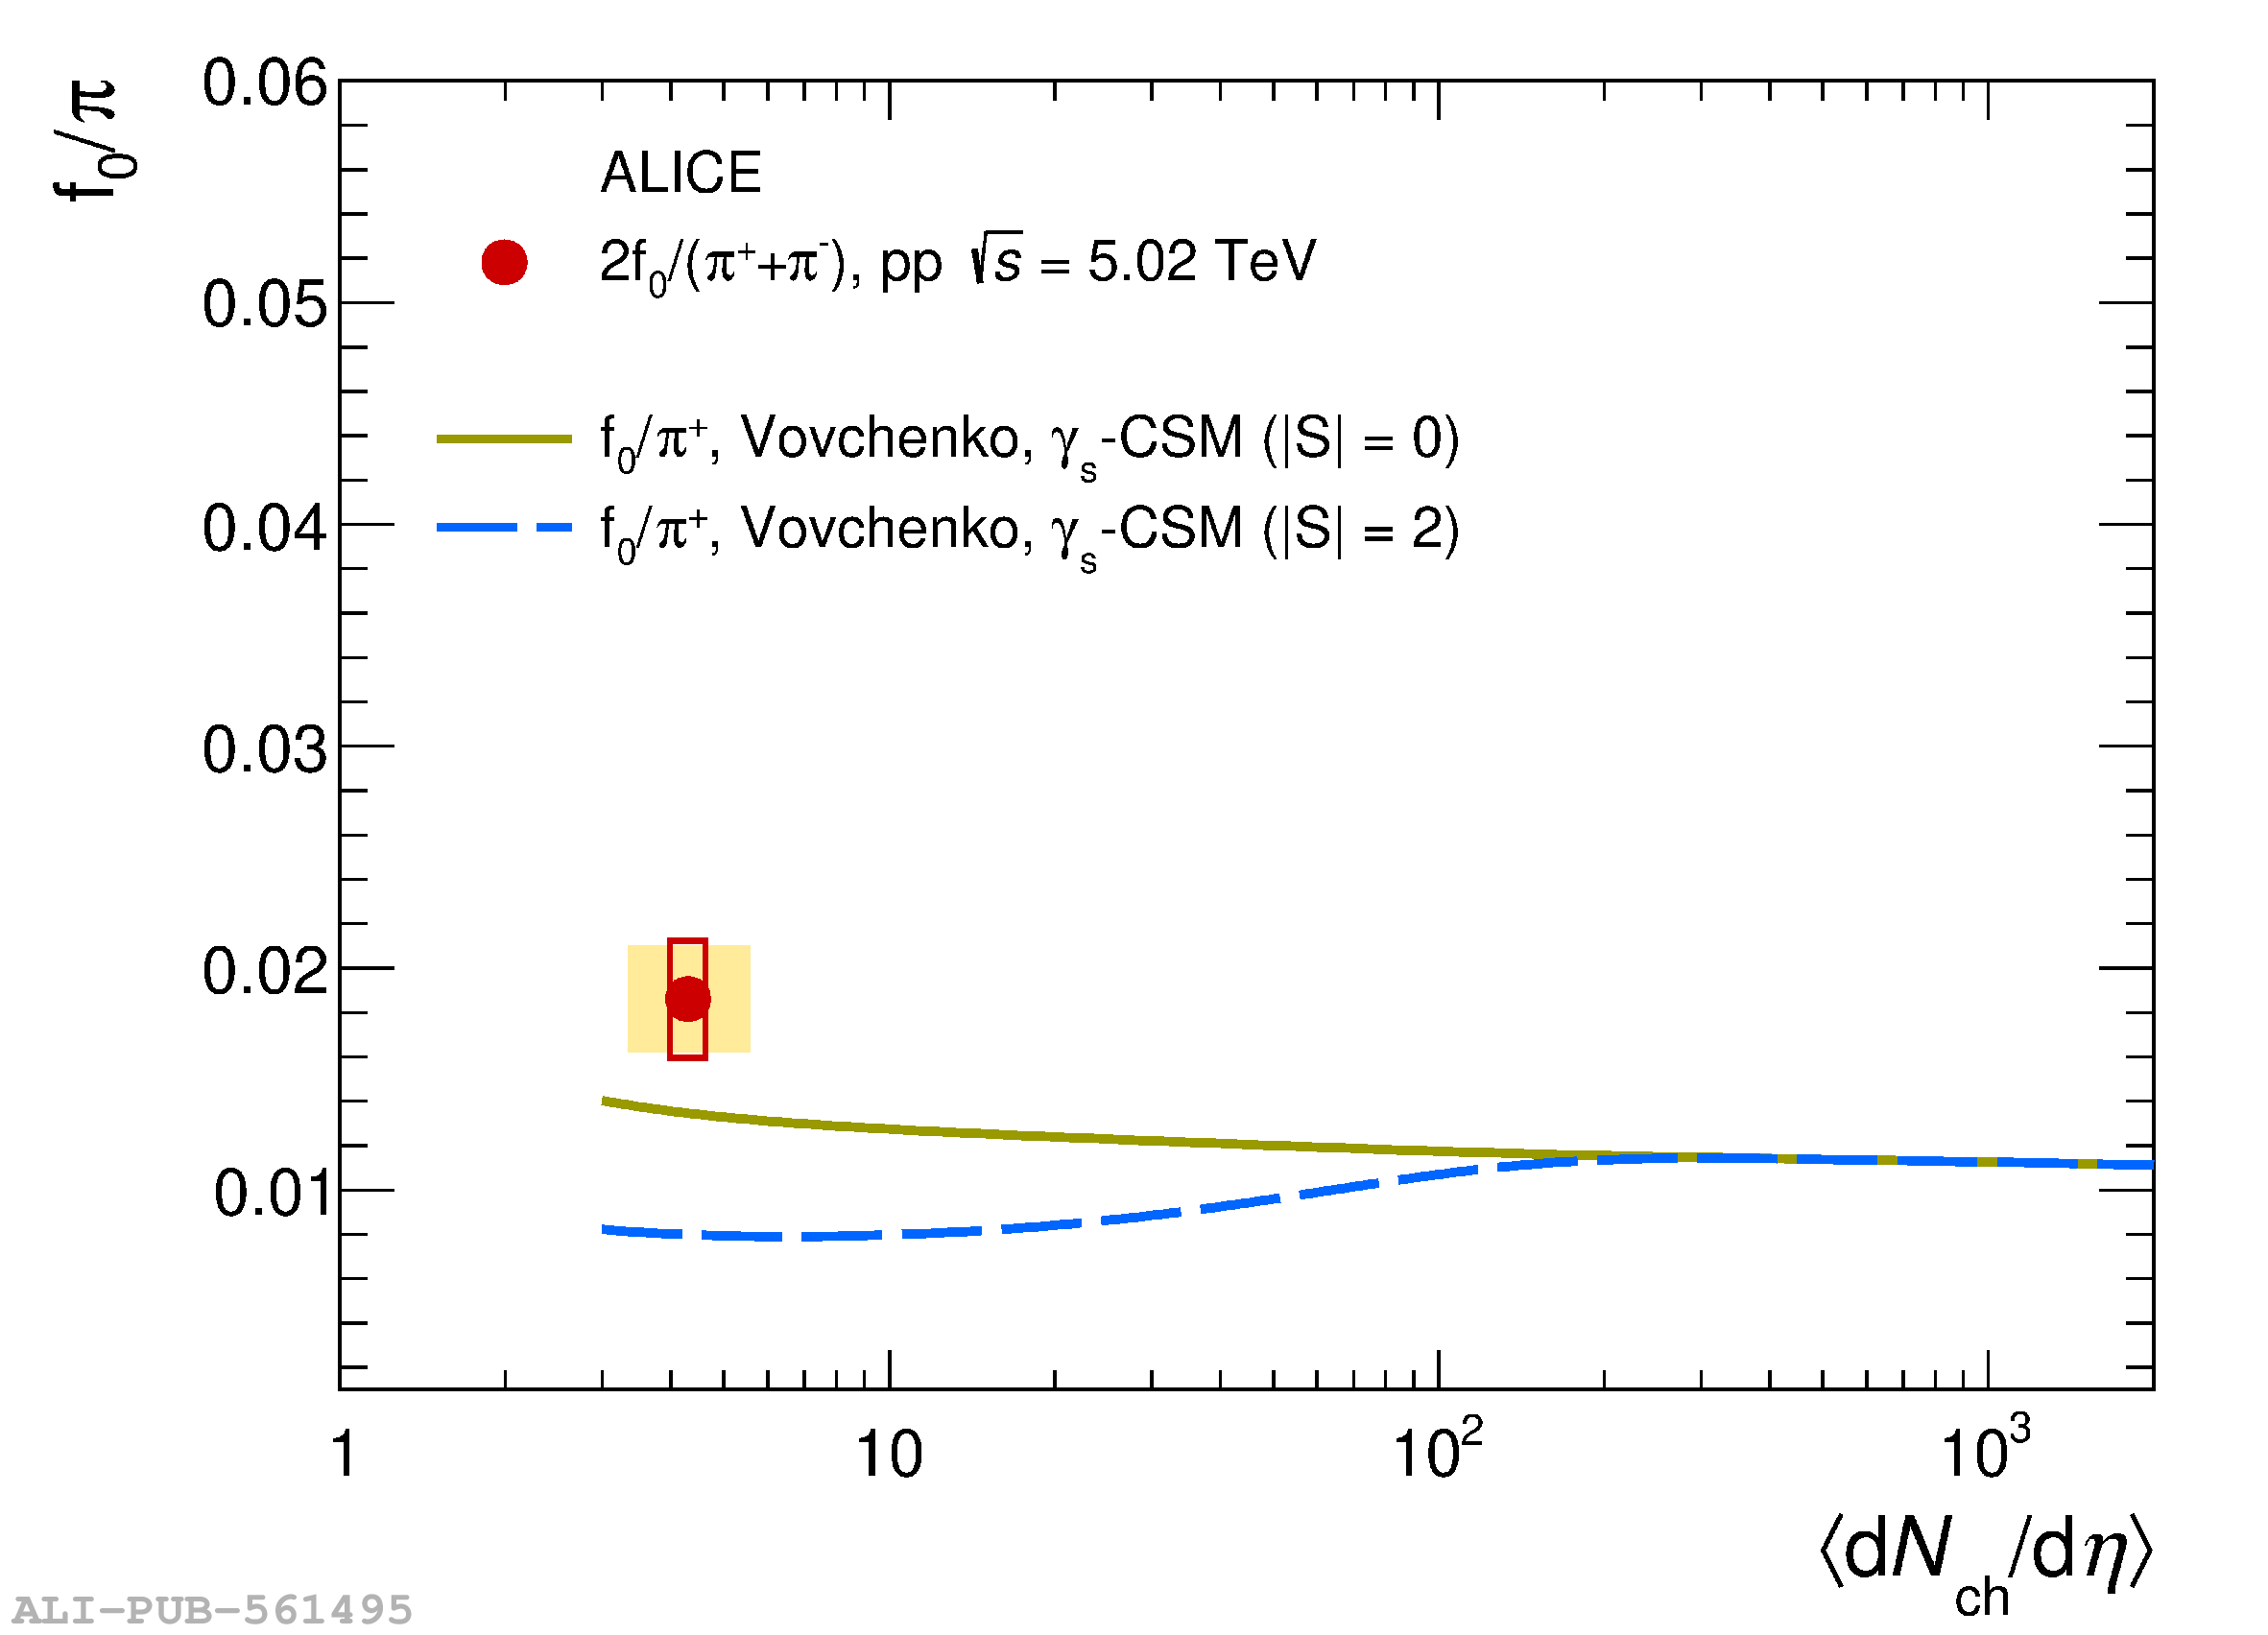 |