We study the polarization of inclusive J/$\psi$ produced in Pb$-$Pb collisions at $\sqrt{s_{\rm NN}}=5.02$ TeV at the LHC in the dimuon channel, via the measurement of the angular distribution of its decay products. We perform the study in the rapidity region $2.5<~y<~4$, for three transverse momentum intervals ($2<~p_{\rm T}<~4$, $4<~p_{\rm T}<~6$, $6<~p_{\rm T}<~10$ GeV/$c$) and as a function of the centrality of the collision for $2<~p_{\rm T}<~6$ GeV/c. For the first time, the polarization is measured with respect to the event plane of the collision, by considering the angle between the positive-charge decay muon in the J/$\psi$ rest frame and the axis perpendicular to the event-plane vector in the laboratory system. A small transverse polarization is measured, with a significance reaching 3.9$\sigma$ at low $p_{\rm T}$ and for intermediate centrality values. The polarization could be connected with the behaviour of the quark$-$gluon plasma, formed in Pb$-$Pb collisions, as a rotating fluid with large vorticity, as well as with the existence of a strong magnetic field in the early stage of its formation.
Phys. Rev. Lett. 131 (2023) 042303
HEP Data
e-Print: arXiv:2204.10171 | PDF | inSPIRE
CERN-EP-2022-066
Figure group
Figure 1
Fit to the ($A\times\epsilon$)-corrected angular distribution of the positive muons from the J/$\psi$ decay, for the interval $2< p_ {\rm T}< 4$ GeV/$c$ and the centrality range 30%-50% (red points and curve). Only statistical uncertainties are shown for the data points. The shaded area represents the uncertainty associated with the fit. Also shown (blue points and curve) is the result of a control analysis where, for each event, the estimated event plane was rotated by a random angle. | 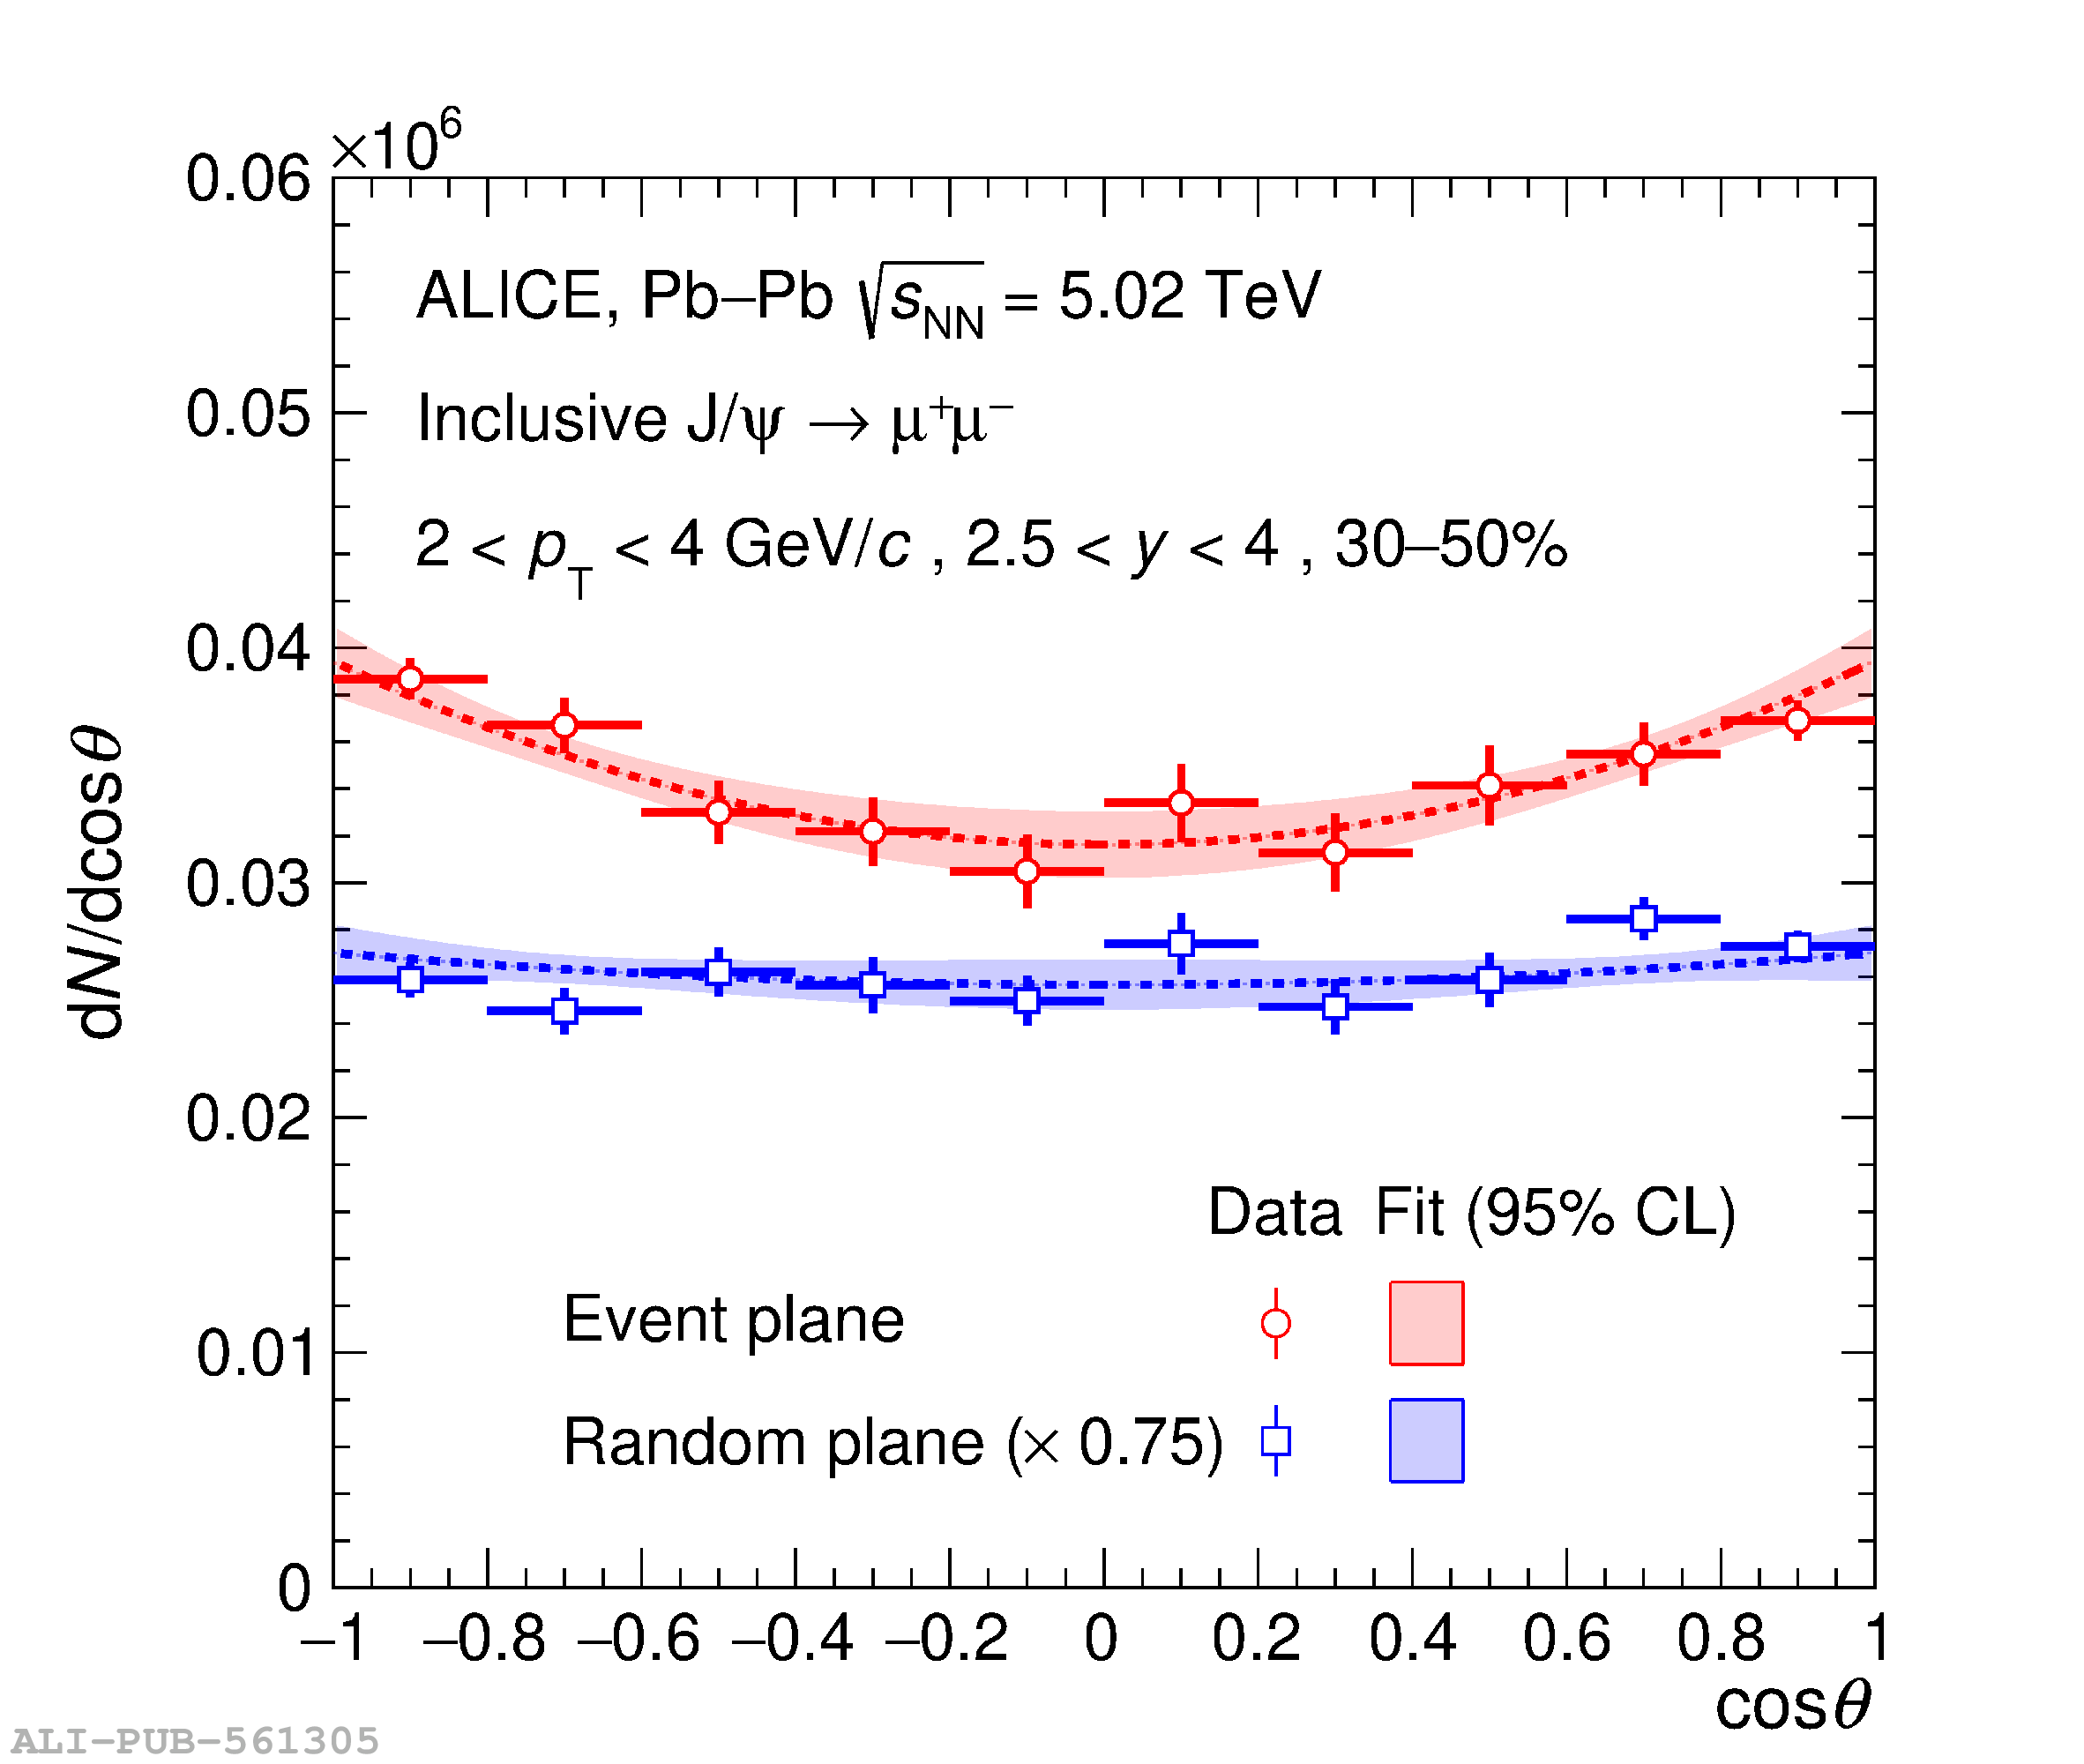 |
Figure 2
Centrality (left panel) and $p_{\rm T}$ dependence (right panel) of $\lambda_{\theta}$. The vertical bars represent the statistical uncertainties, while the boxes correspond to the systematic uncertainties. The horizontal bars show the size of the corresponding centrality and $p_{\rm T}$ ranges, with the data points being located at the center of each interval. | 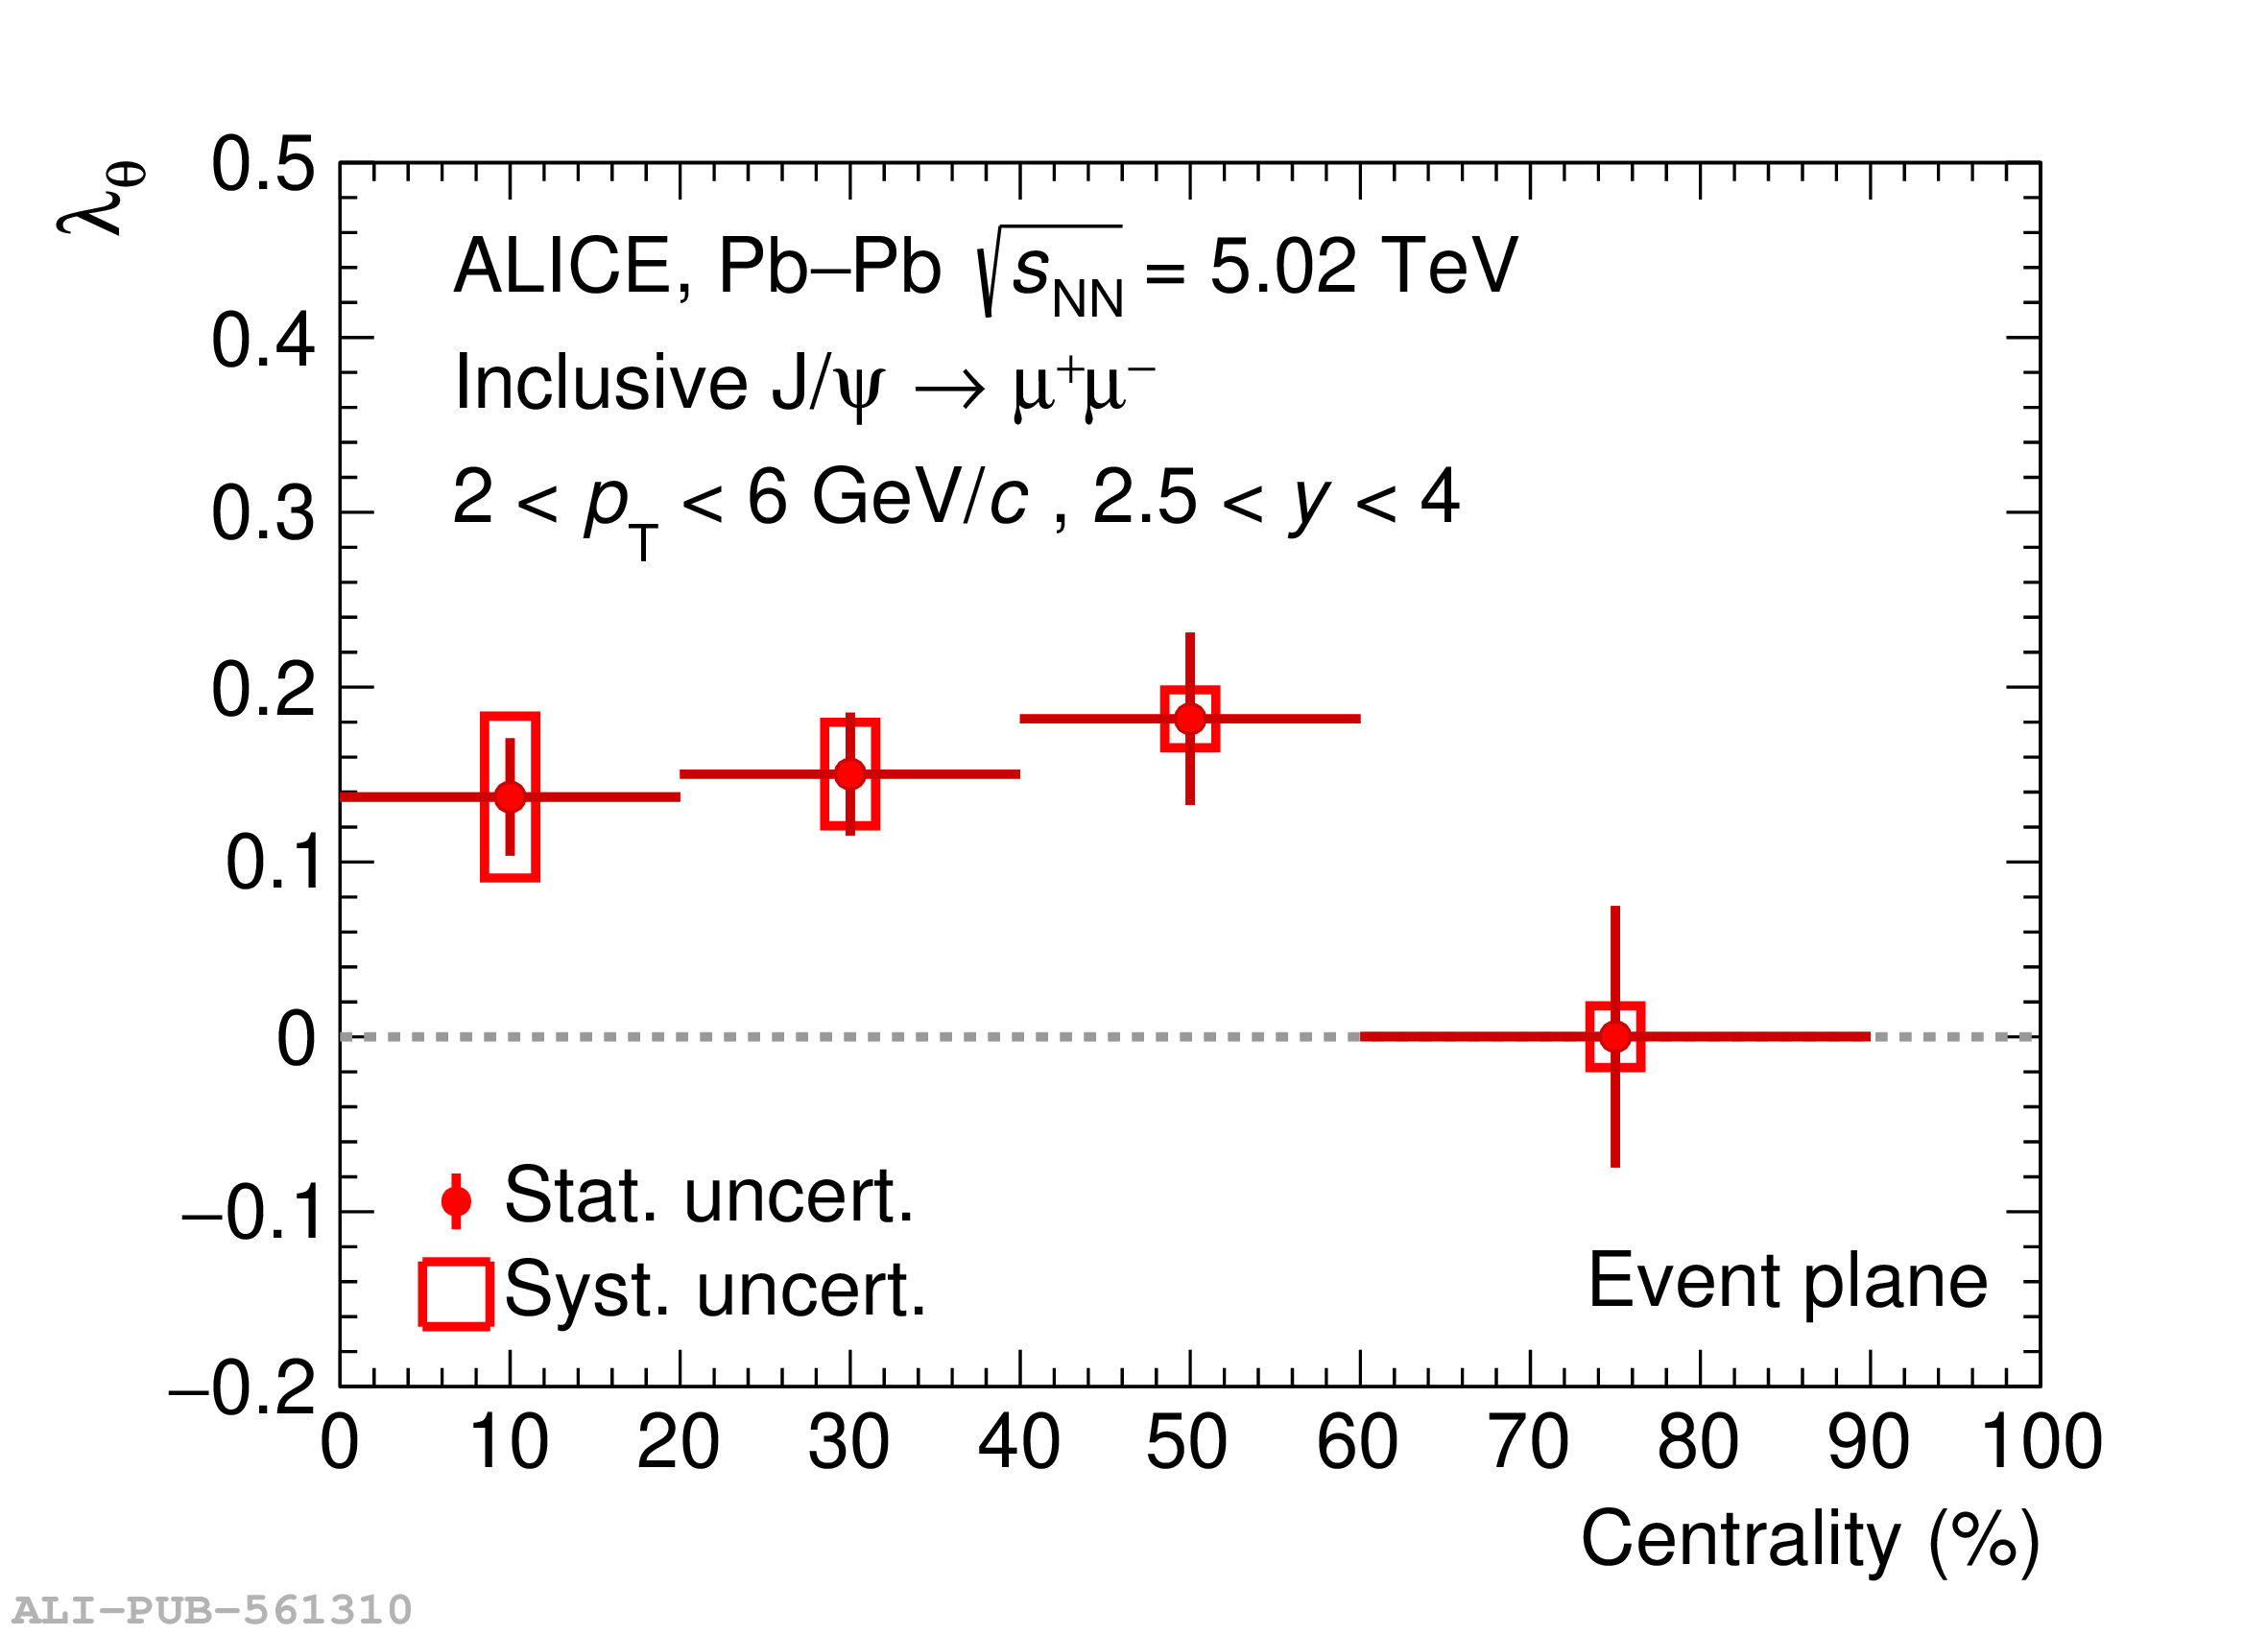  |