Fit to the ($A\times\epsilon$)-corrected angular distribution of the positive muons from the J/$\psi$ decay, for the interval $2< p_ {\rm T}< 4$ GeV/$c$ and the centrality range 30%-50% (red points and curve). Only statistical uncertainties are shown for the data points. The shaded area represents the uncertainty associated with the fit. Also shown (blue points and curve) is the result of a control analysis where, for each event, the estimated event plane was rotated by a random angle. | 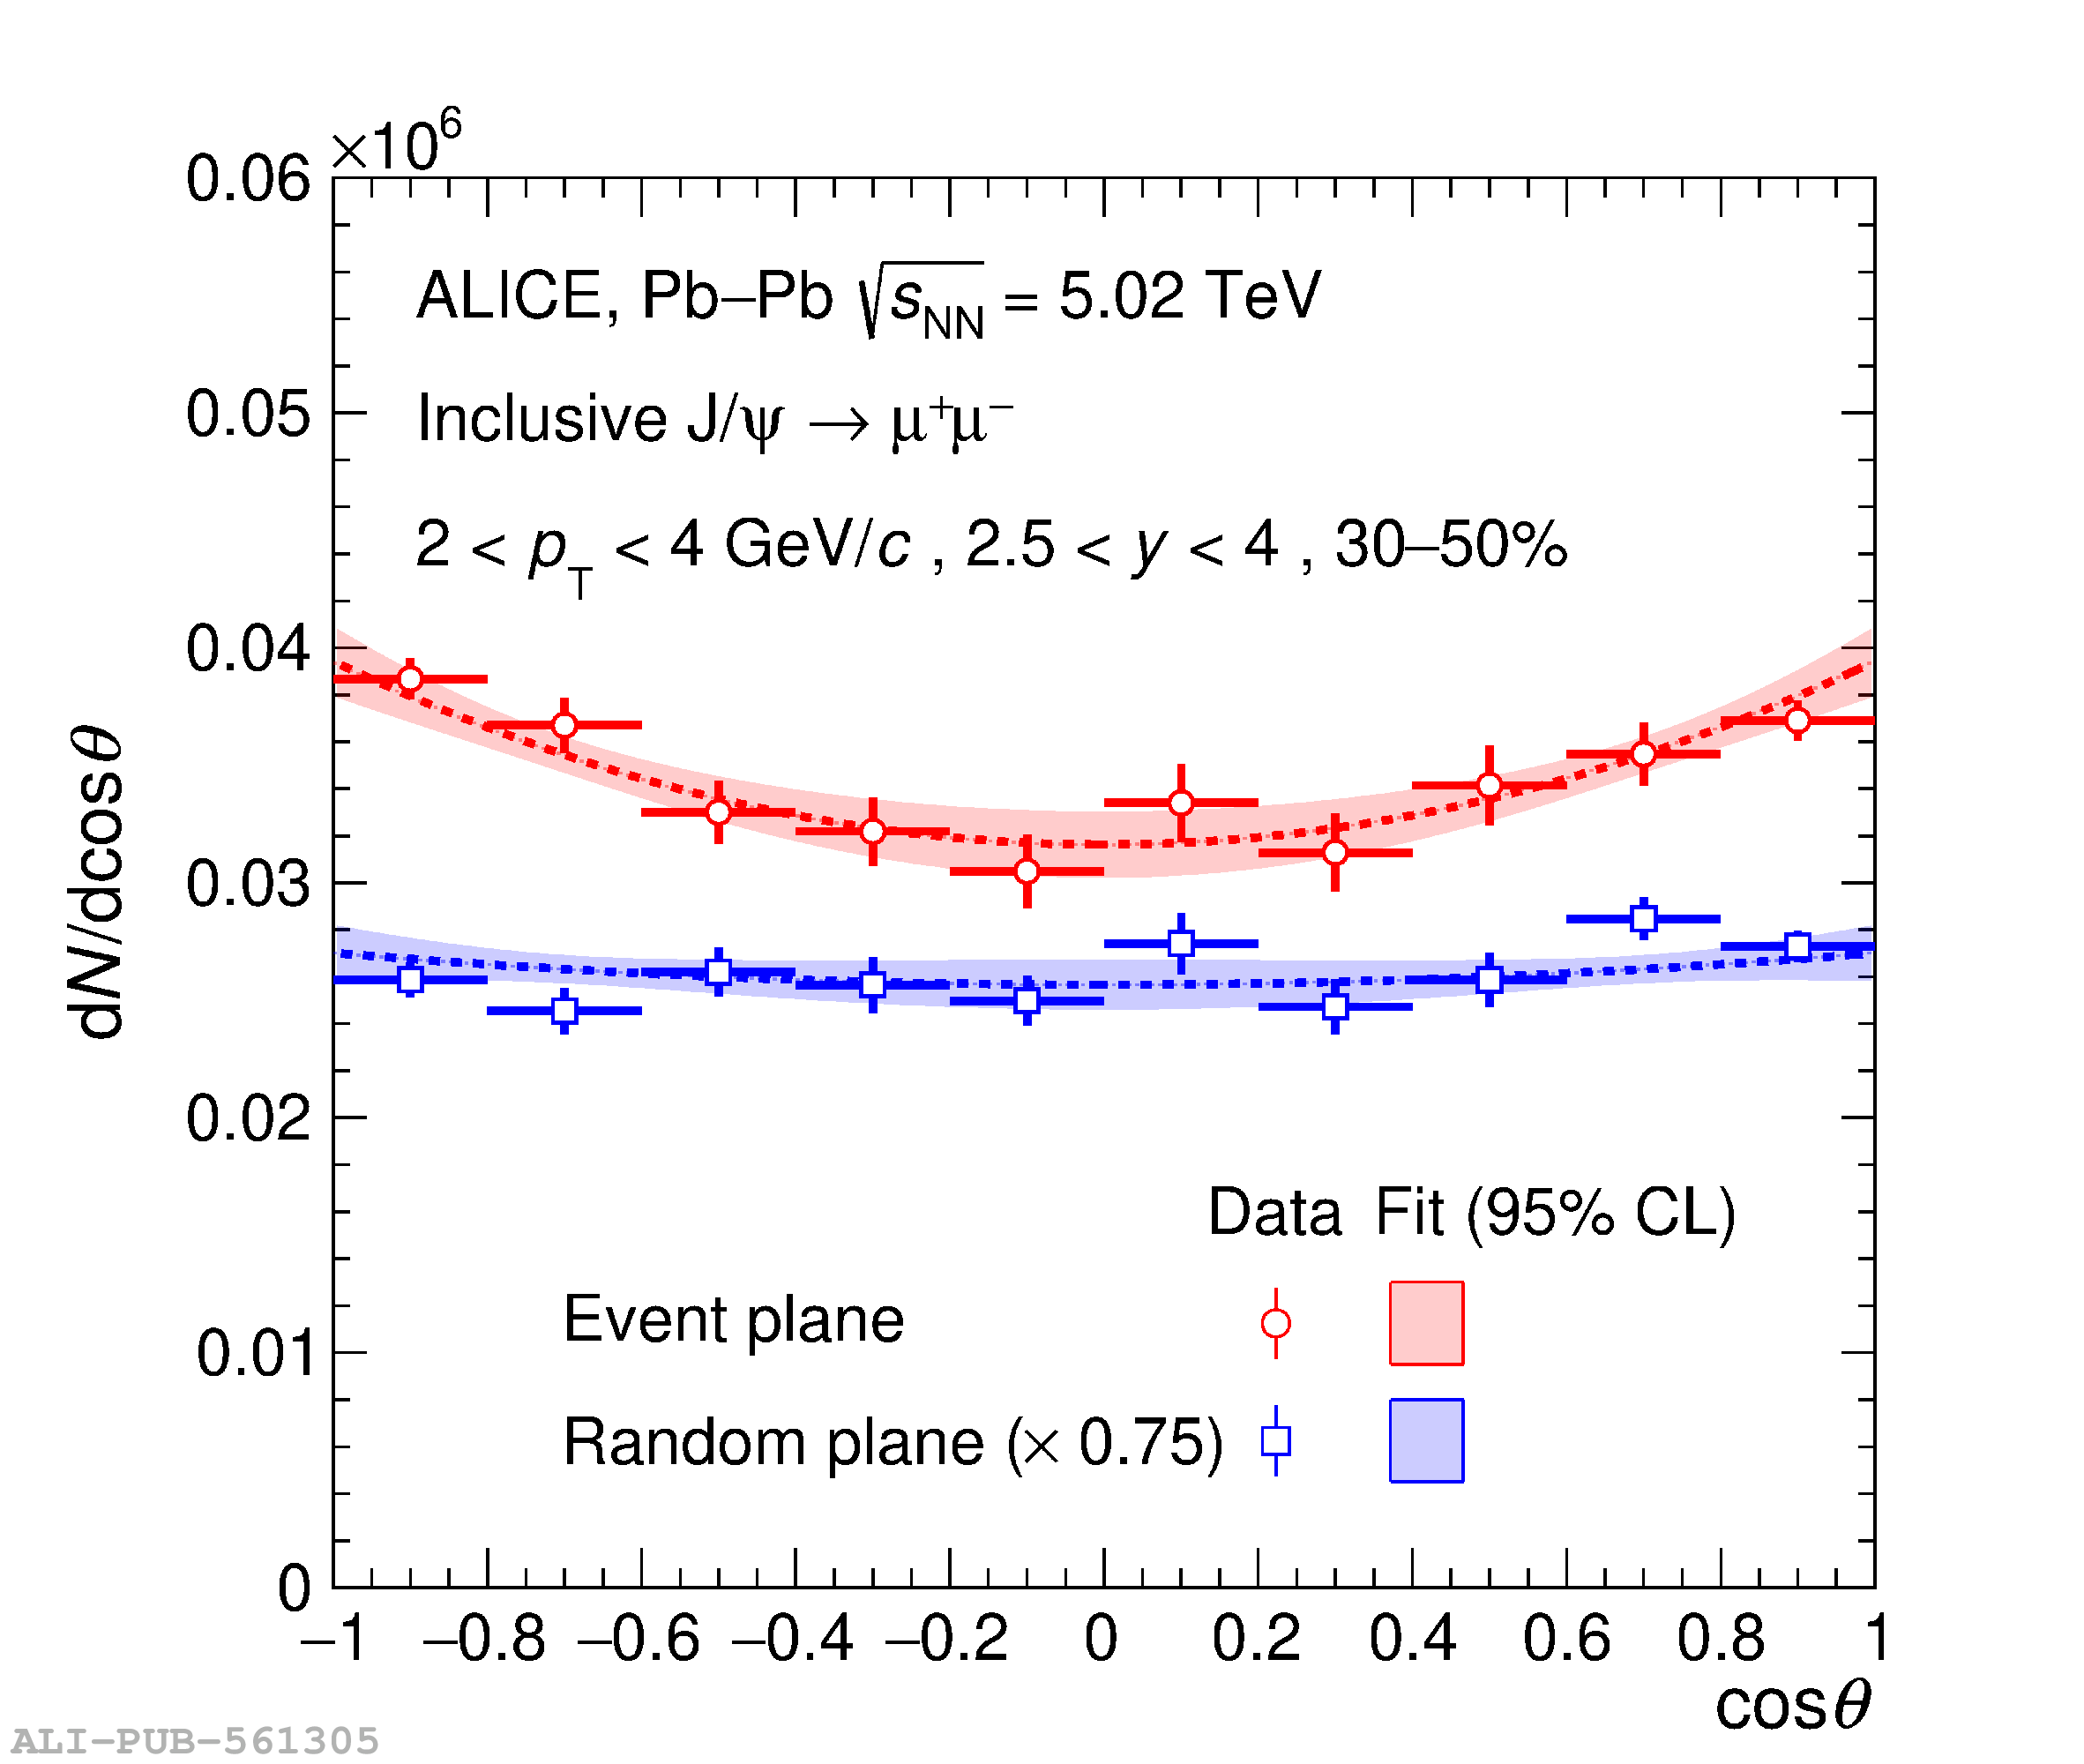 |