Centrality (left panel) and $p_{\rm T}$ dependence (right panel) of $\lambda_{\theta}$. The vertical bars represent the statistical uncertainties, while the boxes correspond to the systematic uncertainties. The horizontal bars show the size of the corresponding centrality and $p_{\rm T}$ ranges, with the data points being located at the center of each interval. | 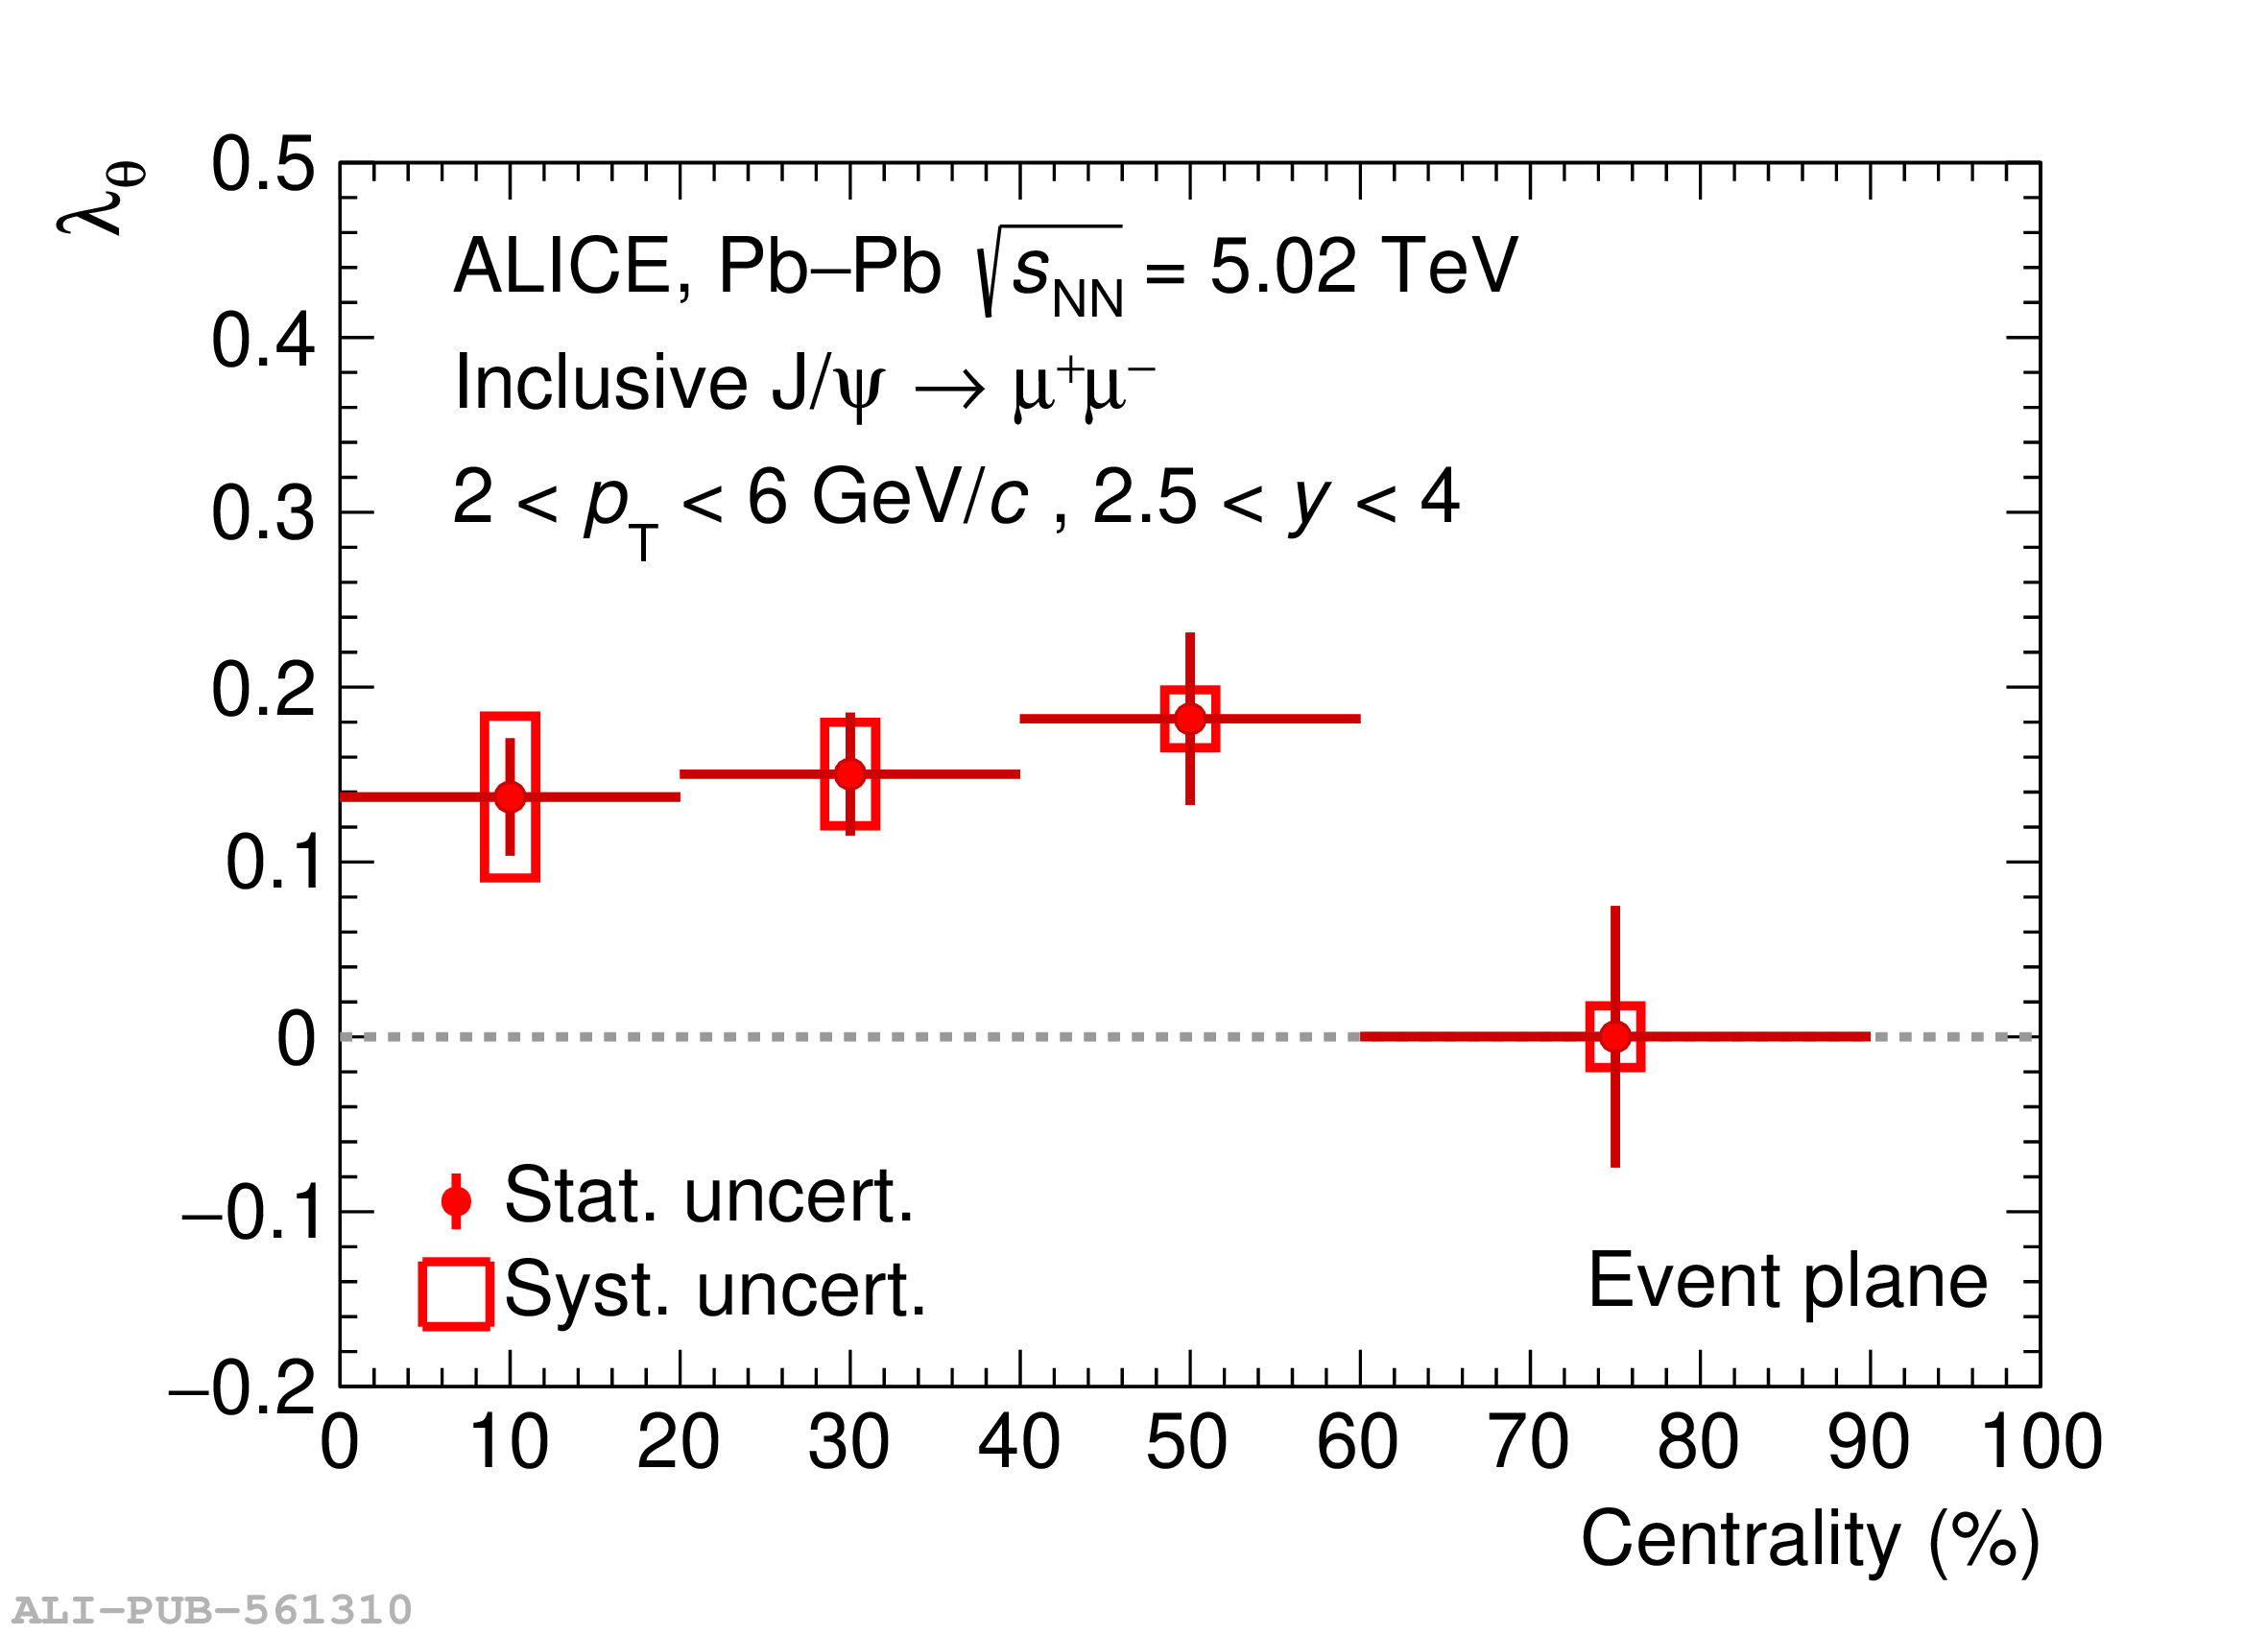  |