We report on results obtained with the Event Shape Engineering technique applied to Pb-Pb collisions at $\sqrt{s_\rm{NN}}=2.76$ TeV. By selecting events in the same centrality interval, but with very different average flow, different initial state conditions can be studied. We find the effect of the event-shape selection on the elliptic flow coefficient $v_2$ to be almost independent of transverse momentum $p_\rm{T}$, as expected if this effect is due to fluctuations in the initial geometry of the system. Charged hadron, pion, kaon, and proton transverse momentum distributions are found to be harder in events with higher-than-average elliptic flow, indicating an interplay between radial and elliptic flow.
Phys. Rev. C 93 (2016) 034916
HEP Data
e-Print: arXiv:1507.06194 | PDF | inSPIRE
CERN-PH-EP-2015-171
Figure 1
Distributions of $q_2^{\rm TPC}$ (top) and $q_2^{\rm V0C}$ (bottom) as a function of centrality (left) and projections for two centrality classes, 0-1% and 30-31% (right). In each of the left panels the solid curve shows the average $q_2$ as a function of centrality, while the dashed and the dotted curves indicate the top 10% and the bottom 10%, respectively. | 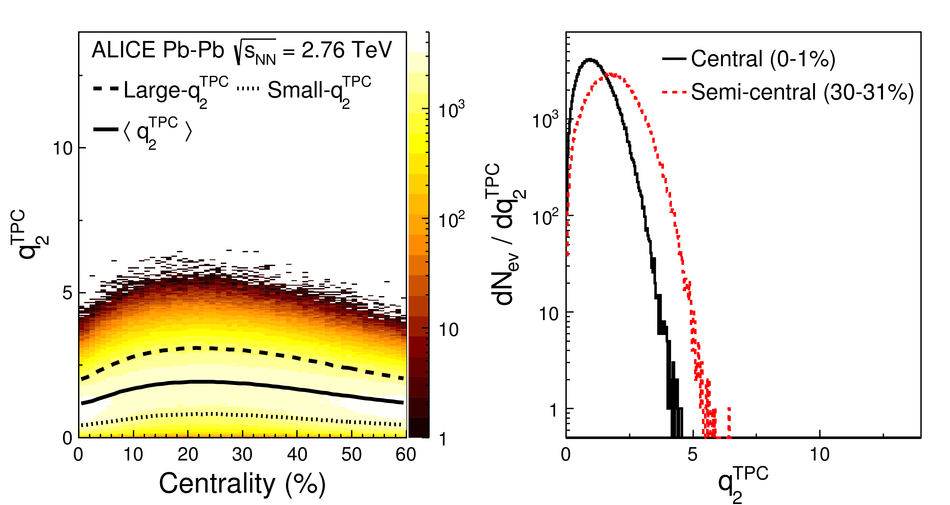 |

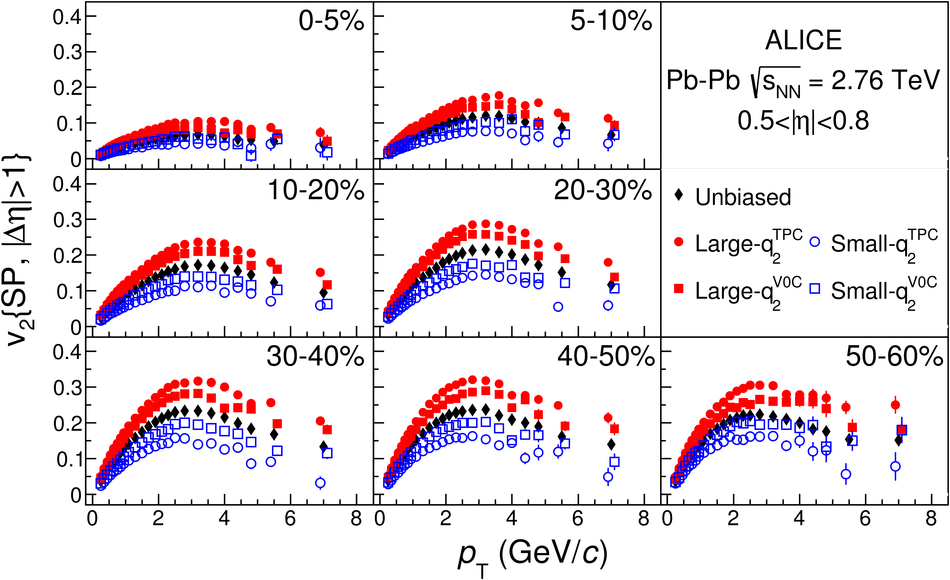

Figure 5
Comparison between the effect of the event-shape selection obtained with the standard V0C and with the tuned TPC selections (see text for details), in the centrality class 30-40%. Top: $v_2\{\rm SP\}$, bottom: ratios to the unbiased sample. Only statistical uncertainties are plotted (systematic uncertainties are smaller than the markers). |  |
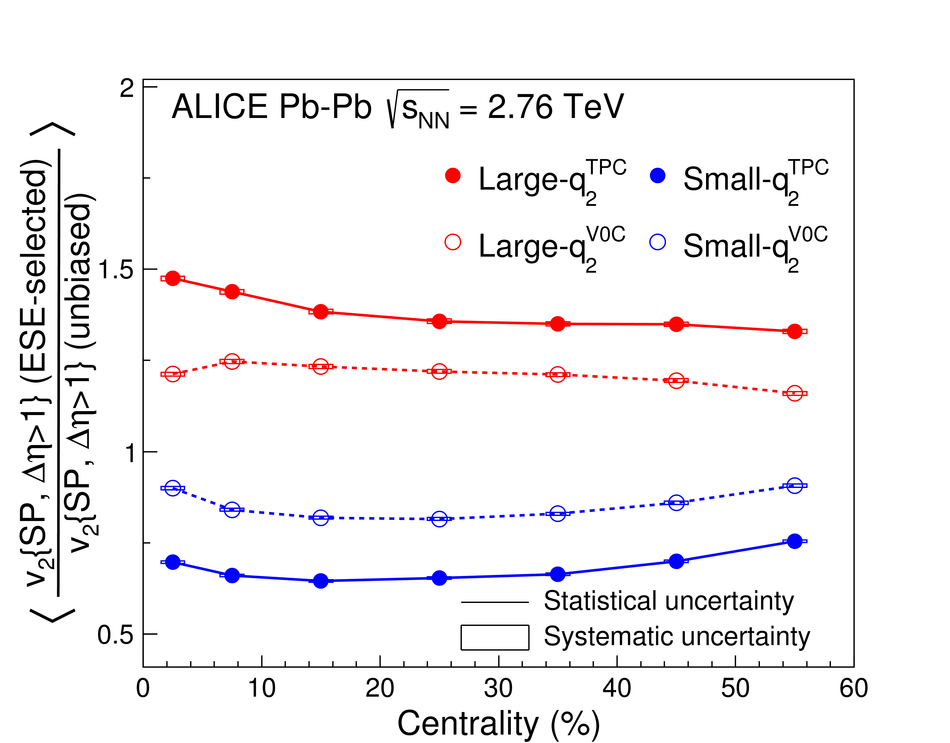
Figure 8
Ratio of the $\pt$ distribution of charged hadrons in the large-$q_2$
or small-$q_2$ sample to the unbiased sample ($q_2^{\rm V0C}$ and $q_2^{\rm TPC}$ selections) in
different centrality classes. Only statistical uncertainties are plotted
(systematic uncertainties are smaller than the markers). | 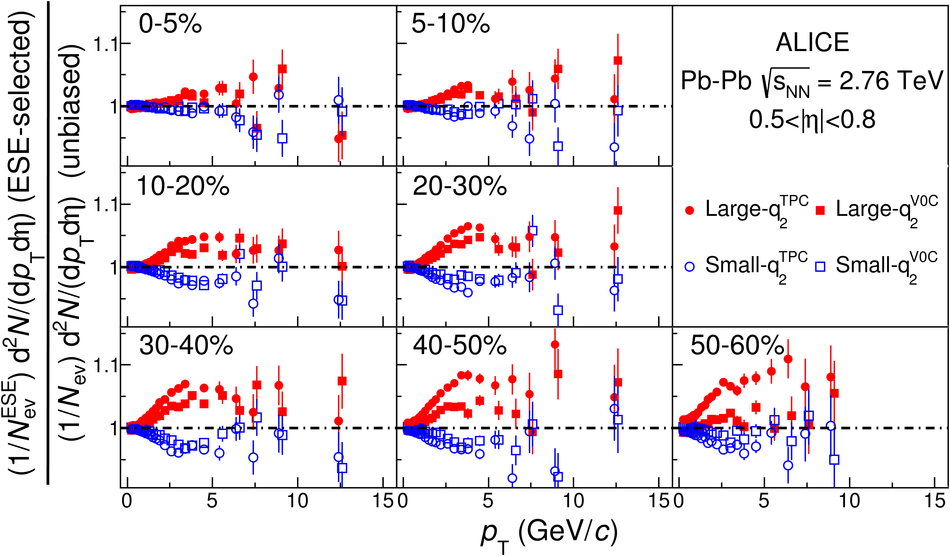 |
Figure 9
Ratio of the $\pt$ distribution of charged hadrons in the large-$q_2$
or small-$q_2$ sample to the unbiased sample. Comparison between the effect of
the event-shape selection obtained with the standard V0C and with
the tuned TPC selections (see text for details), in the centrality
class 30-40%. | 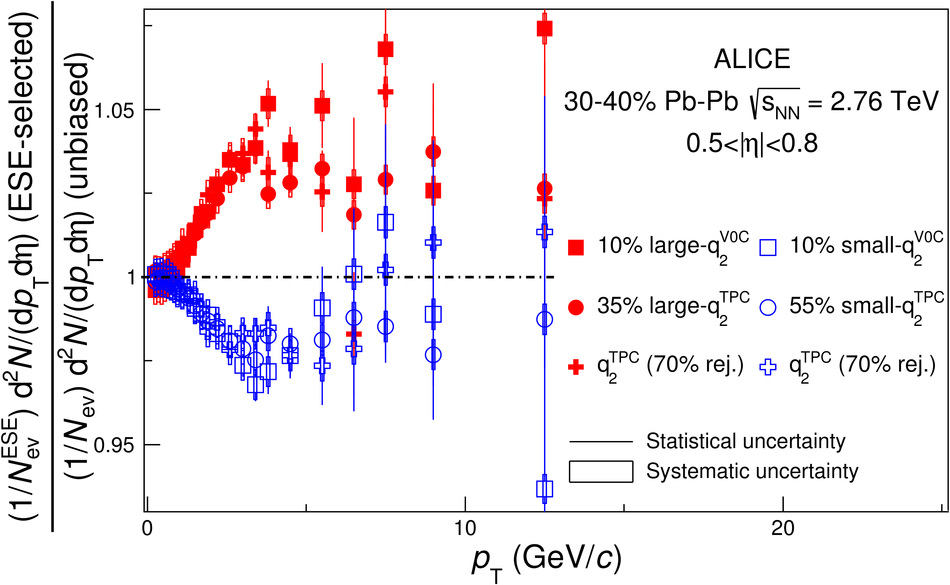 |


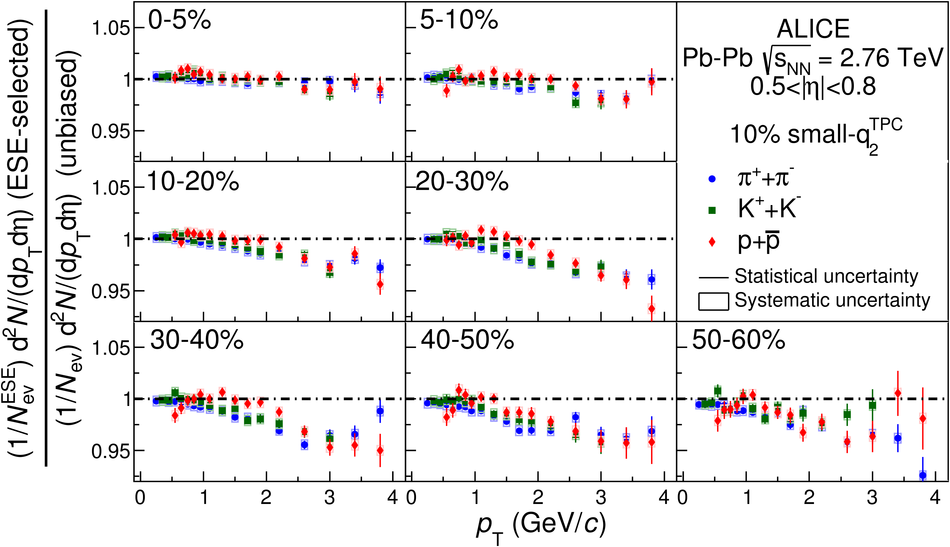
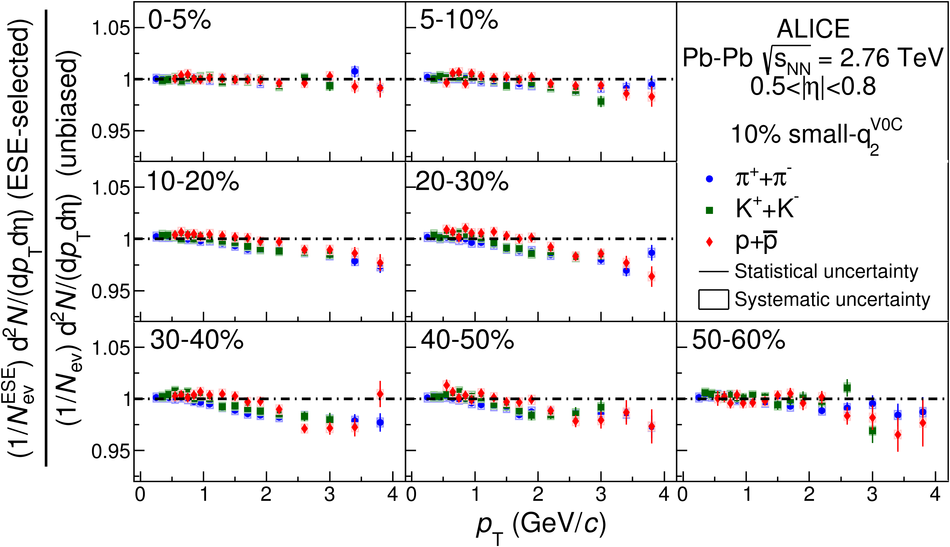
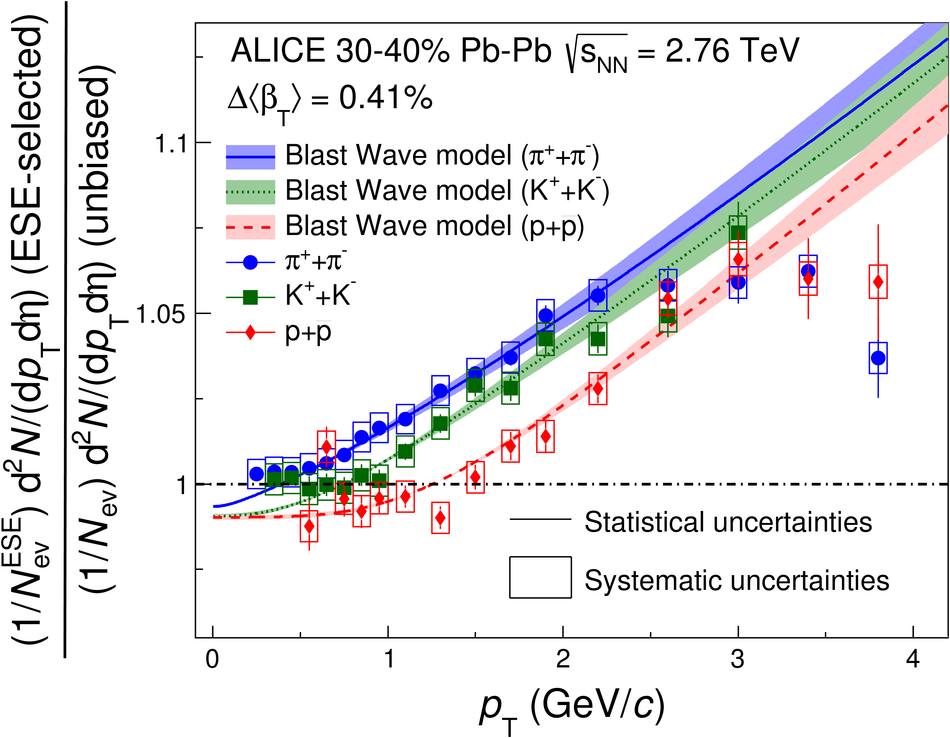
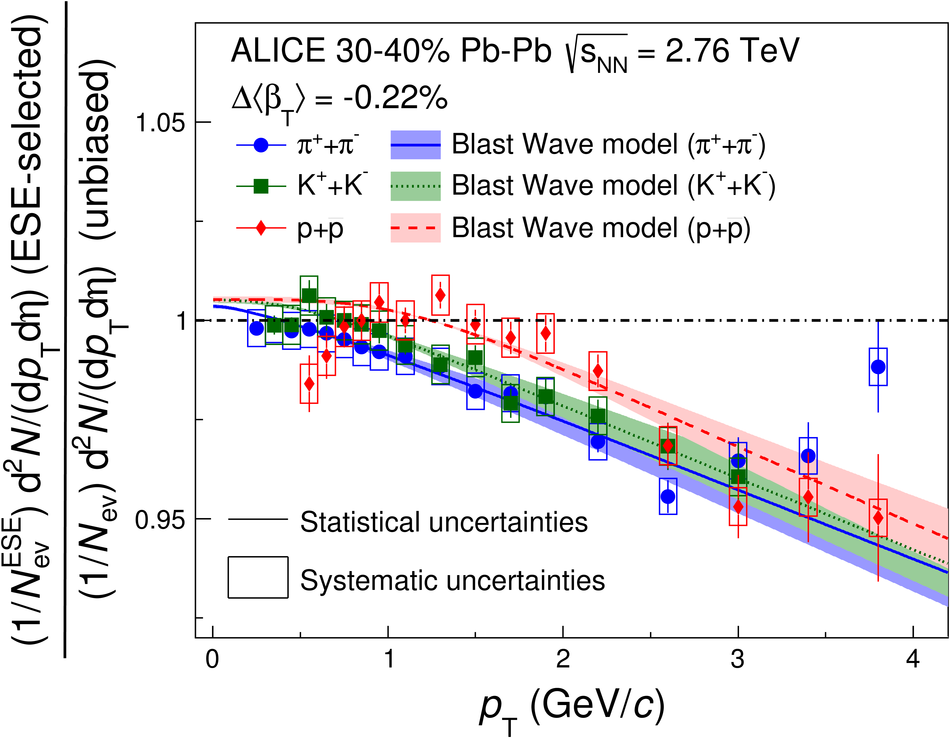
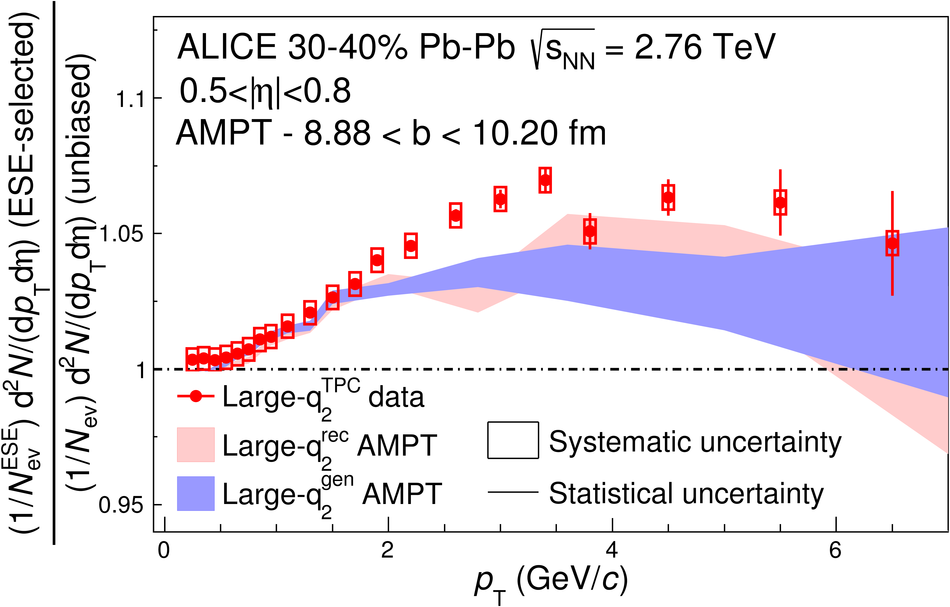
Figure 14
Measurement of $v_2\{\rm SP\}$ as a function of $\pt$, for the unbiased
sample and for the large-$q_2$ sample (top panel) and ratio between the large-$q_2$
result over the unbiased result (bottom panel). Data points (full
markers) are compared with AMPT Monte Carlo model (bands). Only
statistical uncertainties are plotted (systematic uncertainties are
smaller than the markers). | 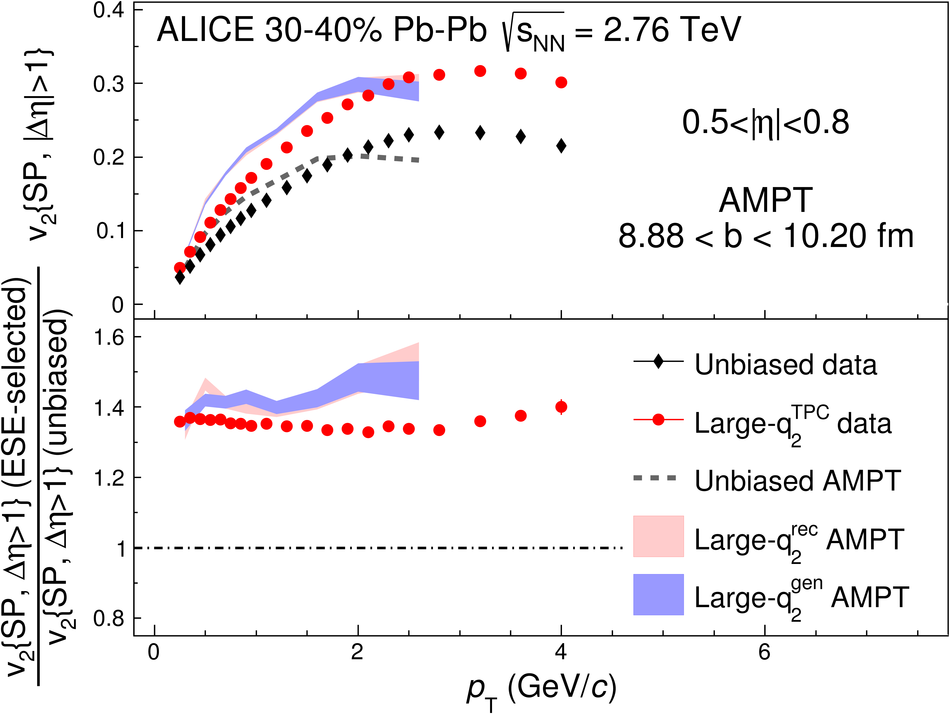 |