Distributions of $q_2^{\rm TPC}$ (top) and $q_2^{\rm V0C}$ (bottom) as a function of centrality (left) and projections for two centrality classes, 0-1% and 30-31% (right). In each of the left panels the solid curve shows the average $q_2$ as a function of centrality, while the dashed and the dotted curves indicate the top 10% and the bottom 10%, respectively. | 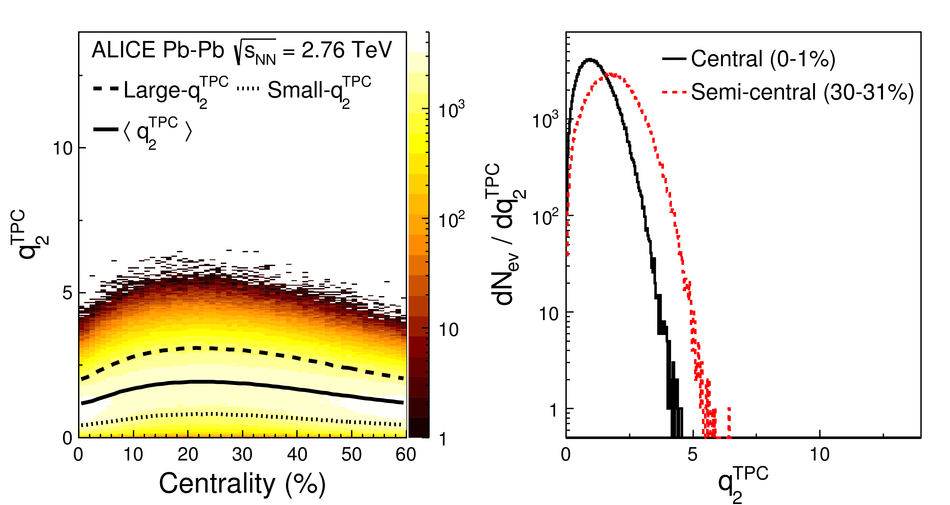 |
