Measurement of $v_2\{\rm SP\}$ as a function of $\pt$, for the unbiased
sample and for the large-$q_2$ sample (top panel) and ratio between the large-$q_2$
result over the unbiased result (bottom panel). Data points (full
markers) are compared with AMPT Monte Carlo model (bands). Only
statistical uncertainties are plotted (systematic uncertainties are
smaller than the markers). | 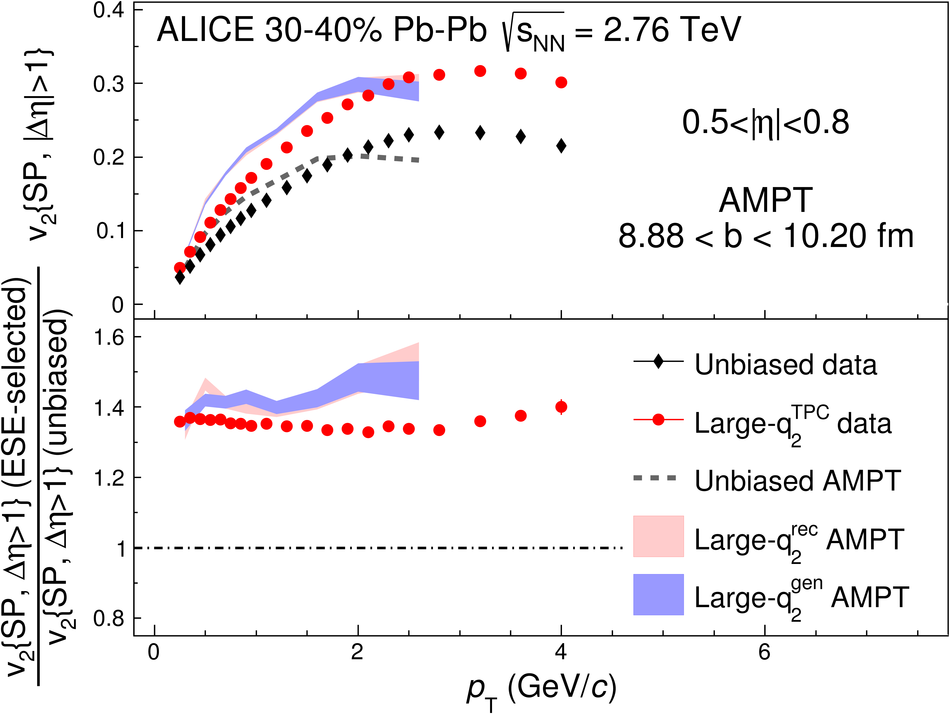 |