Measurements of elliptic ($v_2$) and triangular ($v_3$) flow coefficients of $\pi^{\pm}$, K$^{\pm}$, p+$\rm \overline{p}$, K$^0_{\rm S}$, and $\Lambda + \overline{\Lambda}$ obtained with the scalar product method in Xe-Xe collisions at $\sqrt{s_{\rm NN}}$ = 5.44 TeV are presented. The results are obtained in the rapidity range $\left | y \right |<~0.5$ and reported as a function of transverse momentum, $p_{\rm T}$, for several collision centrality classes. The flow coefficients exhibit a particle mass dependence for $p_{\rm T}<~3$ GeV/$c$, while a grouping according to particle type (i.e., meson and baryon) is found at intermediate transverse momenta (3<~ $p_{\rm T}$ <~8 GeV/$c$). The magnitude of the baryon $v_{2}$ is larger than that of mesons up to $p_{\rm T}$ = 6 GeV/$c$. The centrality dependence of the shape evolution of the $p_{\rm T}$-differential $v_2$ is studied for the various hadron species. The $v_2$ coefficients of $\pi^{\pm}$, K$^{\pm}$, and p+$\rm \overline{p}$ are reproduced by MUSIC hydrodynamic calculations coupled to a hadronic cascade model (UrQMD) for $p_{\rm T} <~1$ GeV/$c$. A comparison with $v_{\rm n}$ measurements in the corresponding centrality intervals in Pb-Pb collisions at $\sqrt{s_{\rm NN}}$ = 5.02 TeV yields an enhanced $v_2$ in central collisions and diminished value in semicentral collisions.
JHEP 10 (2021) 152
HEP Data
e-Print: arXiv:2107.10592 | PDF | inSPIRE
CERN-EP-2021-149
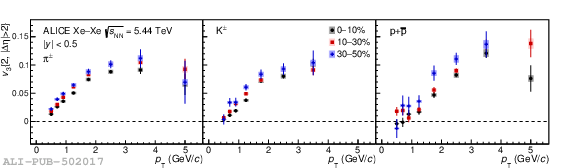
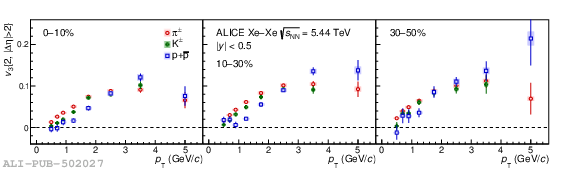


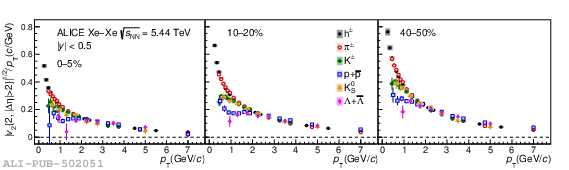
Figure 11
The $\pt$-differential $v_2$ of \pipm{}, \kapm{}, and p+\pbar{} for various centrality classes compared to hydrodynamic calculations from MUSIC model using IP-Glasma initial conditions (colored curves) . Bars (boxes) denote statistical (systematic) uncertainties. The uncertainties of the hydrodynamic calculations are depicted by the thickness of the curves. The ratios of the measured $v_2$ to a fit to the hydrodynamic calculations are also presented for clarity. | 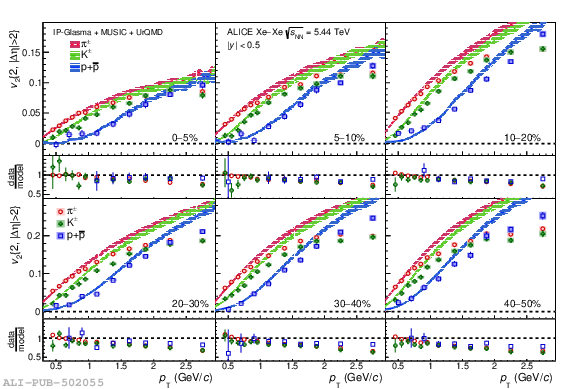 |
Figure 12
The $\pt$-differential $v_3$ of \pipm{}, \kapm{}, and p+\pbar{} (black markers) compared to ALICE measurements performed in Pb--Pb collisions at $\sqrt{s_{\rm NN}}$ = 5.02 TeV (red markers) for the 0--10\% (top panels), 10--30\% (middle panels), and 30--50\% (bottom panels) centrality classes. The ratios of Xe--Xe measurements to a cubic spline fit to Pb--Pb measurements are also presented for clarity. Bars (boxes) denote statistical (systematic) uncertainties. | 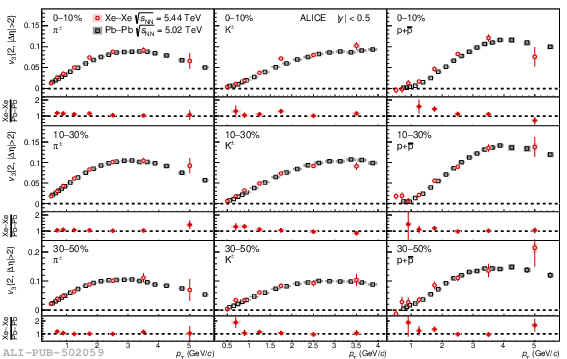 |
Figure 13
The \vtwomax{} for \pipm{} and p+\pbar{} (black markers) compared to ALICE measurements performed in Pb--Pb collisions at $\sqrt{s_{\rm NN}}$ = 5.02 TeV (red markers) as a function of centrality (left) and charged-particle density (right) . The Pb--Pb points are slightly shifted along the horizontal axis for better visibility in both panels. Bars (boxes) denote statistical (systematic) uncertainties. | 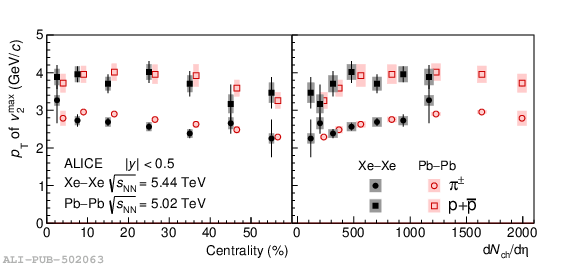 |