The \vtwomax{} for \pipm{} and p+\pbar{} (black markers) compared to ALICE measurements performed in Pb--Pb collisions at $\sqrt{s_{\rm NN}}$ = 5.02 TeV (red markers) as a function of centrality (left) and charged-particle density (right) . The Pb--Pb points are slightly shifted along the horizontal axis for better visibility in both panels. Bars (boxes) denote statistical (systematic) uncertainties. | 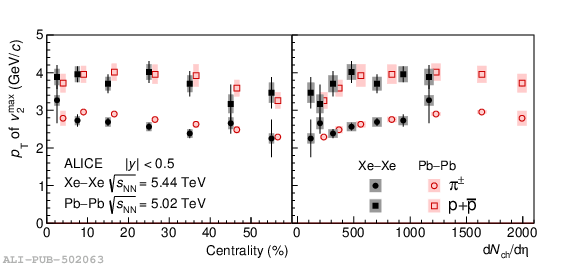 |