The $\pt$-differential $v_2$ of \pipm{}, \kapm{}, and p+\pbar{} for various centrality classes compared to hydrodynamic calculations from MUSIC model using IP-Glasma initial conditions (colored curves) . Bars (boxes) denote statistical (systematic) uncertainties. The uncertainties of the hydrodynamic calculations are depicted by the thickness of the curves. The ratios of the measured $v_2$ to a fit to the hydrodynamic calculations are also presented for clarity. | 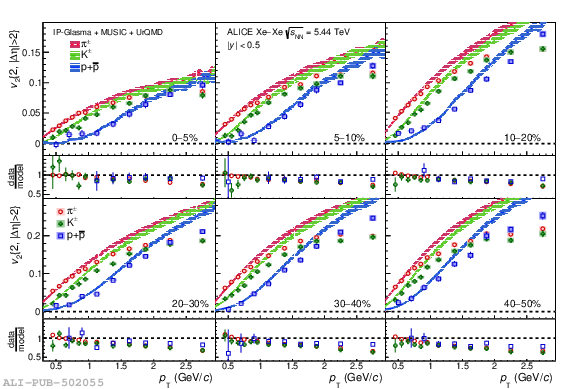 |