The second ($v_2$) and third ($v_3$) flow harmonic coefficients of J/$\psi$ mesons are measured at forward rapidity (2.5 $<~$ $y$ $<~$ 4.0) in Pb-Pb collisions at $\sqrt{s_{\rm NN}}$ = 5.02 TeV with the ALICE detector at the LHC. Results are obtained with the scalar product method and reported as a function of transverse momentum, $p_{\rm{T}}$, for various collision centralities. A positive value of J/$\psi$ $v_3$ is observed with 3.7$\sigma$ significance. The measurements, compared to those of prompt D$^0$ mesons and charged particles at mid-rapidity, indicate an ordering with $v_{\rm n}$(J/$\psi$) $<~v_{\rm n}$(D$^0$) $<~v_{\rm n}$(h$^\pm$) (n = 2, 3) at low and intermediate $p_{\rm{T}}$ up to 6 GeV/$c$ and a convergence with $v_2$(J/$\psi$) $\approx v_2$(D$^0$) $\approx v_2$(h$^\pm$) at high $p_{\rm{T}}$ above 6-8 GeV/$c$. In semi-central collisions (5-40% and 10-50% centrality intervals) at intermediate $p_{\rm{T}}$ between 2 and 6 GeV/$c$, the ratio $v_3/v_2$ of J/$\psi$ mesons is found to be significantly lower (4.6$\sigma$) with respect to that of charged particles. In addition, the comparison to the prompt D$^0$-meson ratio in the same $p_{\rm{T}}$ interval suggests an ordering similar to that of the $v_2$ and $v_3$ coefficients. The J/$\psi$ $v_2$ coefficient is further studied using the Event Shape Engineering technique. The obtained results are found to be compatible with the expected variations of the eccentricity of the initial-state geometry.
JHEP 1902 (2019) 012
HEP Data
e-Print: arXiv:1811.12727 | PDF | inSPIRE
Figure 1
The $M_{\mu\mu}$ distribution in low (top panels), intermediate (middle panels) and high (bottom panels) $p_{\rm T}$ intervals for central (left panels) and semi-central (right panels) collisions. The data are fitted to a combination of an extended Crystal Ball (CB2) function for the signal and a Variable-Width Gaussian (VWG) function for the background. The distributions are compared to the ones obtained with the event-mixing technique (see text for details). Only statistical uncertainties are shown. | 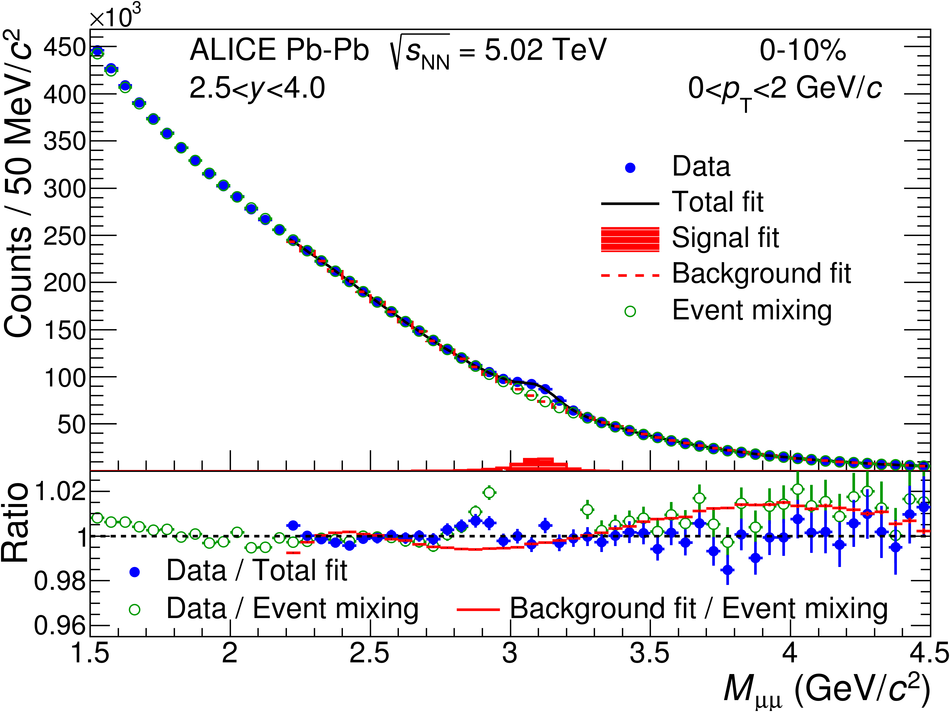 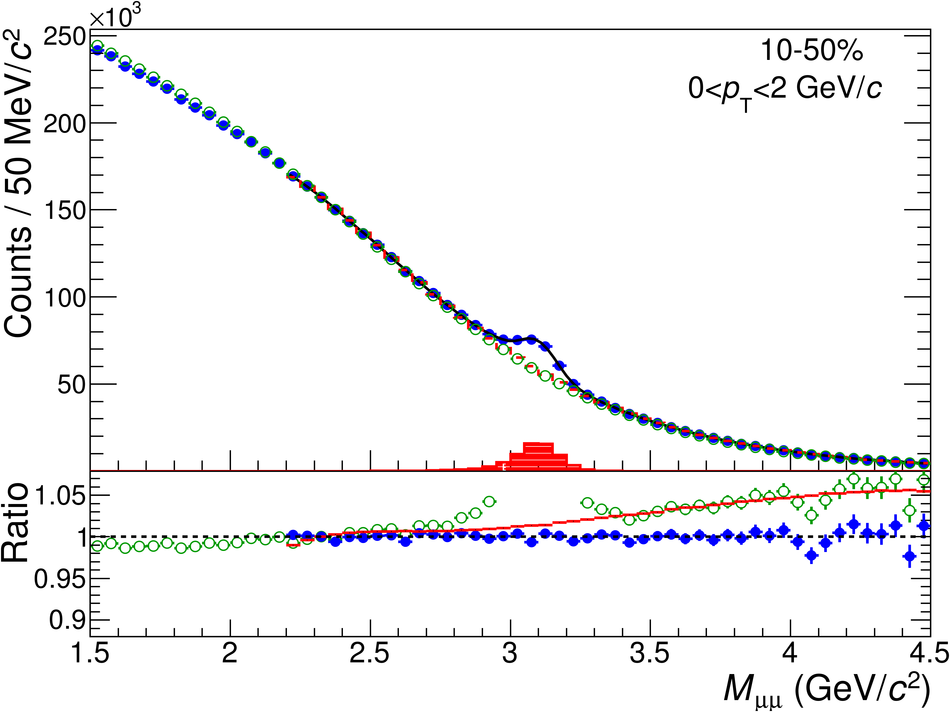    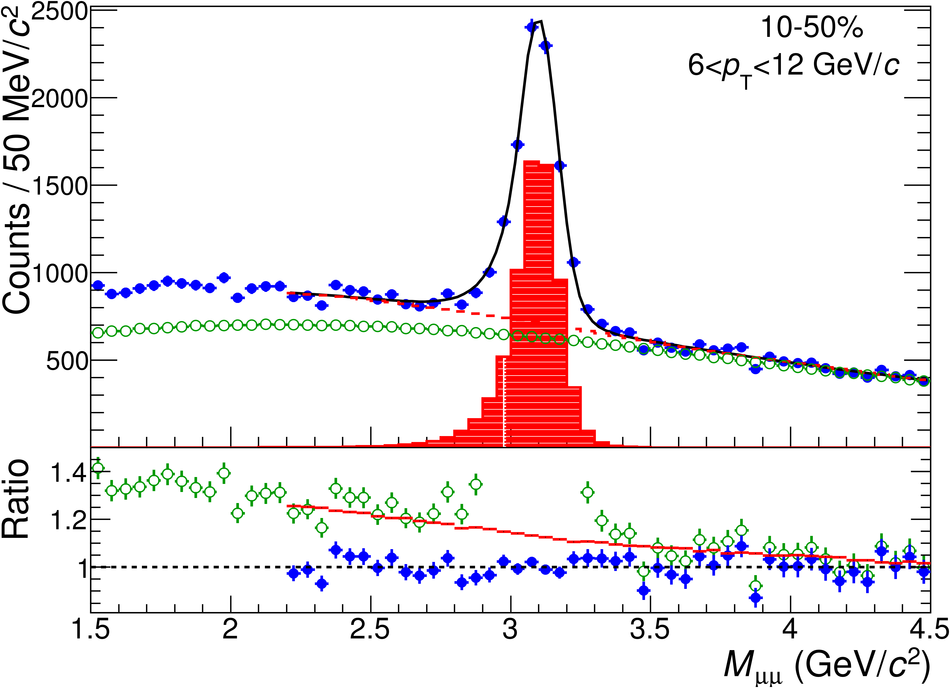 |
Figure 2
The $v_2(M_{\mu\mu})$ distribution in low (top panels), intermediate (middle panels) and high (bottom panels) $p_{\rm T}$ intervals for central (left panels) and semi-central (right panels) collisions. The data are fitted with the function from Eq. \ref{eq:vn_sb}, where the background coefficient $v_2^{\rm B}(M_{\mu\mu})$ is fixed using the event-mixing procedure. The background coefficient $v_2^{\rm B}(M_{\mu\mu})$ alone down to 1.5 GeV/$c^2$ is also presented. Only statistical uncertainties are shown. | 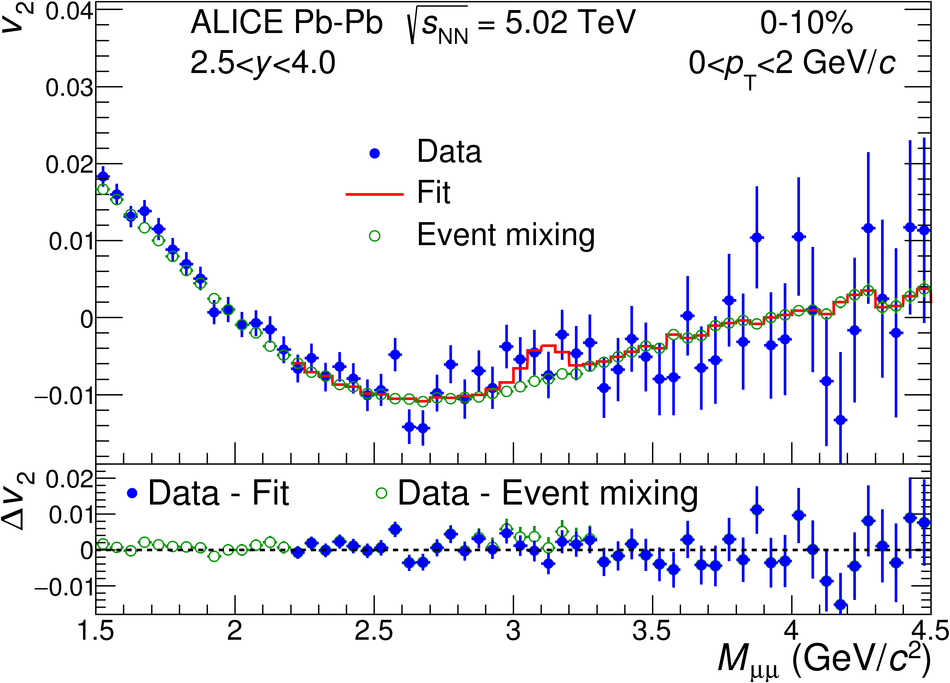 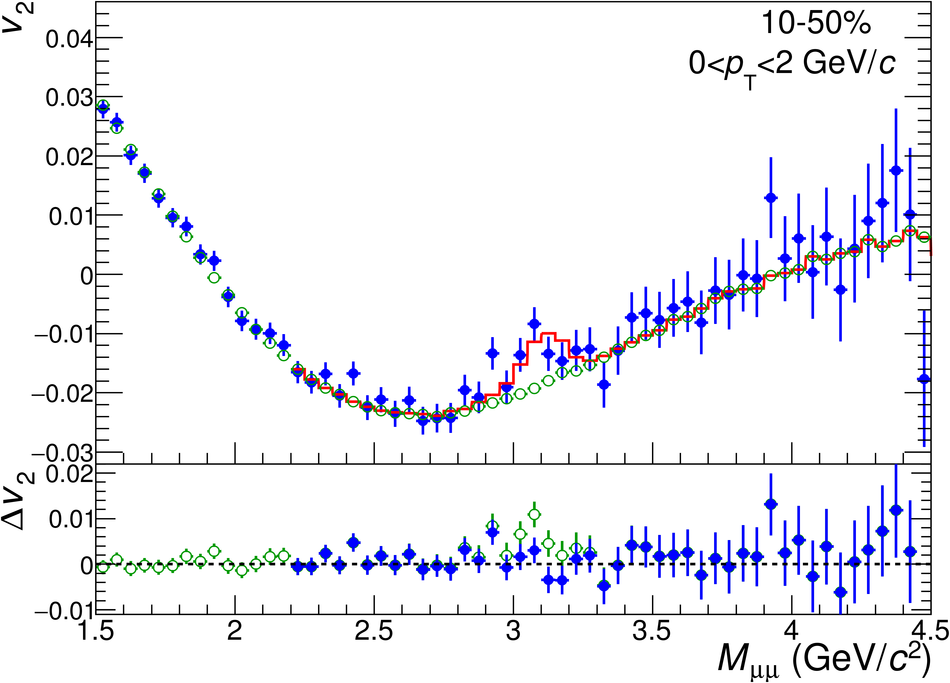 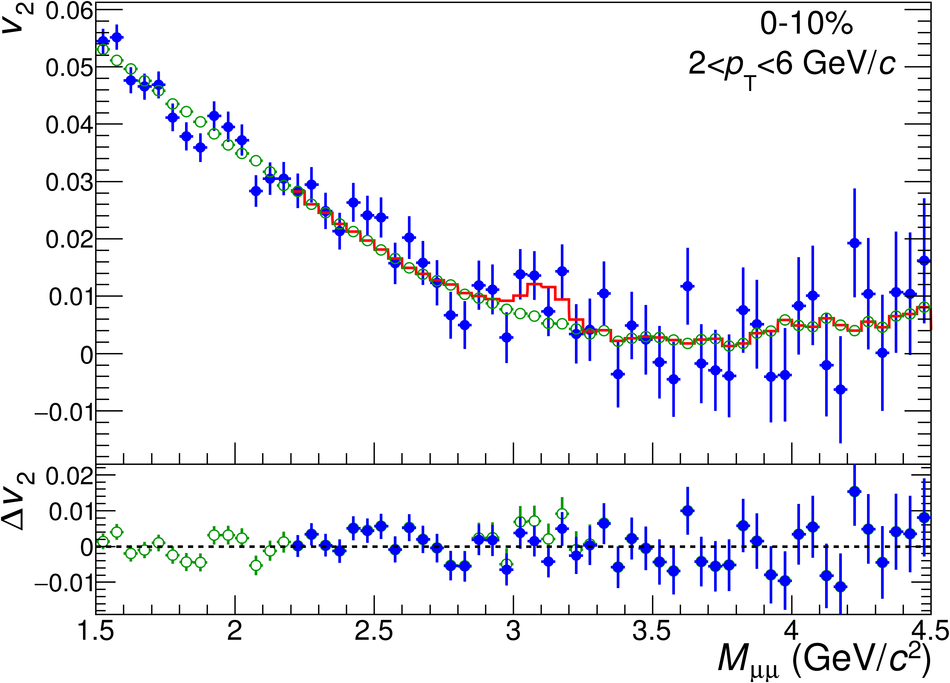 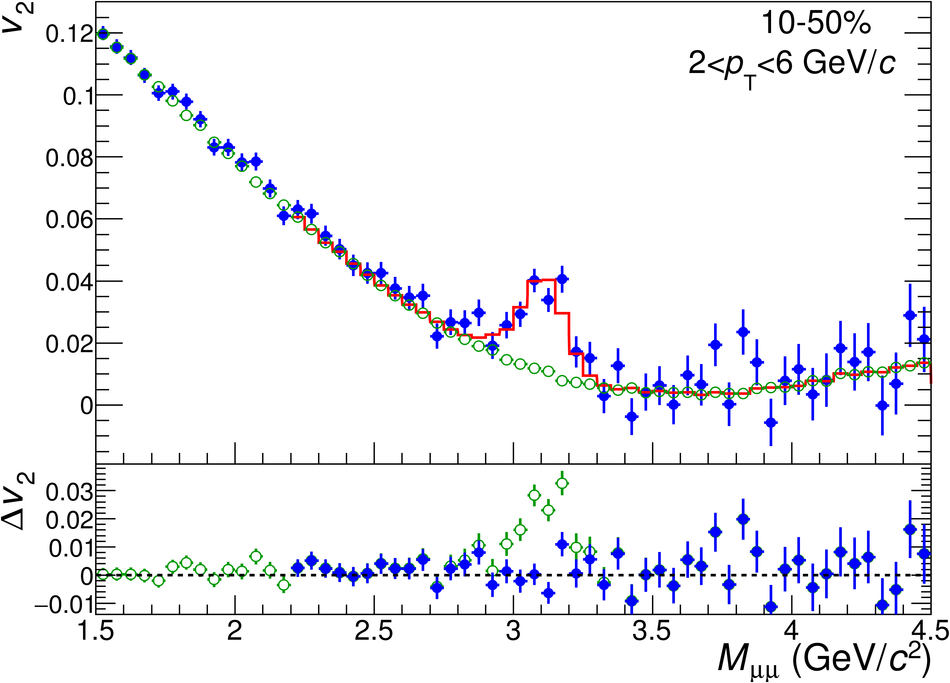  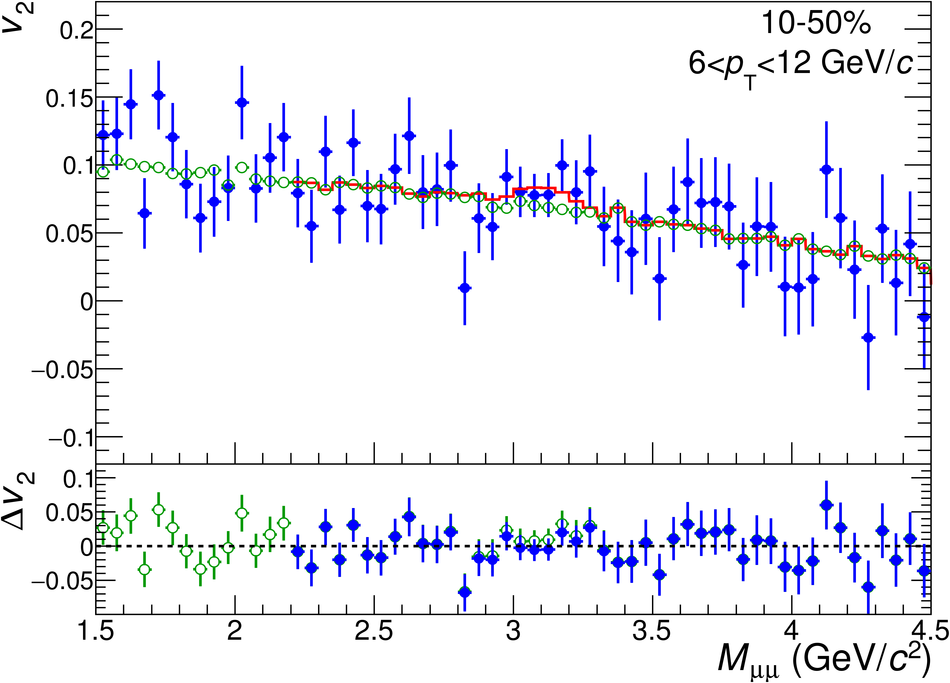 |
Figure 3
The $v_2(M_{\mu\mu})$ (left panel) and $v_3(M_{\mu\mu})$ (right panel) distributions in the 0--50\ are fitted with the function from Eq. \ref{eq:vn_sb}, where the background coefficients $v_2^{\rm B}(M_{\mu\mu})$ and $v_3^{\rm B}(M_{\mu\mu})$ are fixed using the event-mixing procedure. The background coefficients alone down to 1.5 GeV/$c^2$ are also presented. Only statistical uncertainties are shown. | 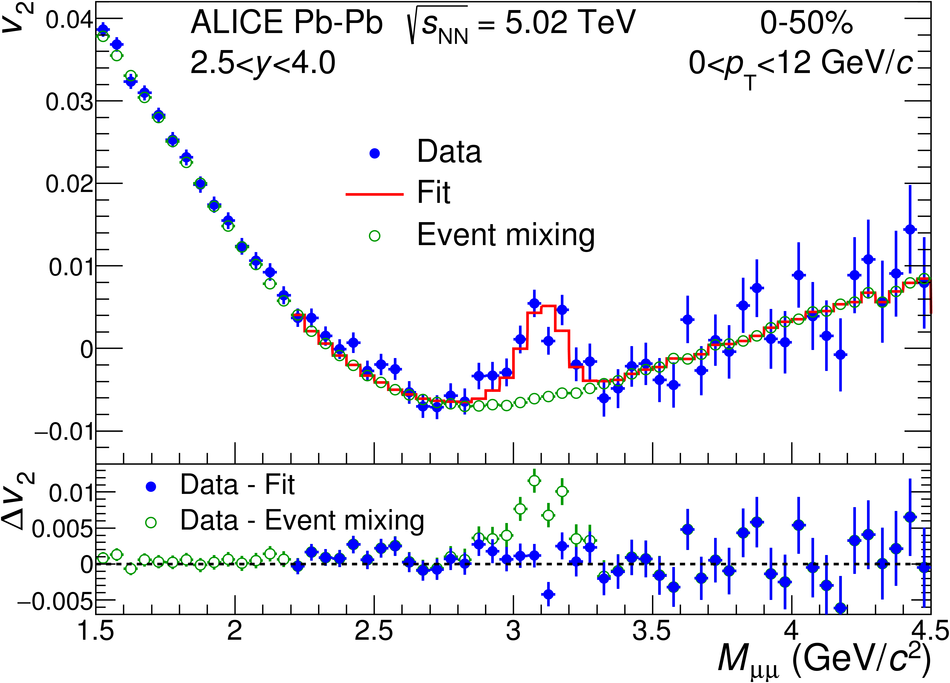 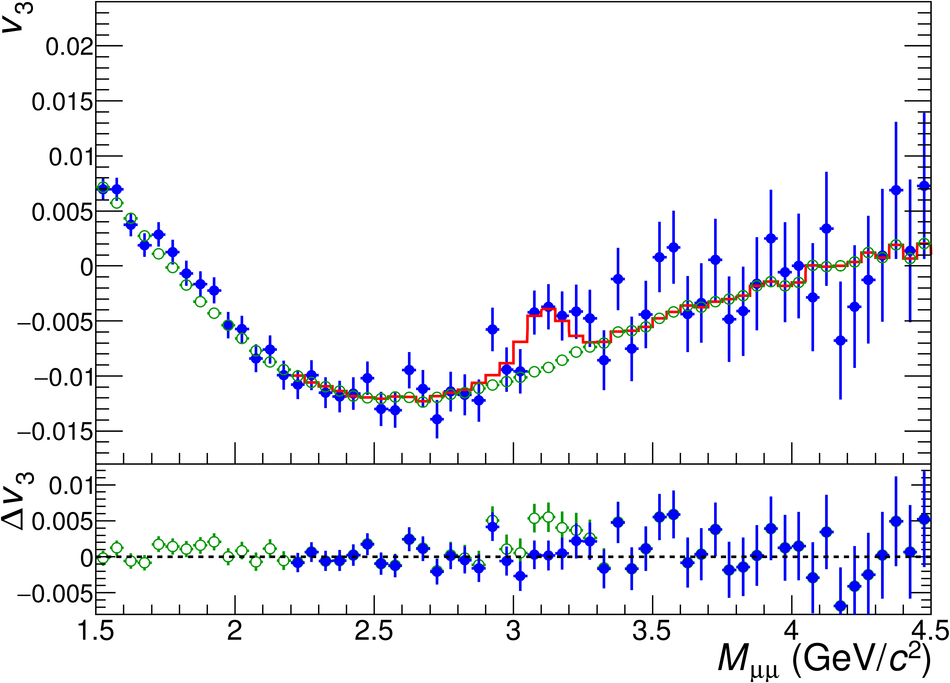 |
Figure 4
The \jpsi\ $v_2$ (upper panels) and $v_3$ (bottom panels) coefficients as a function of $p_{\rm T}$ in three centrality intervals (from left to right) in Pb--Pb collisions at $\sqrt{s_{\rm NN}}$ = 5.02 TeV. The results are compared to the $v_2$ and $v_3$ coefficients of mid-rapidity charged particles and prompt D$^0$ mesons . Statistical and systematic uncertainties are shown as bars and boxes, respectively. The shaded bands represent the systematic uncertainties from the contribution of non-prompt D$^0$ mesons. | 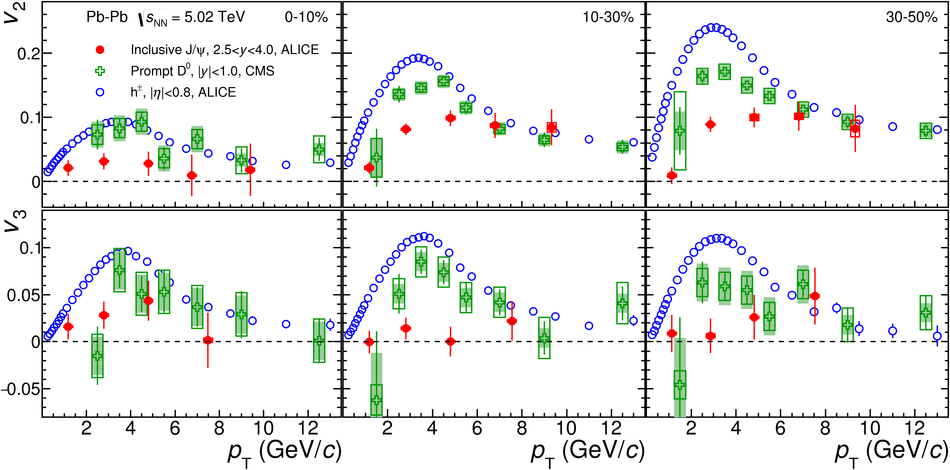 |
Figure 6
The \jpsi\ $v_3$/$v_2$ ratio as a function of $p_{\rm T}$ in the 5--40\ and 10--50\ The results are compared to those of mid-rapidity charged particles and prompt D$^0$ mesons . Statistical and systematic uncertainties are shown as bars and boxes, respectively. The shaded bands represent the systematic uncertainties from the contribution of non-prompt D$^0$ mesons. | 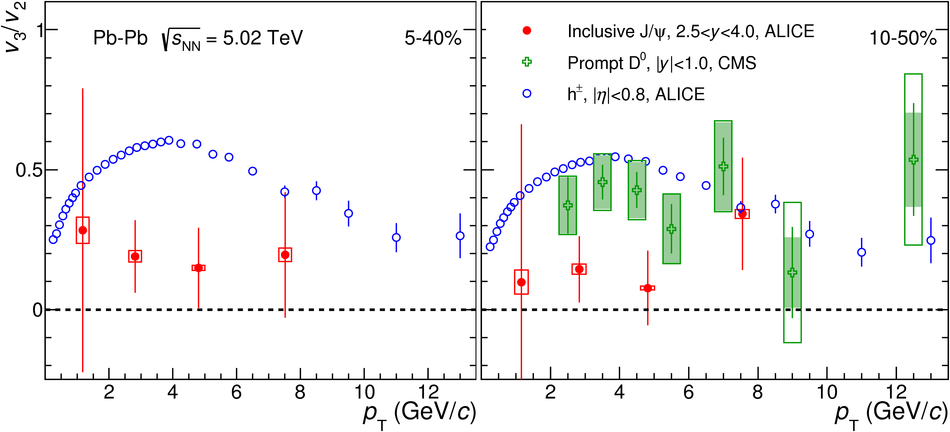 |
Figure 7
Left: The \jpsi\ $v_2$ as a function of $p_{\rm T}$ for shape selected and unbiased samples in the 5--40\ Pb--Pb collisions at $\sqrt{s_{\rm NN}}$ = 5.02 TeV. Points are slightly shifted along the horizontal axis for better visibility. Statistical and systematic uncertainties are shown as bars and boxes, respectively. Right: Ratio of the \jpsi\ $v_2$ in lowest and highest $q_2^{\rm V0A}$ event-shape classes and the unbiased sample The shaded bands represent the result with a constant function $\pm$1$\sigma$ The \jpsi\ results are compared to the ratios for the single muons $v_2$ obtained with the same event-shape classes. | 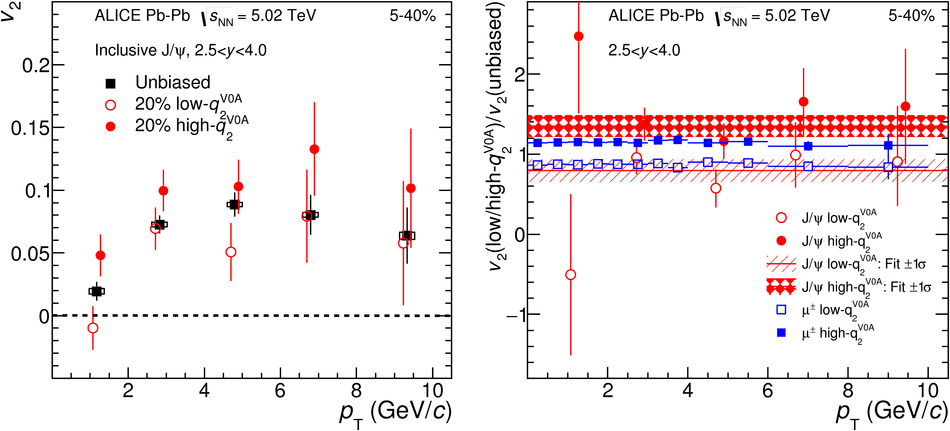 |