The $M_{\mu\mu}$ distribution in low (top panels), intermediate (middle panels) and high (bottom panels) $p_{\rm T}$ intervals for central (left panels) and semi-central (right panels) collisions. The data are fitted to a combination of an extended Crystal Ball (CB2) function for the signal and a Variable-Width Gaussian (VWG) function for the background. The distributions are compared to the ones obtained with the event-mixing technique (see text for details). Only statistical uncertainties are shown. | 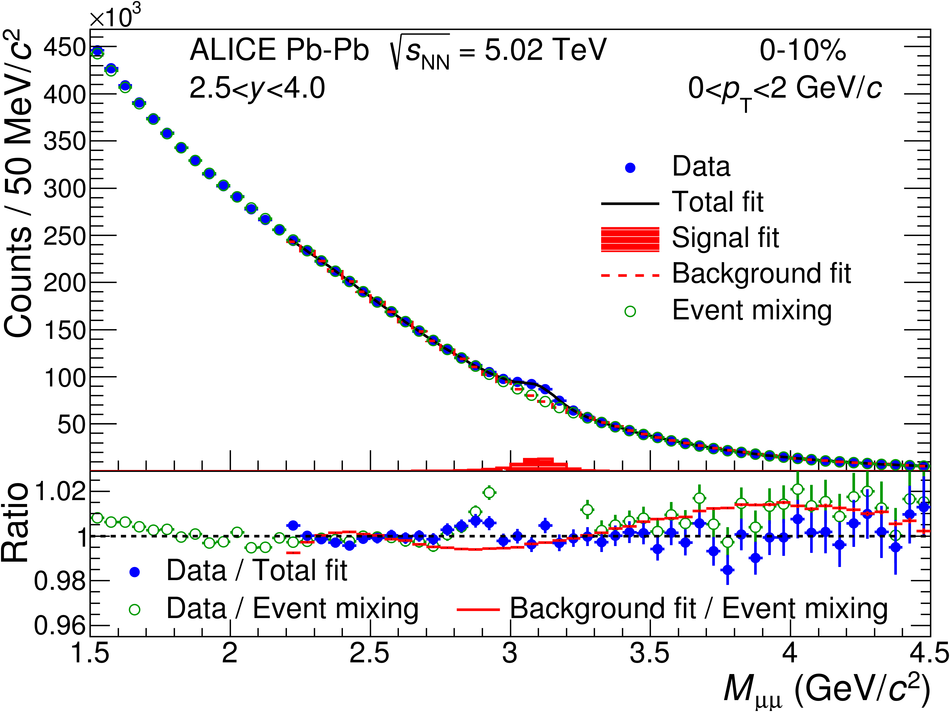 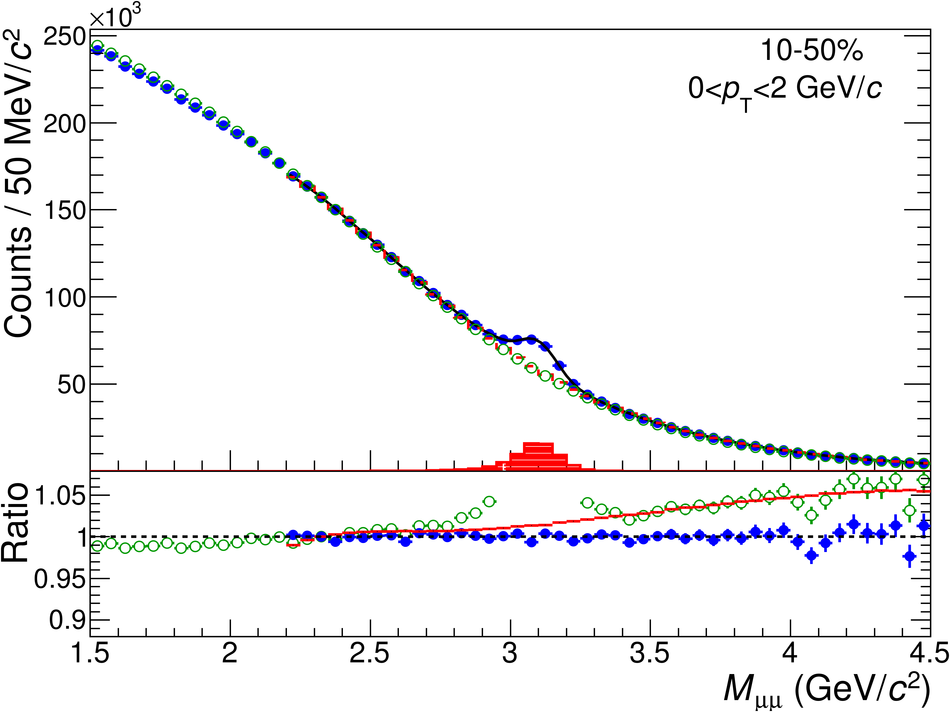    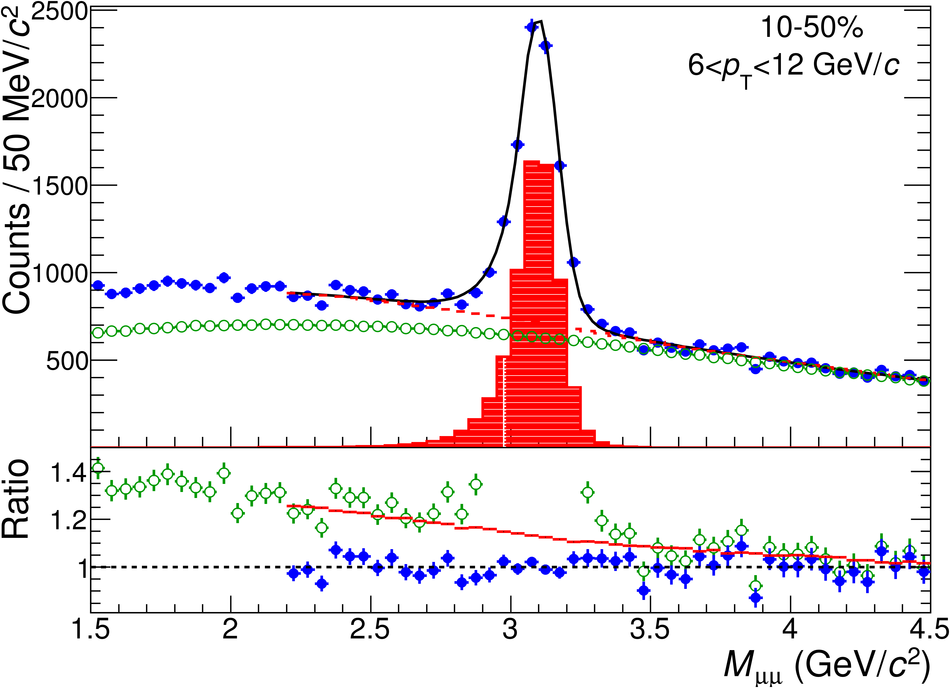 |