The \jpsi\ $v_3$/$v_2$ ratio as a function of $p_{\rm T}$ in the 5--40\ and 10--50\ The results are compared to those of mid-rapidity charged particles and prompt D$^0$ mesons . Statistical and systematic uncertainties are shown as bars and boxes, respectively. The shaded bands represent the systematic uncertainties from the contribution of non-prompt D$^0$ mesons. | 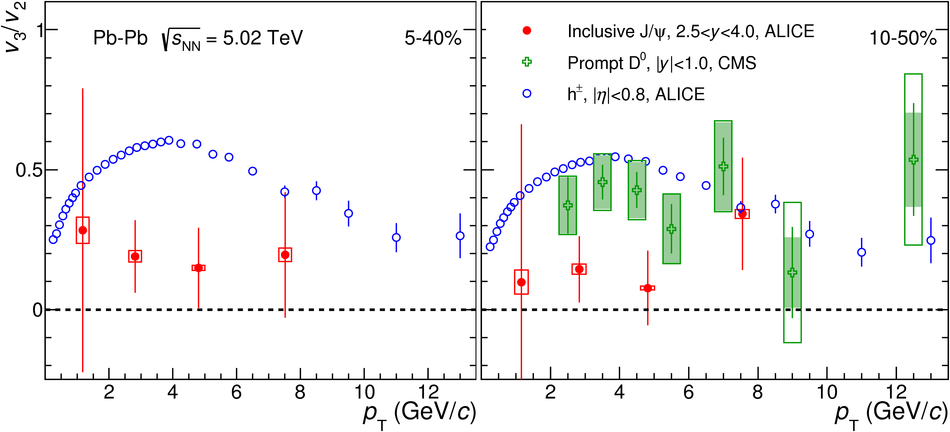 |