The inclusive J/$\psi$ production in Pb-Pb collisions at the center-of-mass energy per nucleon pair $\sqrt{s_{\rm{NN}}}$ = 5.02 TeV, measured with the ALICE detector at the CERN LHC, is reported. The J/$\psi$ meson is reconstructed via the dimuon decay channel at forward rapidity ($2.5<~y<~4$) down to zero transverse momentum. The suppression of the J/$\psi$ yield in Pb-Pb collisions with respect to binary-scaled pp collisions is quantified by the nuclear modification factor ($R_{\rm{AA}}$). The $R_{\rm{AA}}$ at $\sqrt{s_{\rm{NN}}}$ = 5.02 TeV is presented and compared with previous measurements at $\sqrt{s_{\rm{NN}}}$ = 2.76 TeV as a function of the centrality of the collision, and of the J/$\psi$ transverse momentum and rapidity. The inclusive J/$\psi$ $R_{\rm{AA}}$ shows a suppression increasing toward higher $p_{\rm{T}}$, with a steeper dependence for central collisions. The modification of the J/$\psi$ average $p_{\rm{T}}$ and $p_{\rm{T}}^{2}$ is also studied. Comparisons with the results of models based on a transport equation and on statistical hadronization are also carried out.
JHEP 02 (2020) 041
HEP Data
e-Print: arXiv:1909.03158 | PDF | inSPIRE
CERN-EP-2019-187
Figure 1
Example of fits to the US dimuon invariant mass distributions in \PbPb\ collisions at \sqrtsnnE{5.02} in different centrality classes and \pt\ intervals. The left (right) panels show the distributions before (after) background subtraction with the event-mixing technique. Dashed gray curves correspond to background functions, red curves to the signal functions and blue curves to the sum of the signal and background functions. |  |
Figure 2
Inclusive \jpsi\ nuclear modification factor as a function of \pt\ for \PbPb\ collisions at \sqrtsnnE{5.02} in the 0--90\% centrality class. The vertical error bars represent statistical uncertainties, the boxes around the points uncorrelated systematic uncertainties, while the correlated uncertainty is shown as a filled box around $\Raa=1$. The corresponding measurements in \PbPb\ collisions at \sqrtsnnE{2.76} are also shown, as well as the ratio of the $R_{\rm AA}$ values, which is depicted in the bottom panel of the figure. The \Raa\ values at \sqrtsnnE{5.02} are compared with transport model calculations . |  |
Figure 3
Inclusive \jpsi\ nuclear modification factor as a function of rapidity for \PbPb\ collisions at \sqrtsnnE{5.02} in the 0--90\% centrality class. The vertical error bars represent statistical uncertainties, the boxes around the points uncorrelated systematic uncertainties, while the correlated uncertainty is shown as a filled box around $\Raa=1$. The corresponding measurements in \PbPb\ collisions at \sqrtsnnE{2.76} are also shown, as well as the ratio of the $R_{\rm AA}$ values, which is depicted in the bottom panel of the figure. The \Raa\ values at \sqrtsnnE{5.02} are compared with transport model calculations . | 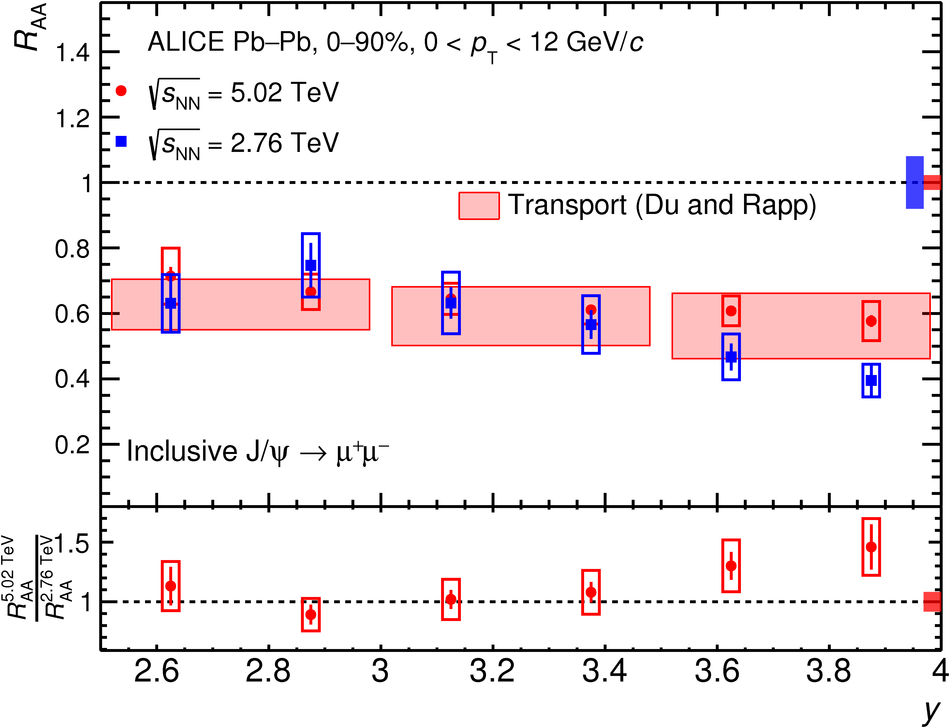 |
Figure 4
Inclusive \jpsi\ nuclear modification factor as a function of \pt\ for \PbPb\ collisions at \sqrtsnnE{5.02} in the 0--20\% (top), 20--40\% (middle) and 40--90\% (bottom) centrality classes. The vertical error bars represent statistical uncertainties, the boxes around the points uncorrelated systematic uncertainties, while the correlated uncertainty is shown as a filled box around $\Raa=1$. The corresponding measurements in \PbPb\ collisions at \sqrtsnnE{2.76} are also shown, as well as the ratio of the $R_{\rm AA}$ values, which is depicted in the bottom panel of the figure. The \Raa\ values at \sqrtsnnE{5.02} and the ratios to lower energy results are compared with transport model calculations and, for 0--20\% and 20--40\% centrality, with the results of the SHM . The brackets around \Raa\ values for 40--90\% centrality in the lowest \pt\ interval represent an estimate of the maximum influence of \jpsi\ photo-production, as detailed in Sec. \ref{sec:Raa}. | 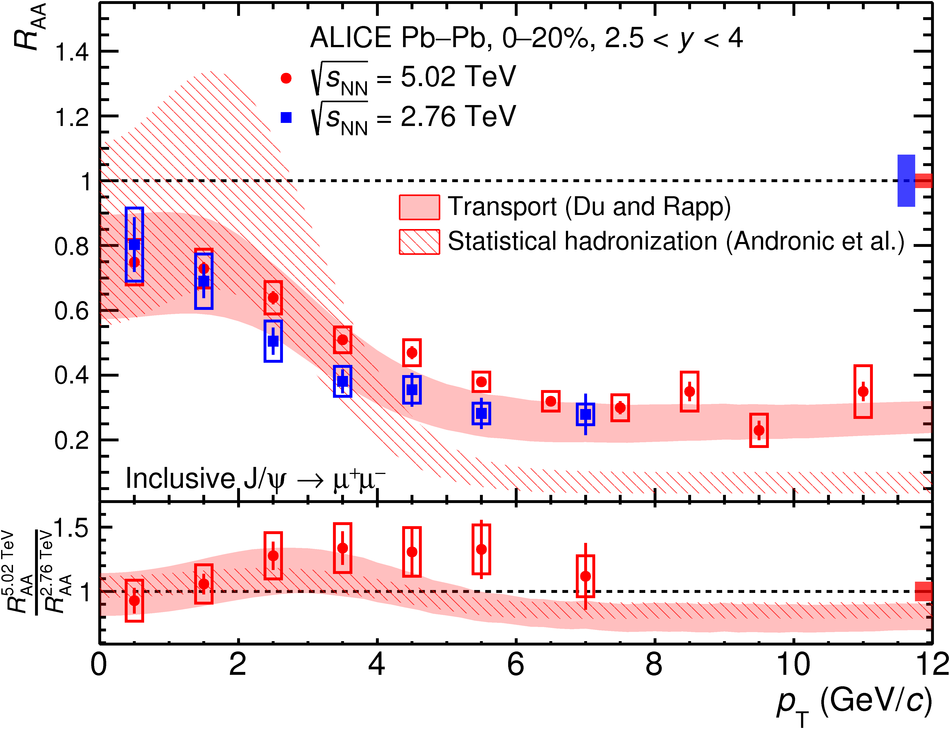   |
Figure 5
Inclusive \jpsi\ nuclear modification factor as a function of rapidity for \PbPb\ collisions at \sqrtsnnE{5.02} in the 0--20\% (top), 20--40\% (middle) and 40--90\% (bottom) centrality classes. The vertical error bars represent statistical uncertainties, the boxes around the points uncorrelated systematic uncertainties, while the correlated uncertainty is shown as a filled box around $\Raa=1$. The \Raa\ values are compared with transport model calculations . The brackets around \Raa\ values for 40--90\% centrality represent an estimate of the maximum influence of \jpsi\ photo-production, as detailed in Sec. \ref{sec:Raa}. | 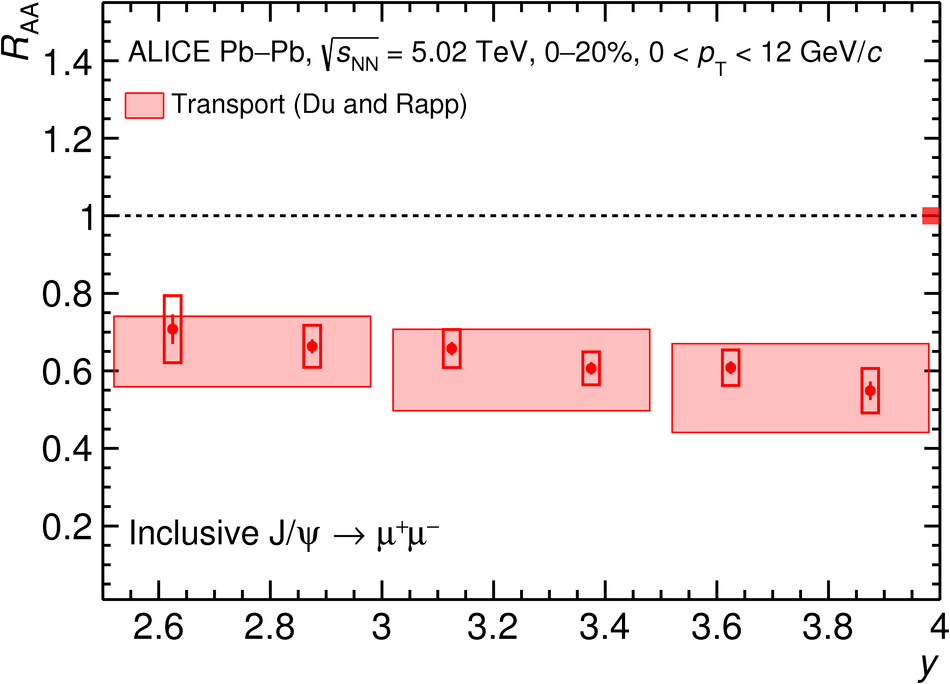 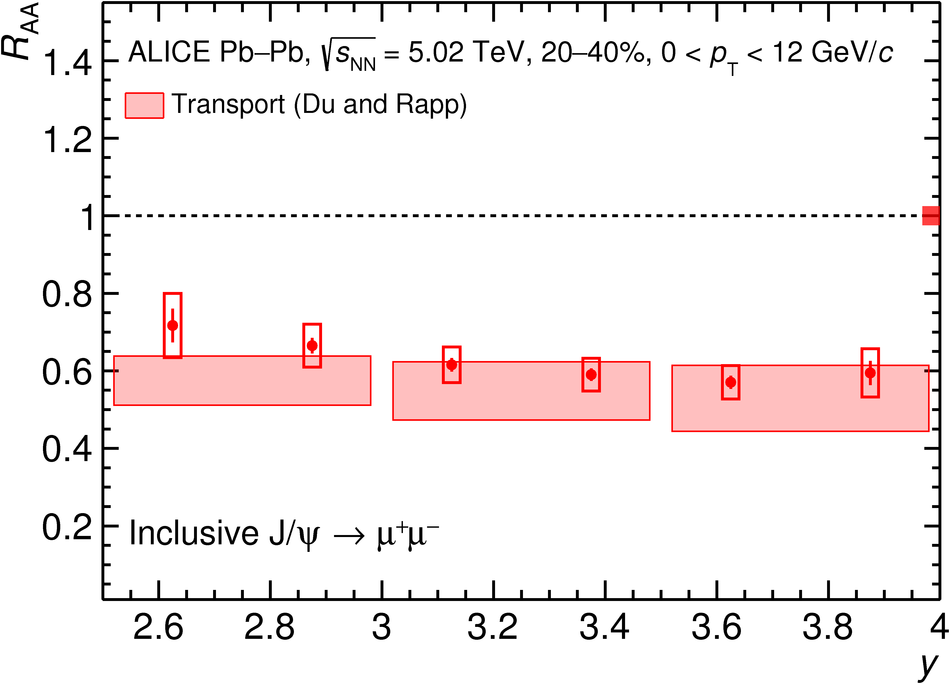 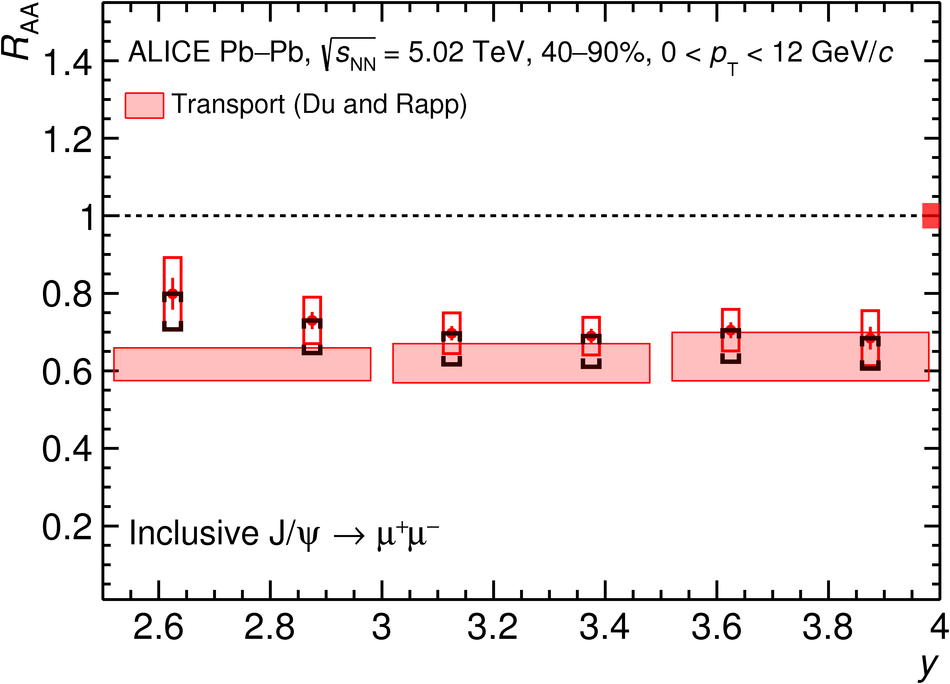 |
Figure 6
Inclusive \jpsi\ nuclear modification factor as a function of \Npart\ for \PbPb\ collisions at \sqrtsnnE{5.02}. Results are shown for four \pt\ intervals. The vertical error bars represent statistical uncertainties, the boxes around the points uncorrelated systematic uncertainties, while the correlated uncertainty is shown as a filled box around $\Raa=1$. When the corresponding results at \sqrtsnnE{2.76} are available, the ratio of the results at the two energies is shown in the bottom section of each figure. The brackets around \Raa\ values for 0.3 $< $ \pt\ $< $ 2 \gevc\ represent an estimate of the influence of \jpsi\ photo-production, as detailed in Sec. \ref{sec:Raa}. The \Raa\ results at \sqrtsnnE{5.02} as well as the available ratios to the \sqrtsnnE{2.76} results are compared with transport model calculations . | 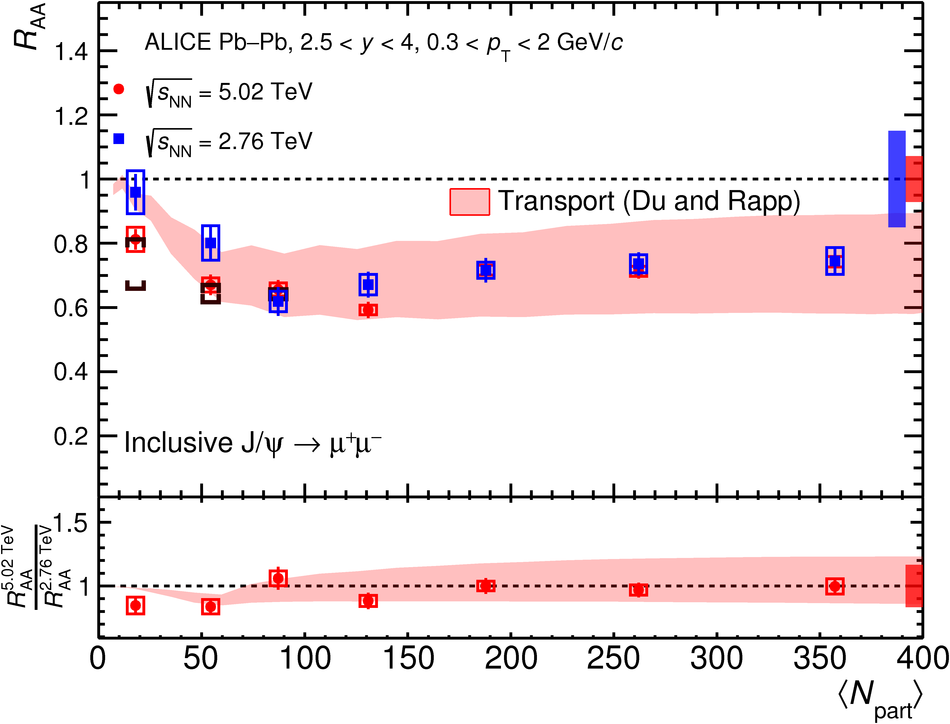 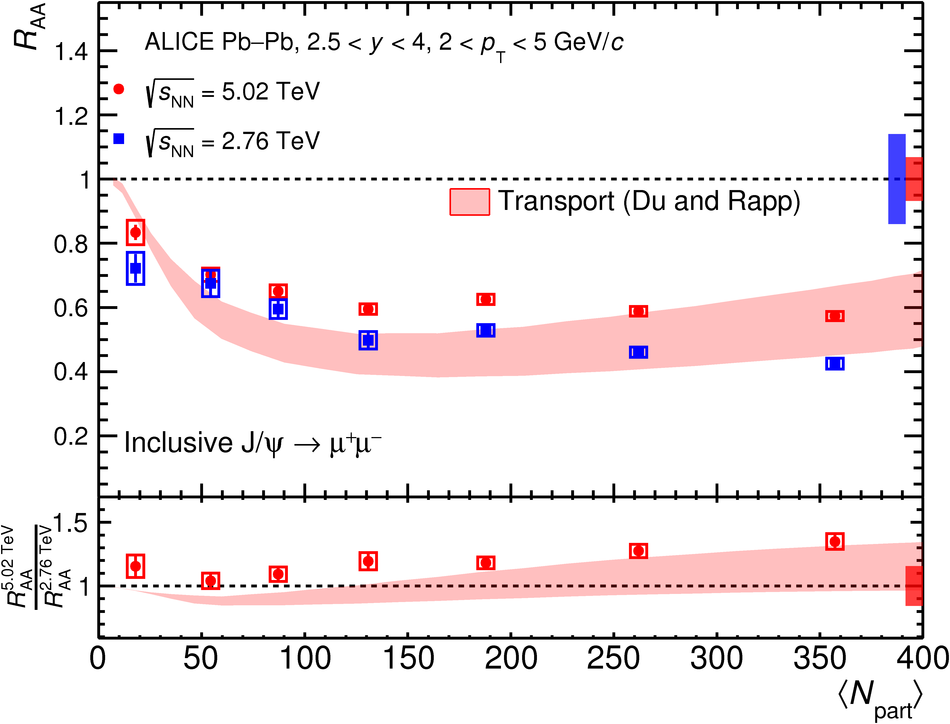 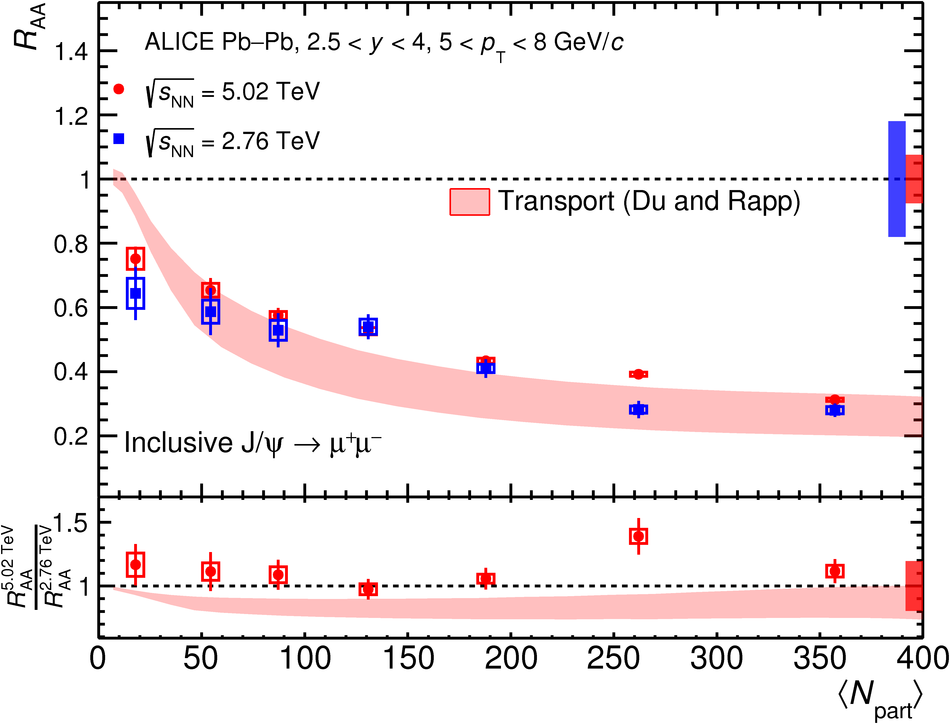  |
Figure 7
Inclusive \jpsi\ nuclear modification factor as a function of \Npart\ for \PbPb\ collisions at \sqrtsnnE{5.02}, in the interval $0.3 < \pt\ < 12$ \gevc. Results are shown for three $y$ intervals. The vertical error bars represent statistical uncertainties, the boxes around the points uncorrelated systematic uncertainties, while the correlated uncertainty is shown as a filled box around $\Raa=1$. The results are compared with transport model calculations . |   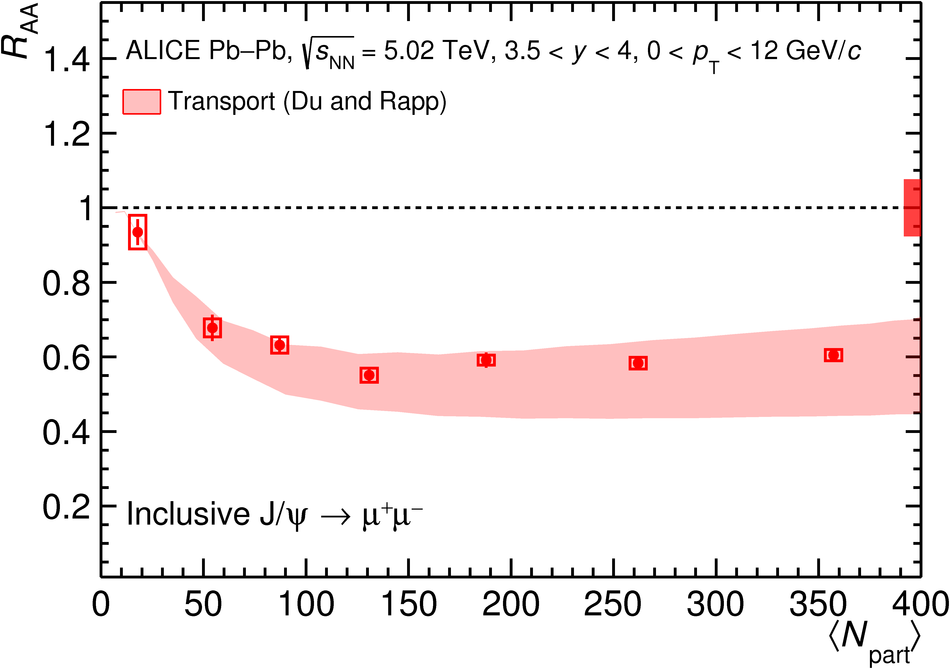 |
Figure 8
Inclusive \jpsi\ yields as a function of \pt\ in \PbPb\ collisions at \sqrtsnnE{5.02}, for various centrality classes. The vertical error bars represent the statistical uncertainties while the uncorrelated systematic uncertainties are represented by boxes around the points. The curves are the results of fits obtained using the function shown in Eq. \ref{eq:fPt}. The dashed region corresponds to the region \pt\ $< $ 0.5 \gevc, excluded in the fits. |  |
Figure 9
(Left) Inclusive \jpsi\ \meanpt\ measured in \PbPb\ collisions at \sqrtsnnE{5.02} and \sqrtsnnE{2.76}, as a function of \Npart\ for \pt\ $< $ 8 \gevc. The vertical error bars represent the statistical uncertainties, while the uncorrelated systematic uncertainties are shown as boxes around the points. \jpsi\ \meanpt\ results in \pp\ collisions at the two collision energies are also shown at \Npart = 2. (Right) Inclusive \jpsi\ \rAA\ in \PbPb\ collisions at \sqrtsnnE{5.02}, compared with the \sqrtsnnE{2.76} results and a transport model calculation , as a function of \Npart\ for \pt\ $< $ 8 \gevc. The vertical error bars represent the quadratic sum of statistical and systematic uncertainties on the numerator of the $r_{\rm AA}$ expression ($\langle{p_{\rm T}}^2\rangle_{\rm AA}$), while the uncertainties on the denominator ($\langle{p_{\rm T}}^2\rangle_{\rm pp}$) are shown as a filled box around unity. In the two panels, the brackets around the two most peripheral data points represent an estimate of the maximum influence of \jpsi\ photo-production, as detailed in Sec. \ref{sec:meanPt}. | 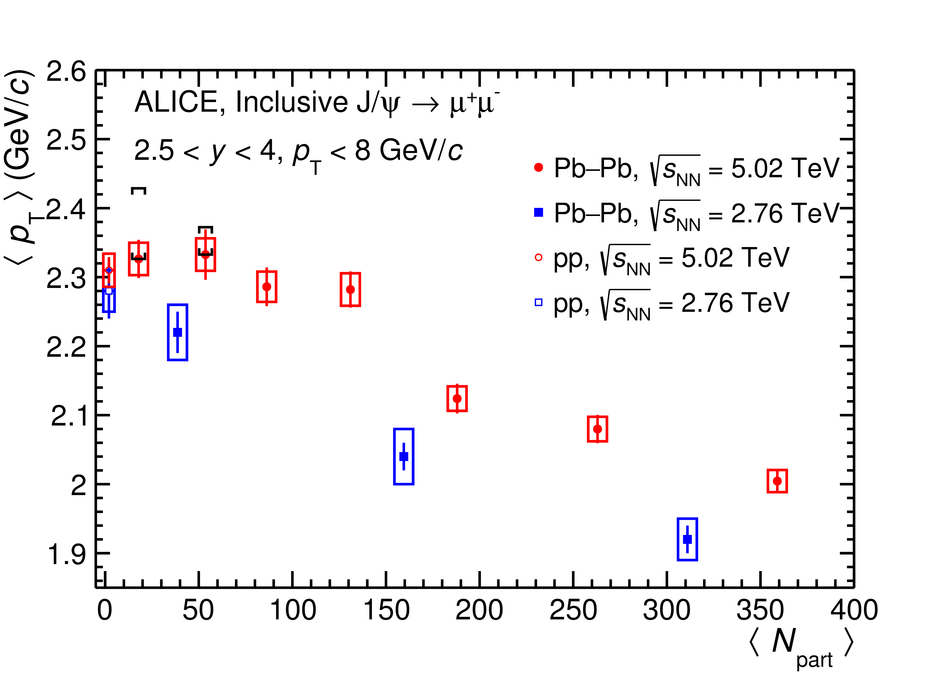 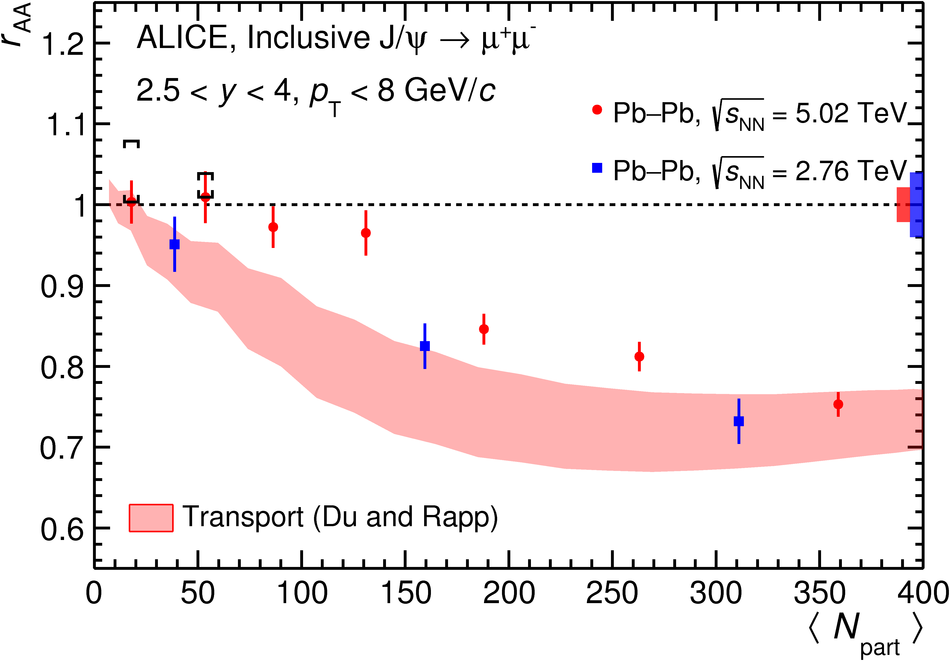 |