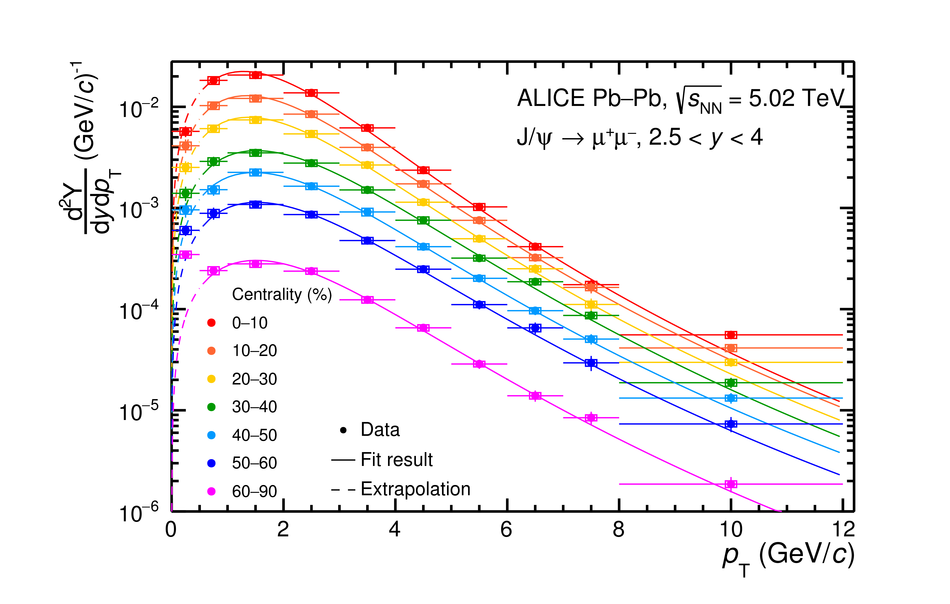
Inclusive \jpsi\ yields as a function of \pt\ in \PbPb\ collisions at \sqrtsnnE{5.02}, for various centrality classes. The vertical error bars represent the statistical uncertainties while the uncorrelated systematic uncertainties are represented by boxes around the points. The curves are the results of fits obtained using the function shown in Eq. ???. The dashed region corresponds to the region \pt\ $< $ 0.5 \gevc, excluded in the fits. |  |