The differential charged jet cross sections, jet fragmentation distributions, and jet shapes are measured in minimum bias proton-proton collisions at centre-of-mass energy $\sqrt{s}=7$ TeV using the ALICE detector at the LHC. Jets are reconstructed from charged particle momenta in the mid-rapidity region using the sequential recombination $k_{\rm T}$ and anti-$k_{\rm T}$ as well as the SISCone jet finding algorithms with several resolution parameters in the range $R=0.2$ to $0.6$. Differential jet production cross sections measured with the three jet finders are in agreement in the transverse momentum ($p_{\rm T}$) interval $20< p_{\rm T}^{\rm jet,ch}< 100$ GeV/$c$. They are also consistent with prior measurements carried out at the LHC by the ATLAS collaboration. The jet charged particle multiplicity rises monotonically with increasing jet $p_{\rm T}$, in qualitative agreement with prior observations at lower energies. The transverse profiles of leading jets are investigated using radial momentum density distributions as well as distributions of the average radius containing 80% ($\langle R_{\rm 80} \rangle$) of the reconstructed jet $p_{\rm T}$. The fragmentation of leading jets with $R=0.4$ using scaled $p_{\rm T}$ spectra of the jet constituents is studied. The measurements are compared to model calculations from event generators (PYTHIA, PHOJET, HERWIG). The measured radial density distributions and $\langle R_{\rm 80} \rangle$ distributions are well described by the PYTHIA model (tune Perugia-2011). The fragmentation distributions are better described by HERWIG.
Phys. Rev. D 91 (2015) 112012
HEP Data
e-Print: arXiv:1411.4969 | PDF | inSPIRE
CERN-PH-EP-2014-254
Figure 1
Probability distribution of the relative momentum difference of simulated ALICE detector response to charged jets in pp collisions at $\sqrt{s}$ = 7 TeV for three different $p_{\rm T}^{\rm jet,particle}$ intervals. Charged jets are simulated using PYTHIA Perugia-0 and reconstructed with the anti-$k_{\rm T}$ jet finding algorithm with $R$ = 0.4. | 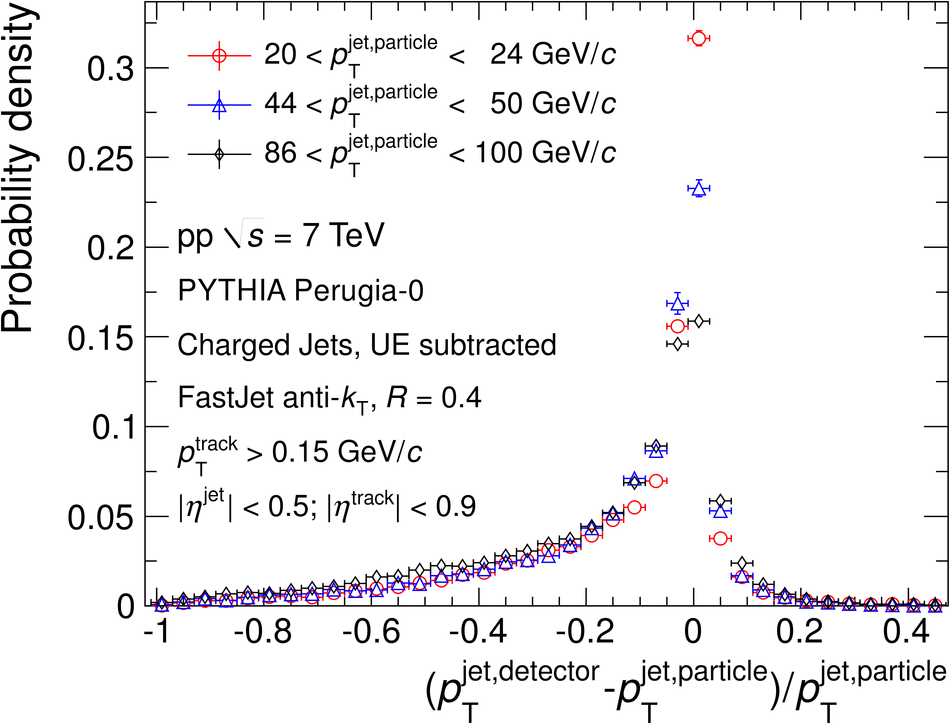 |
Figure 3
Inclusive charged jet cross sections in pp collisions at $\rm{\sqrt{s}=7}$ TeV using the anti-$k_{\rm T}$ algorithm with $R$ = 0.2 (0.3, 0.4, and 0.6) within $\left| \eta^{\rm jet} \right| \leq {\rm 0.7}$ ($\left| \eta^{\rm jet} \right| \leq {\rm 0.6}$, $\left| \eta^{\rm jet} \right| \leq {\rm 0.5}$, and $\left| \eta^{\rm jet} \right| \leq {\rm 0.3}$). | 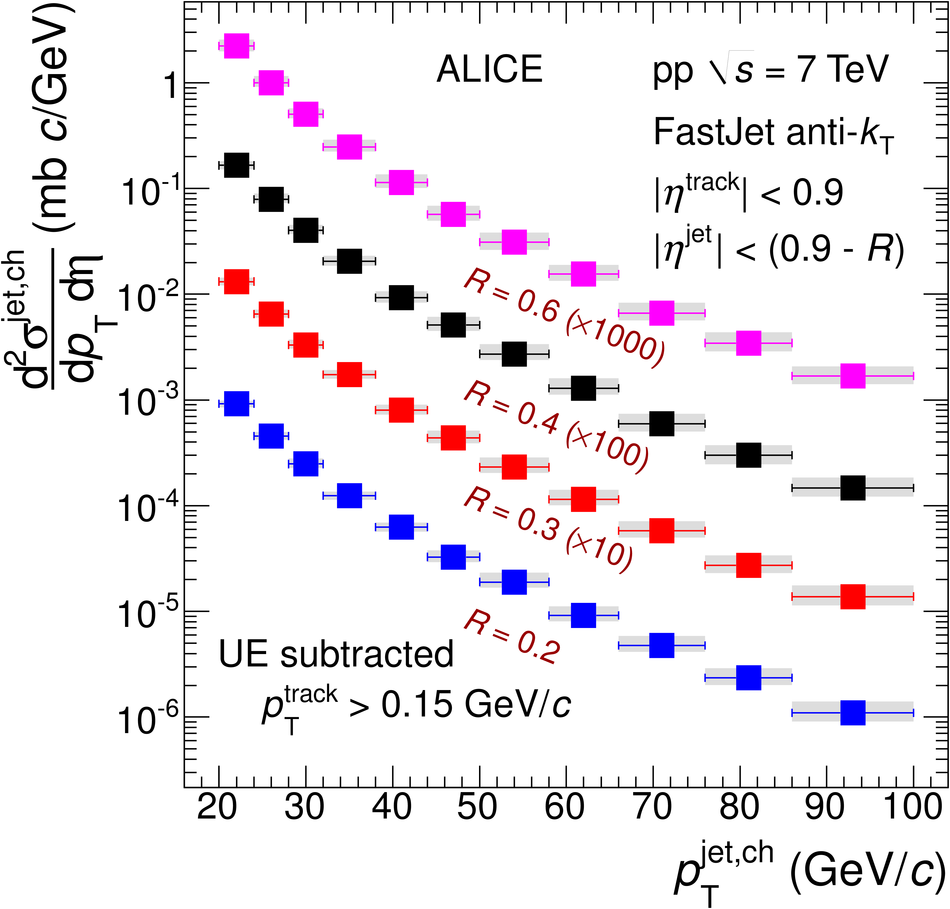 |
Figure 4
Top panels: Comparison of the charged jet cross section in the ALICE and the ATLAS experiments in pp collisions at $\rm{\sqrt{s}=7}$ TeV. Statistical and systematic uncertainties are shown separately for ALICE data points, the gray bands indicating the systematic uncertainties, while for the ATLAS data points, the error bars show the statistical and systematic uncertainties summed in quadrature The dotted line represents a Tsallis fit used to parametrize the ALICE data Bottom panels: The ratio of the ALICE and ATLAS charged jet spectrum to the parametrized ALICE data Note that the labels in the figures correspond to the ALICE measurements (see text for details). |  |
Figure 5
Top panels: Charged jet cross sections measured in the ALICE experiment in pp collisions at $\sqrt{s}$ = 7 TeV compared to several MC generators: PYTHIA AMBT1, PYTHIA Perugia-0 tune, PYTHIA Perugia-2011 tune, HERWIG, and PHOJET. Bottom panels: Ratios MC/Data. Shaded bands show quadratic sum of statistical and systematic uncertainties on the data drawn at unity. | 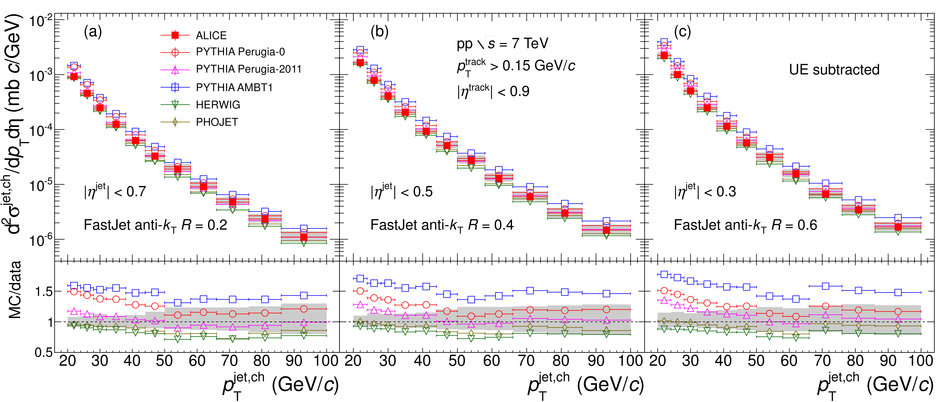 |
Figure 6
Ratios of jet cross sections for charged jets reconstructed using anti-$k_{\rm T}$ algorithm with resolution parameters 0.2 and 0.4 and 0.2 and 0.6. The jet acceptance is restricted to $\left|\eta^{\rm jet} \right| \leq {\rm 0.3}$. The ratios in data are compared to PYTHIA Perugia-2011 and HERWIG simulations. | 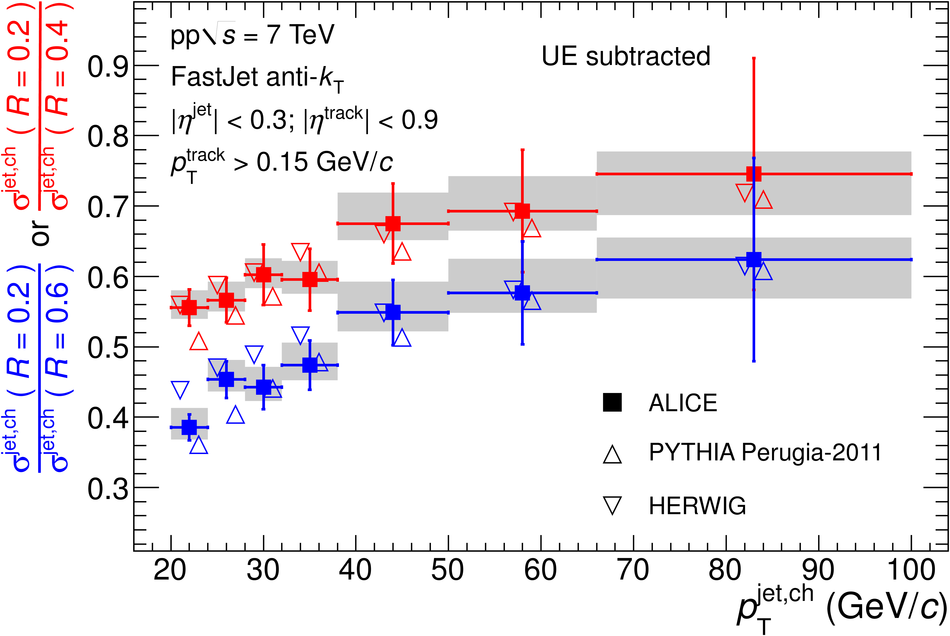 |
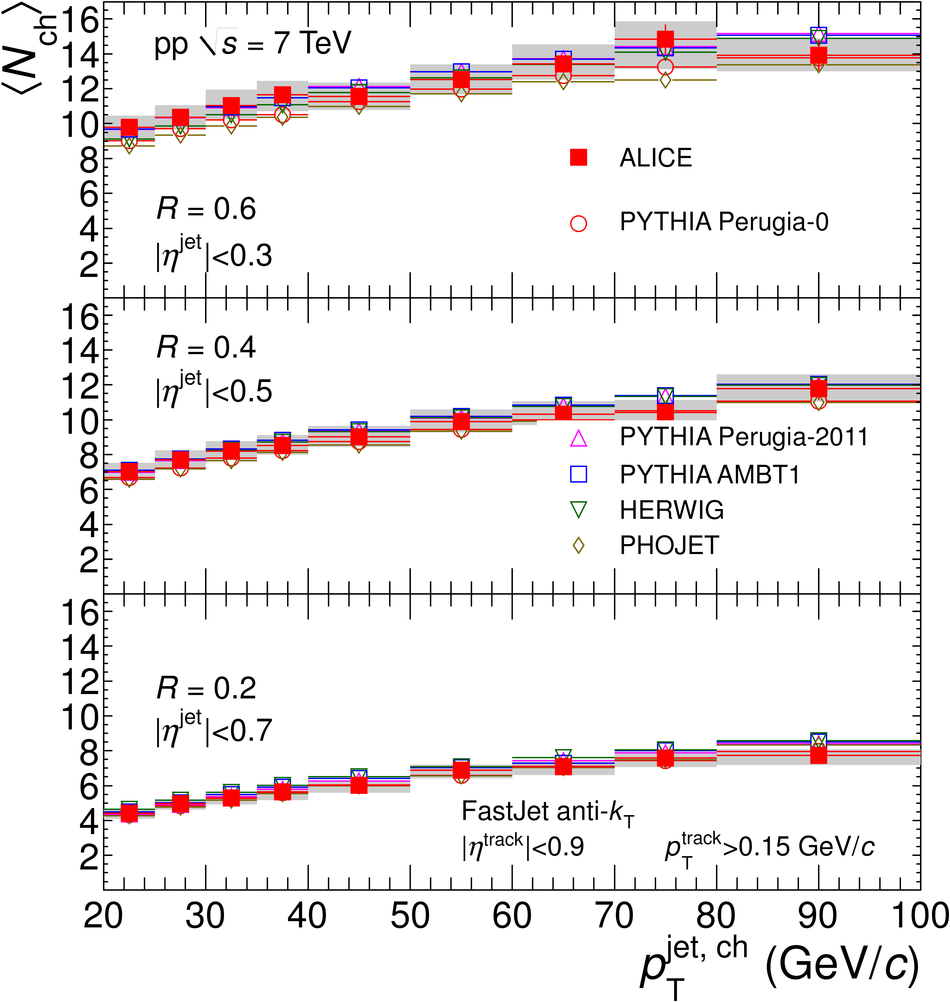
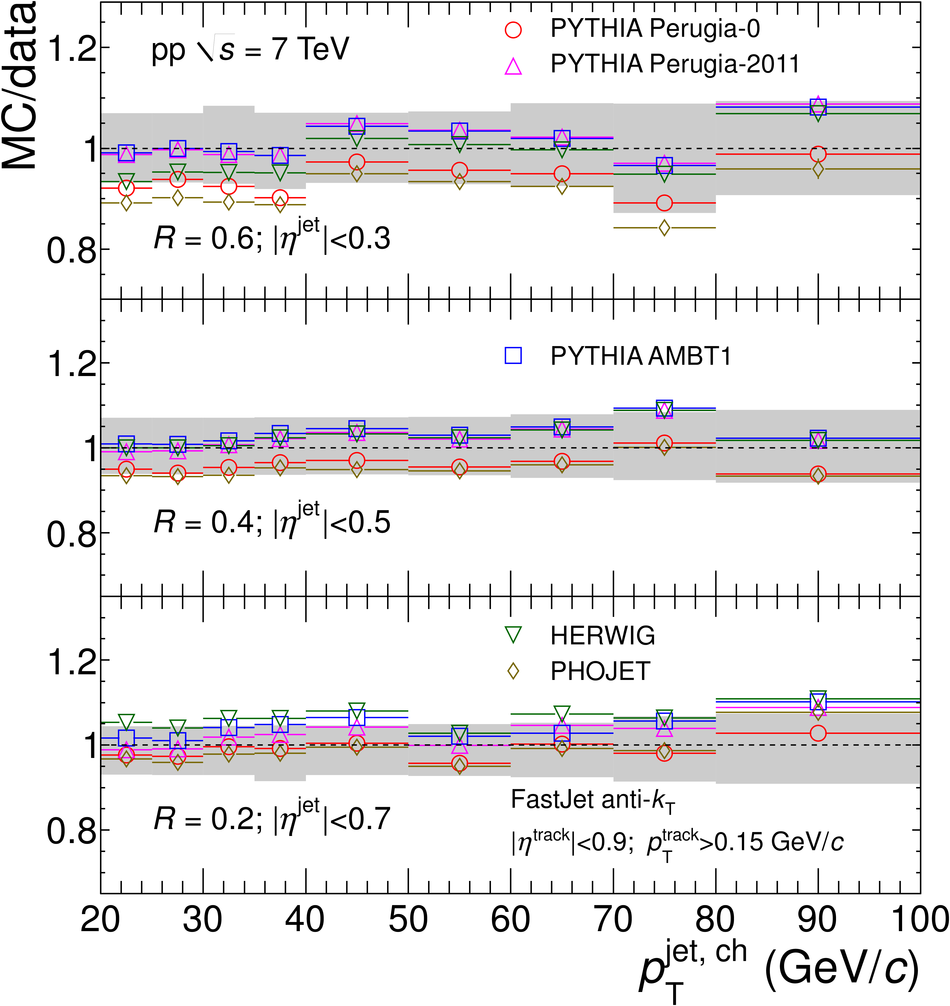
Figure 7
Top panel: Mean charged particle multiplicity in the leading charged jet as a function of jet $p_{\rm T}$ compared to MC models for pp collisions at $\sqrt{s}$ = 7 TeV for various jet resolution parameters ($R$ = 0.6 (top), $R$ = 0.4 (middle) and $R$ = 0.2 (bottom)). UE contributions are subtracted from both data and MC. Bottom panel: Ratios MC/data. Shaded bands show the quadratic sum of statistical and systematic uncertainties on the data drawn at unity. | 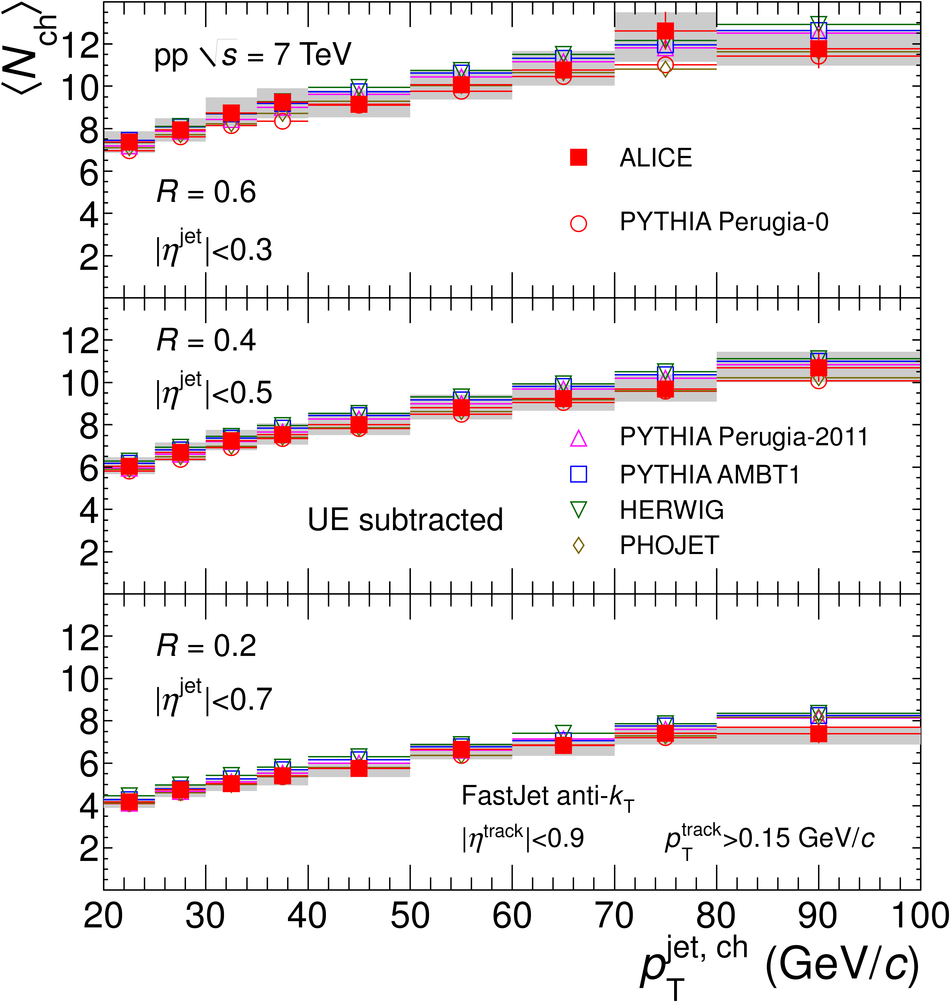 |
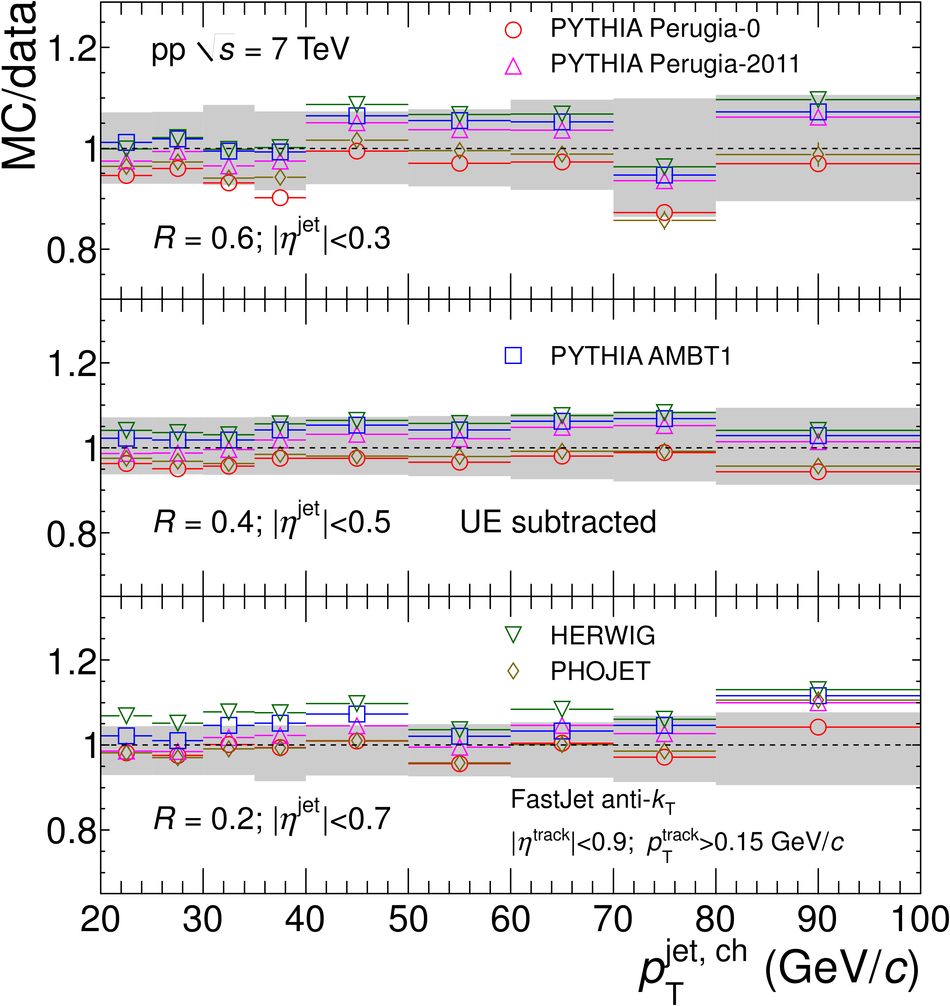
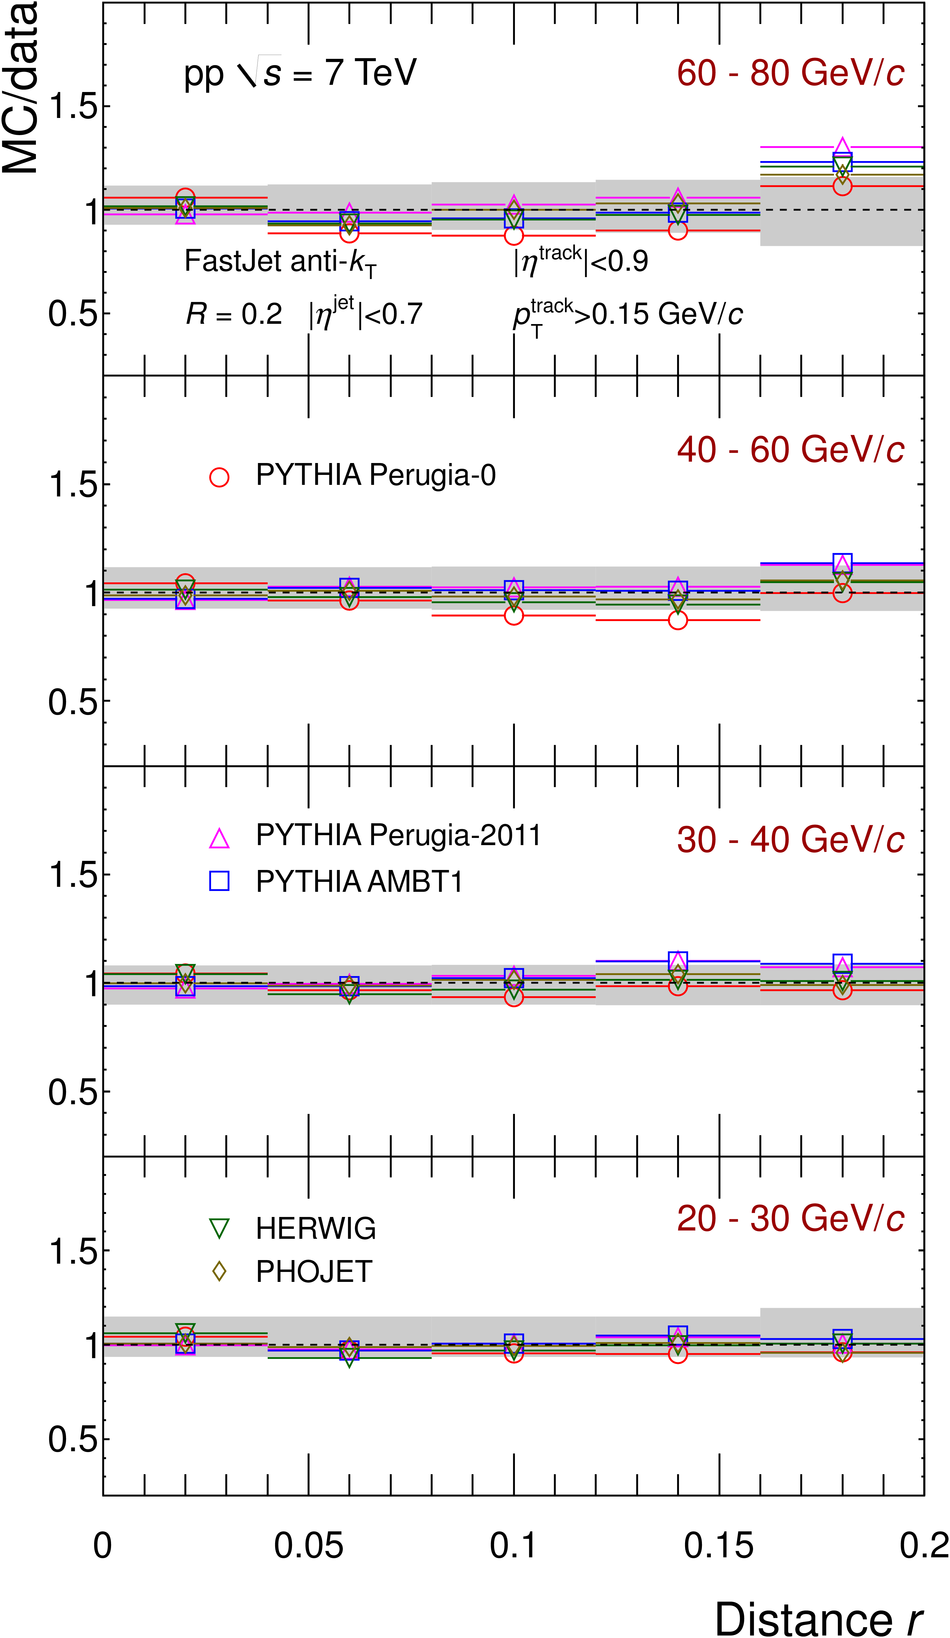
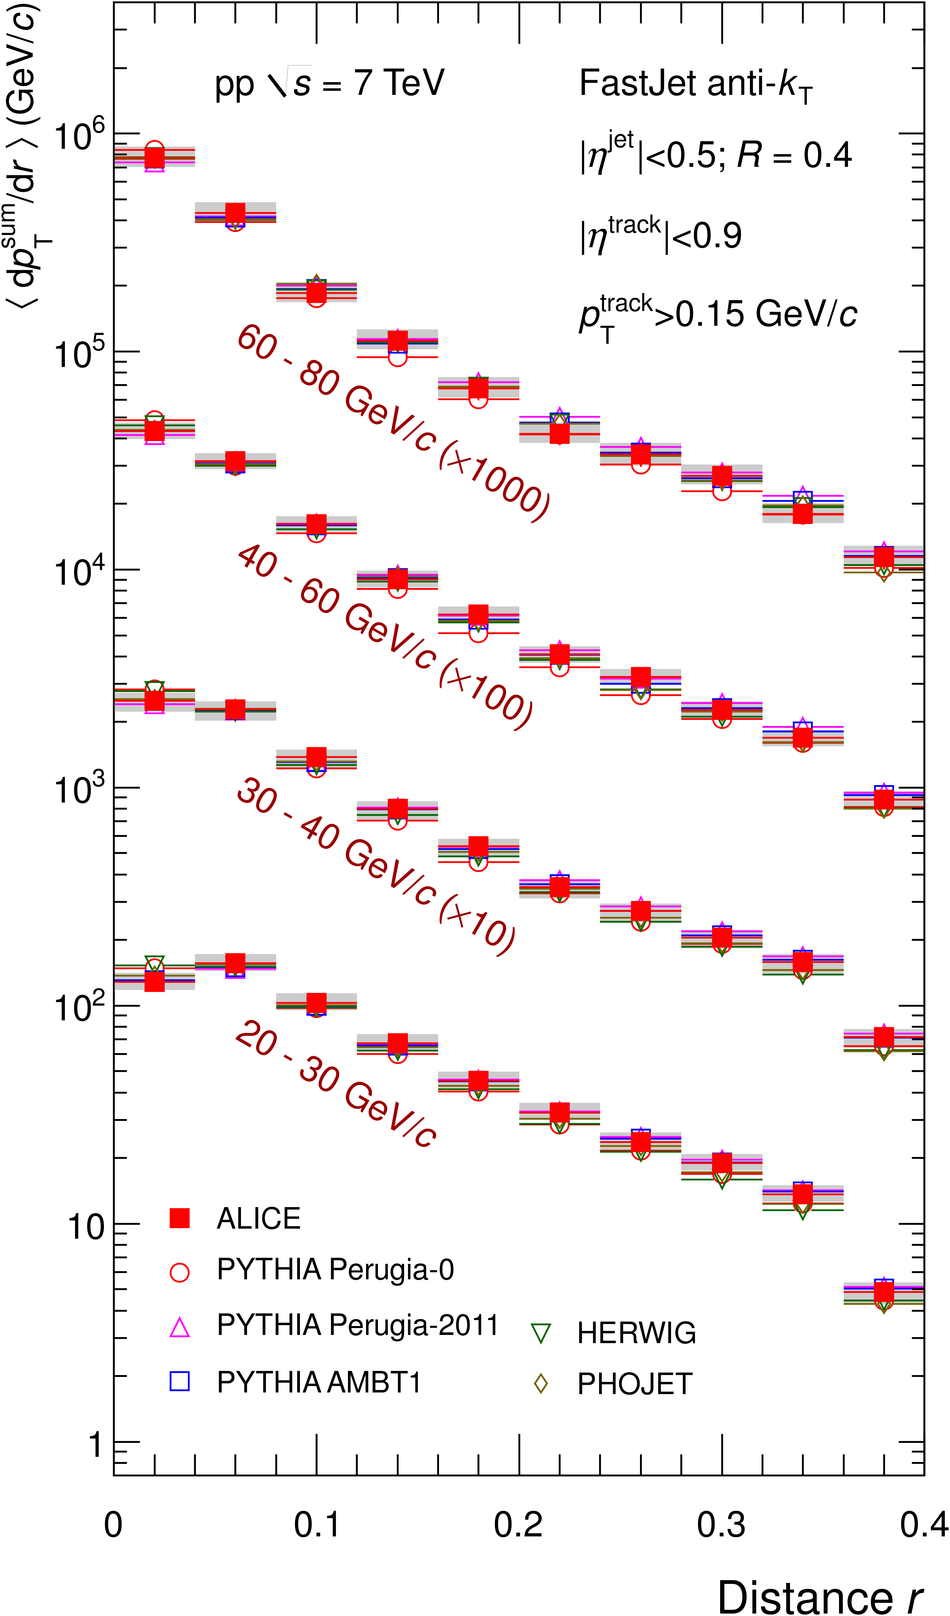
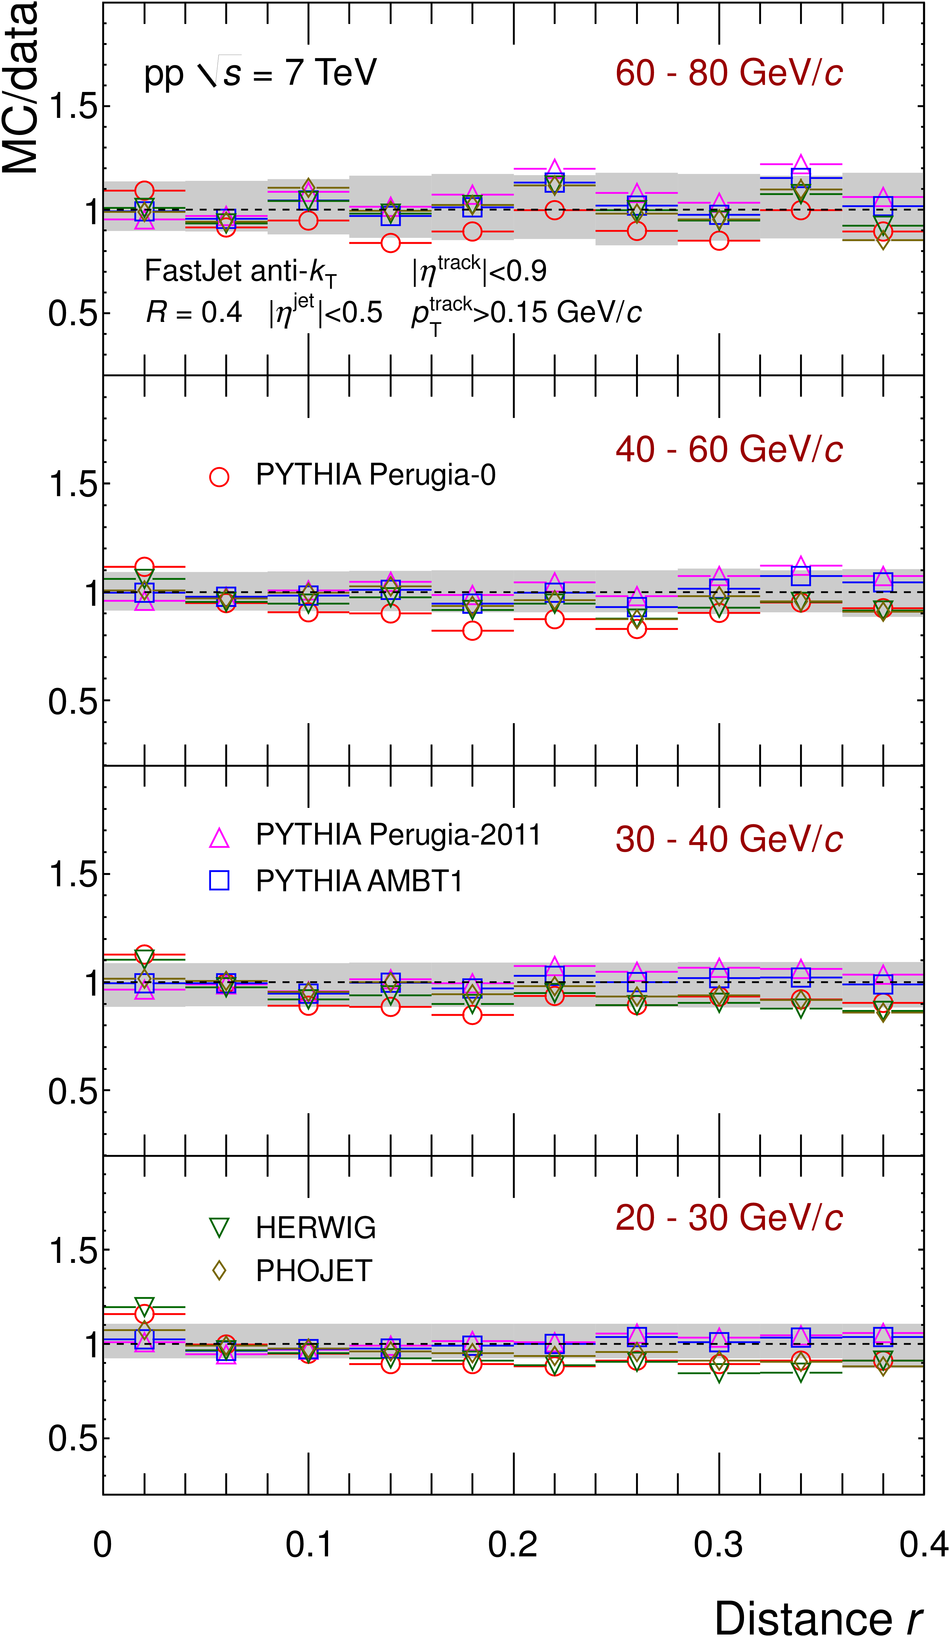
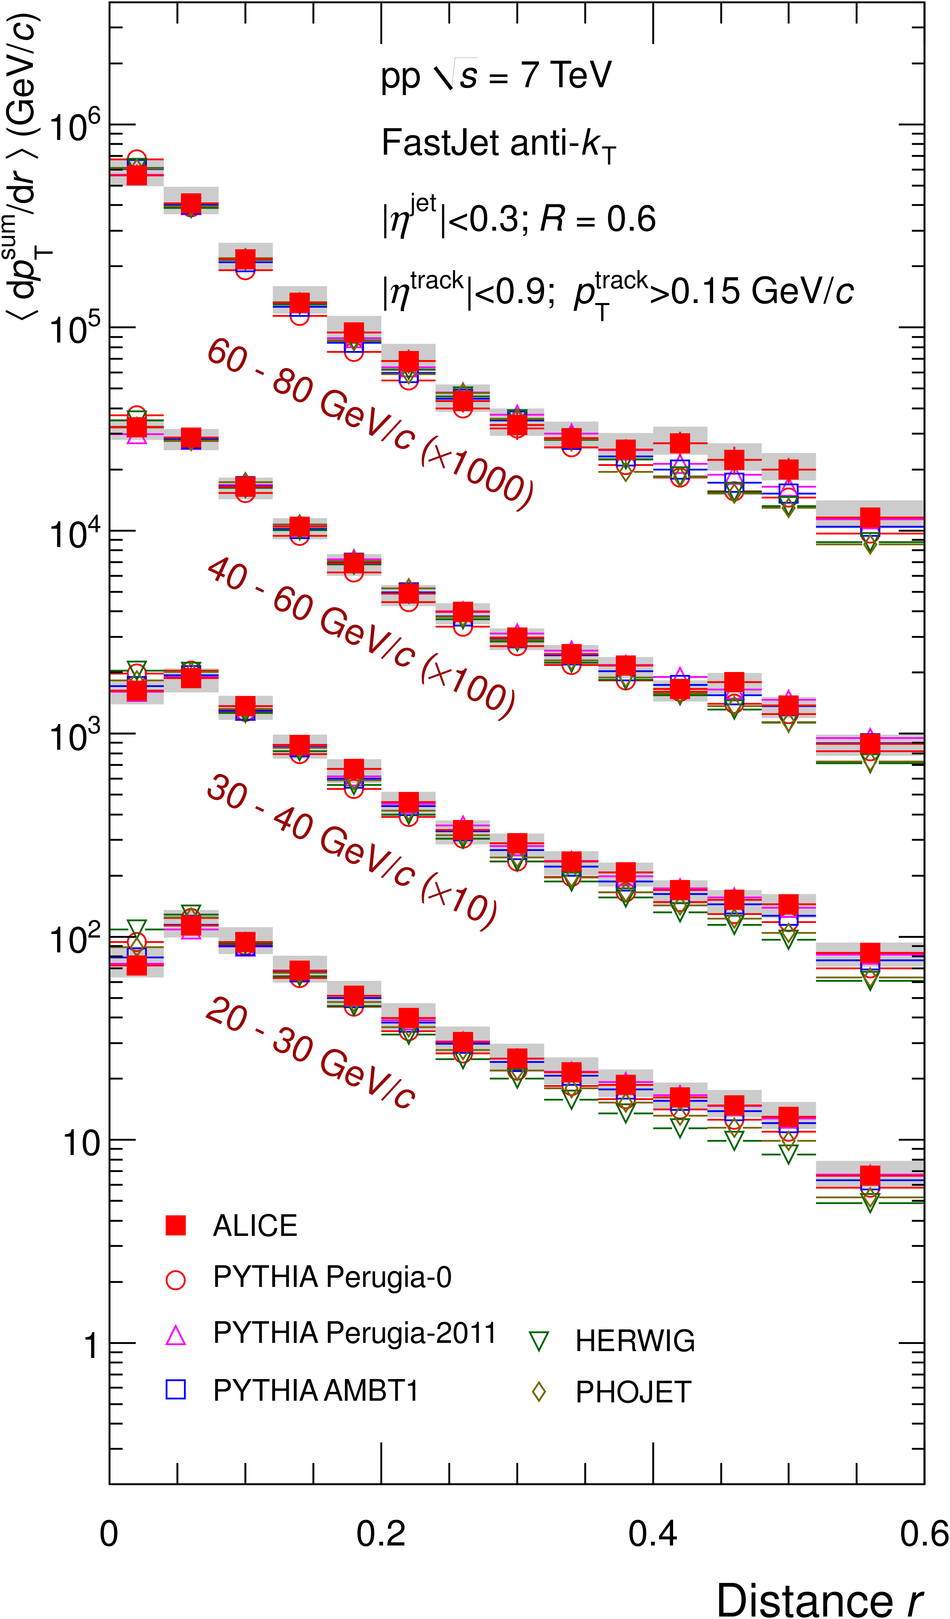
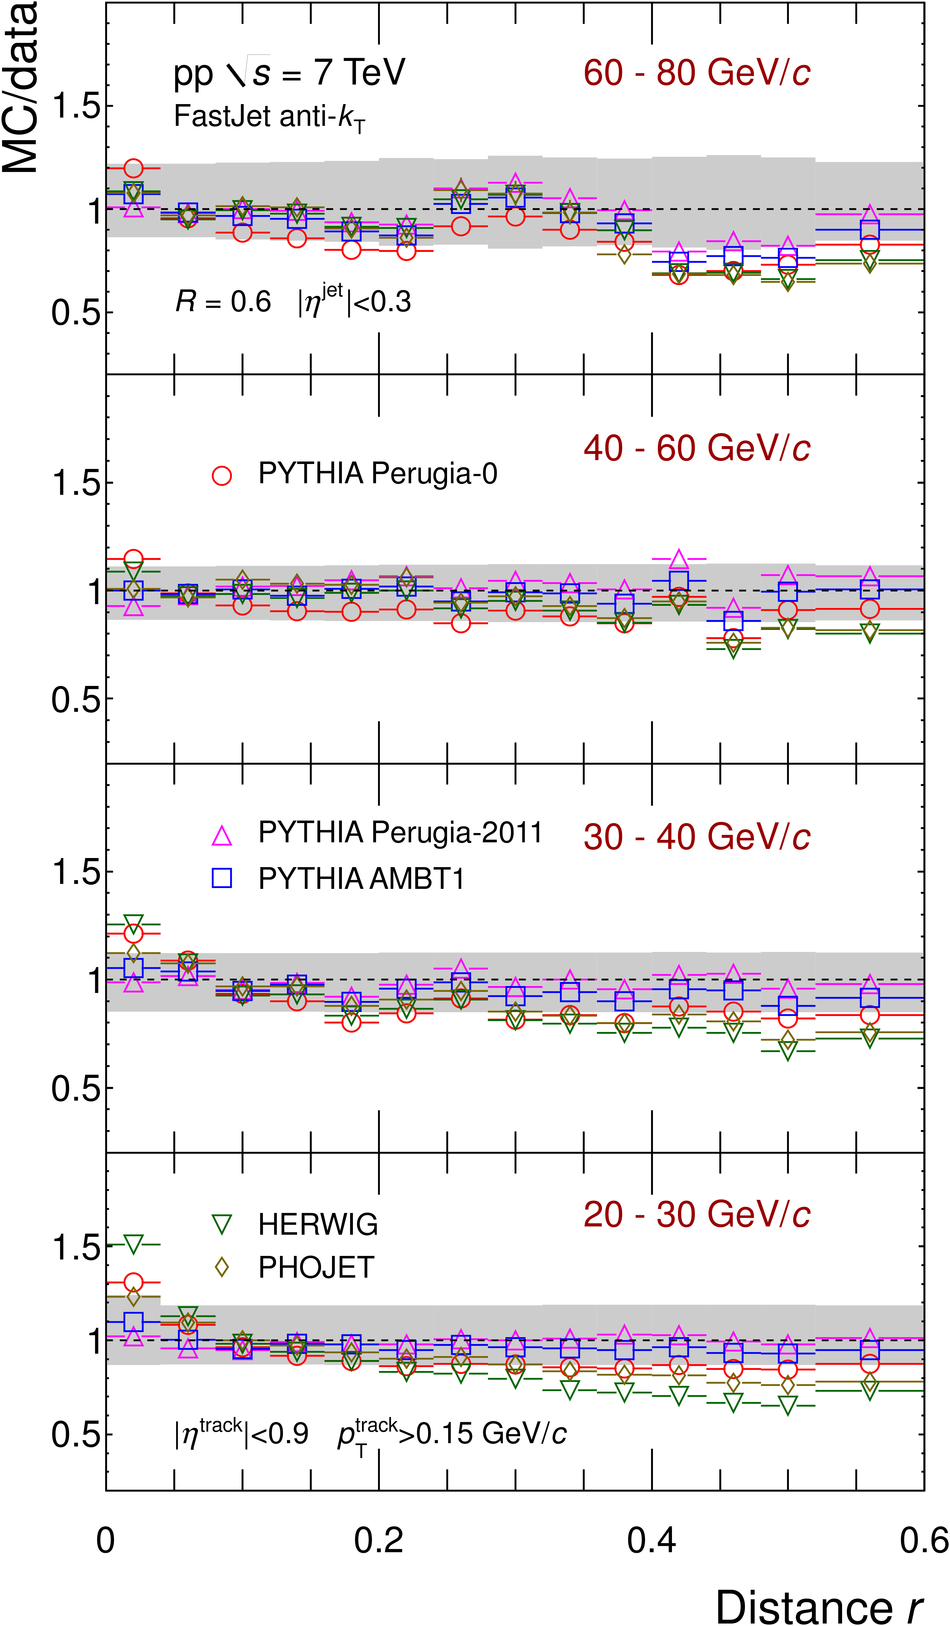
Figure 8
Top panel: Radial distributions of $p_{\rm T}$ density as a function radial distance 'r' from the jet direction for leading charged jets reconstructed with resolution parameter $R$ = 0.2 for selected jet $p_{\rm T}$ ranges in pp collisions at $\sqrt{s}$ = 7 TeV Measured distributions are compared to MC model calculations UE contributions are subtracted from both data and MC Bottom panel: Ratios MC/data. Shaded bands show the quadratic sum of statistical and systematic uncertainties of the data drawn at unity. | 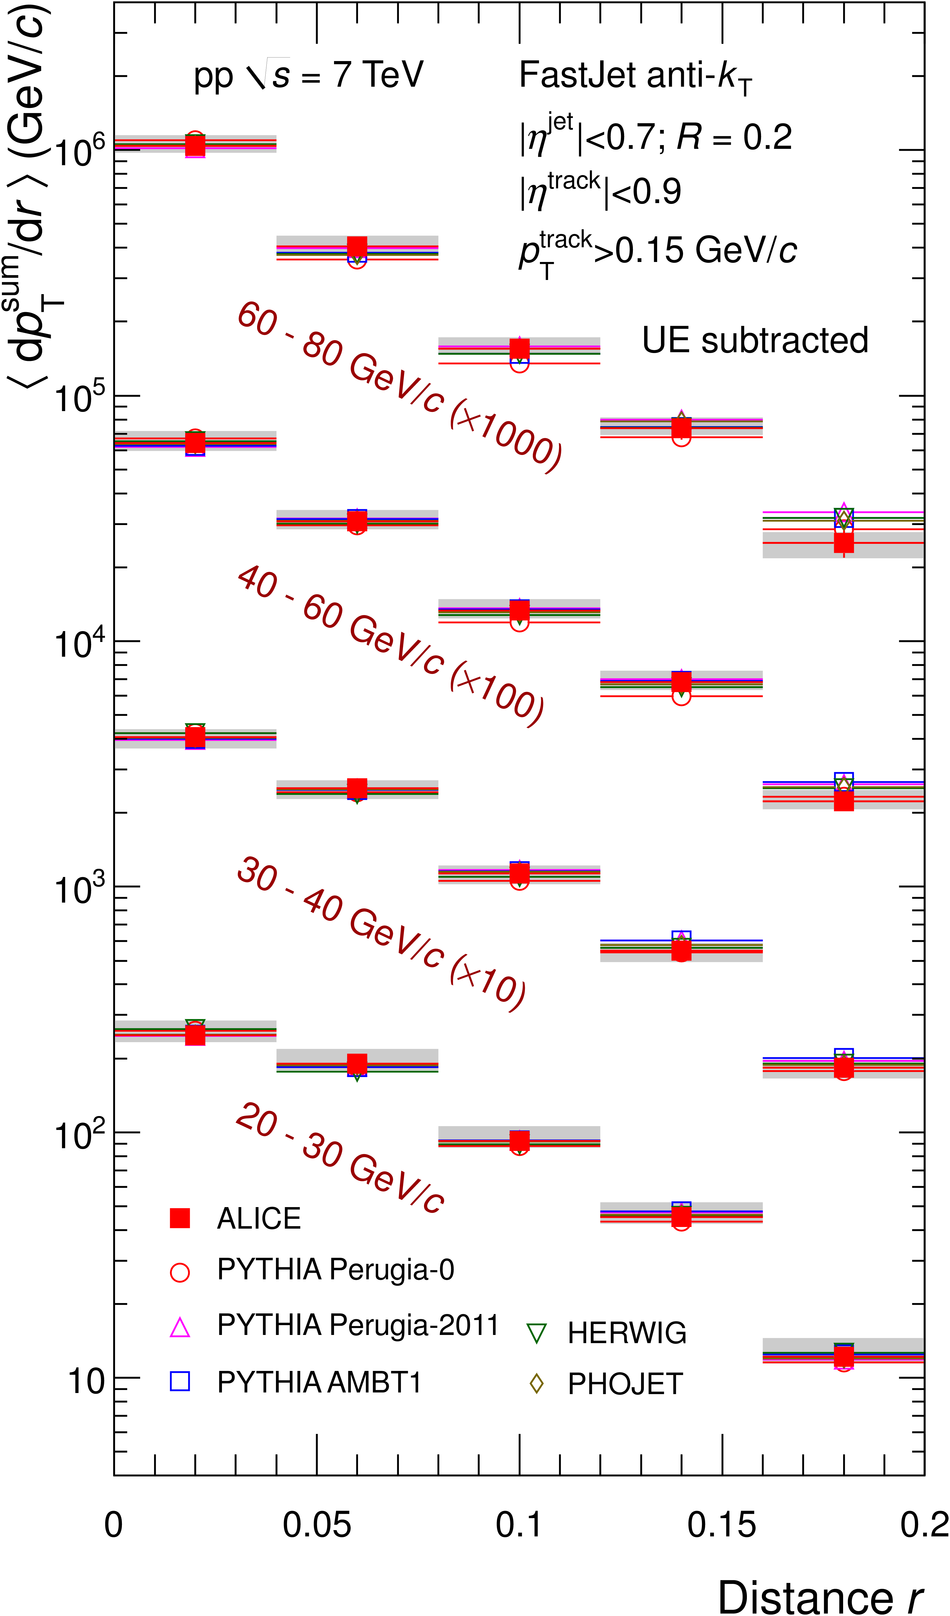 |
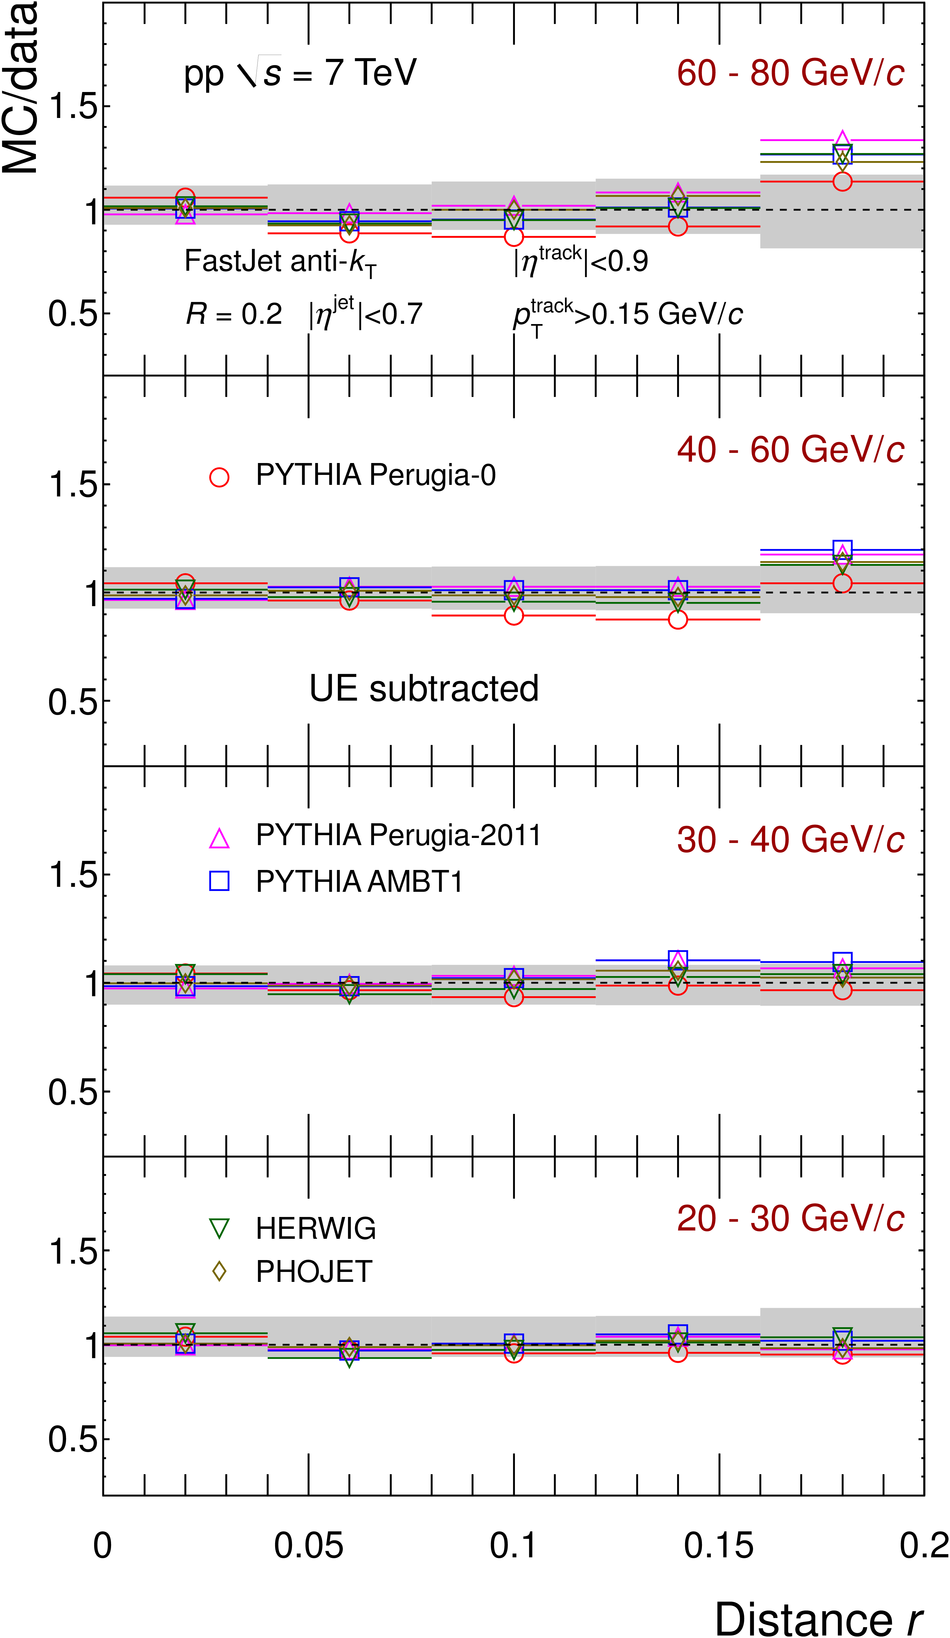
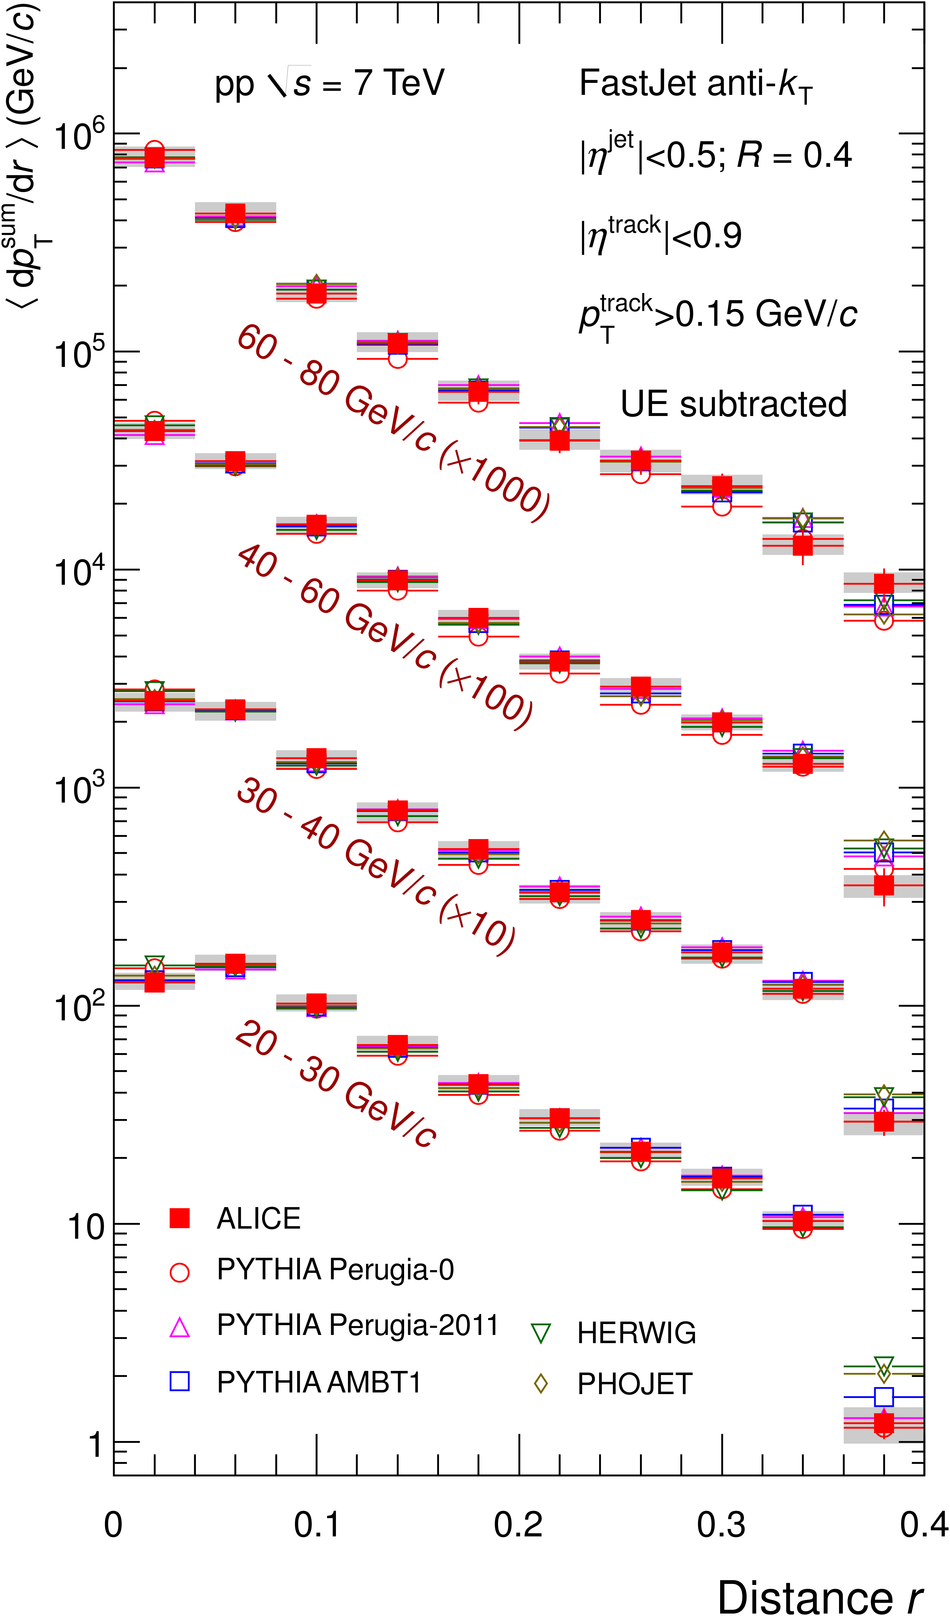
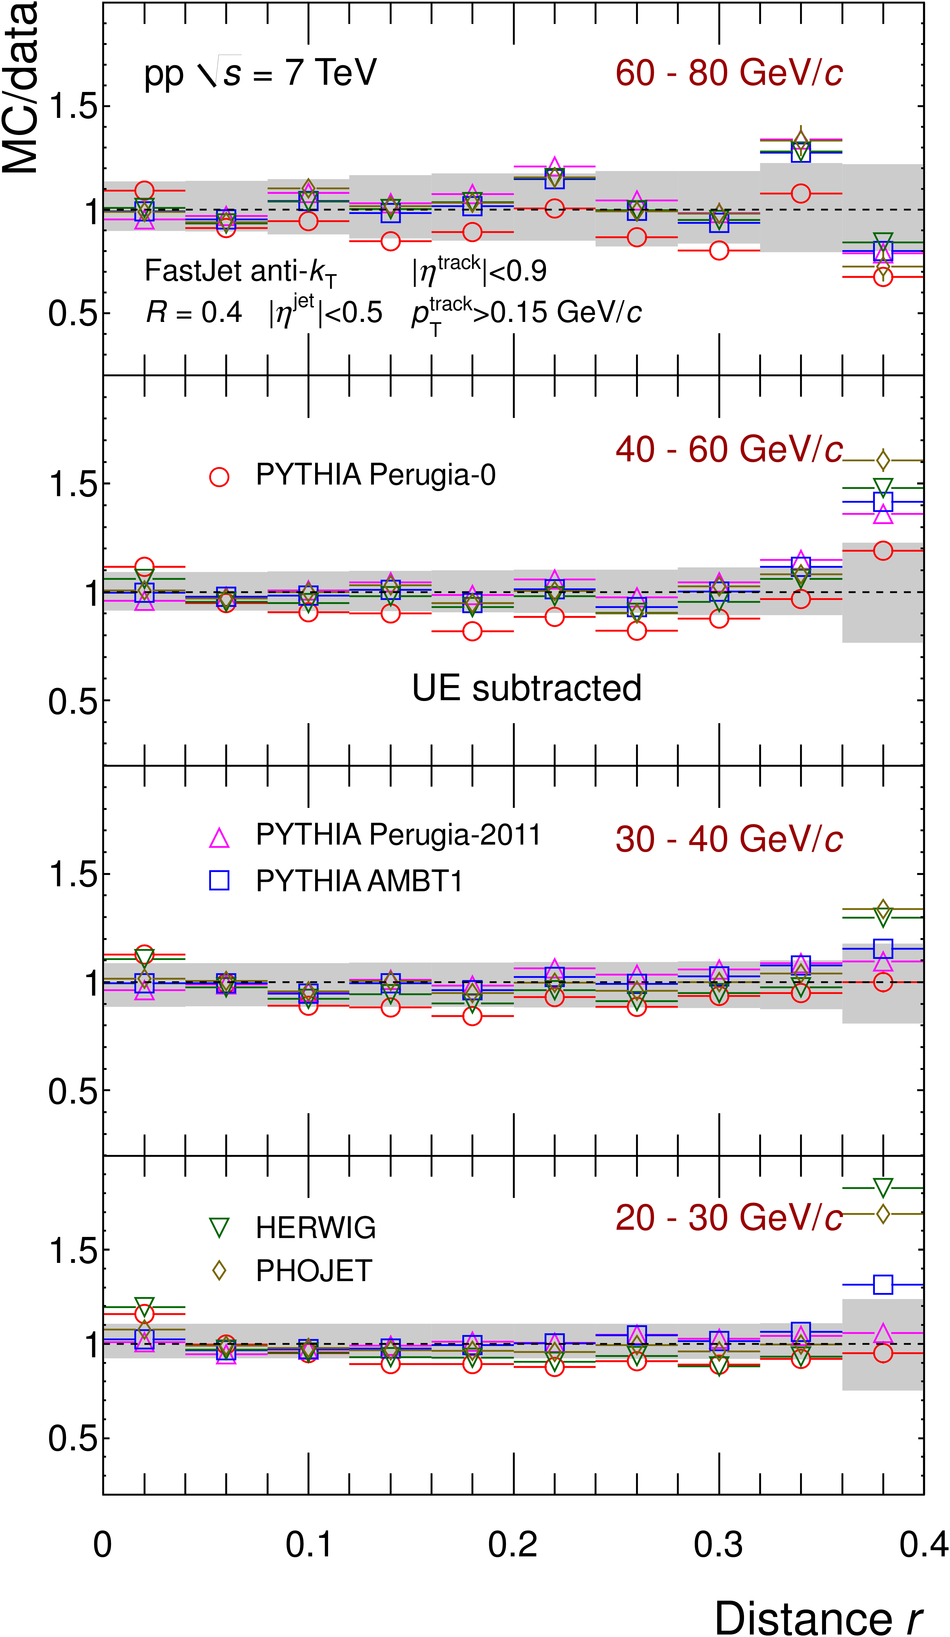
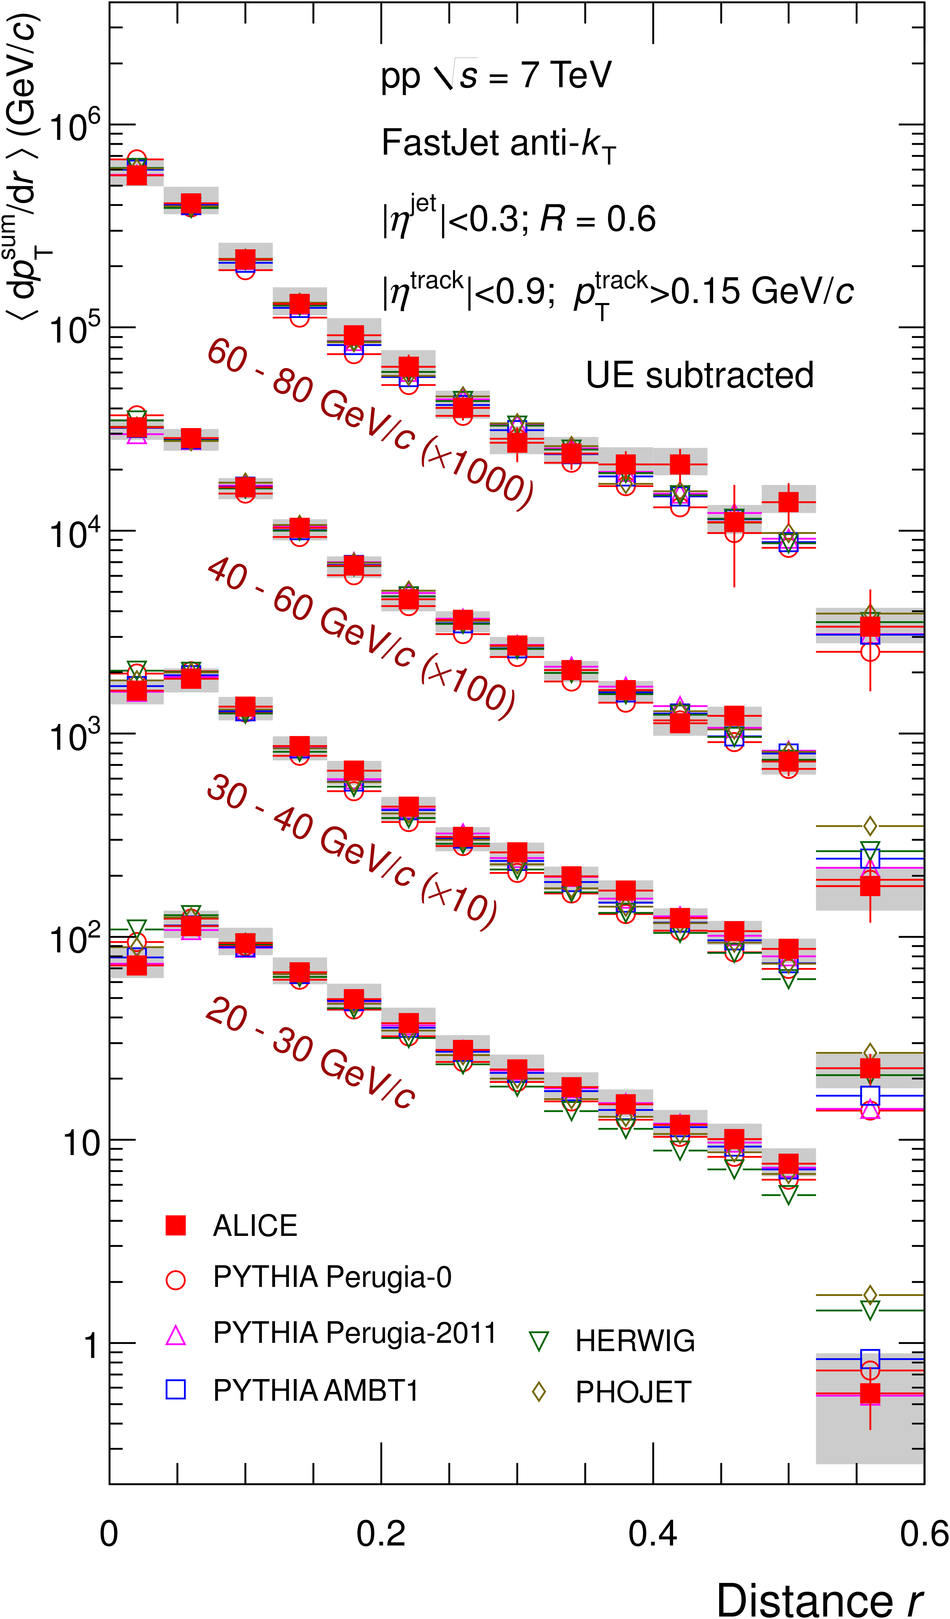
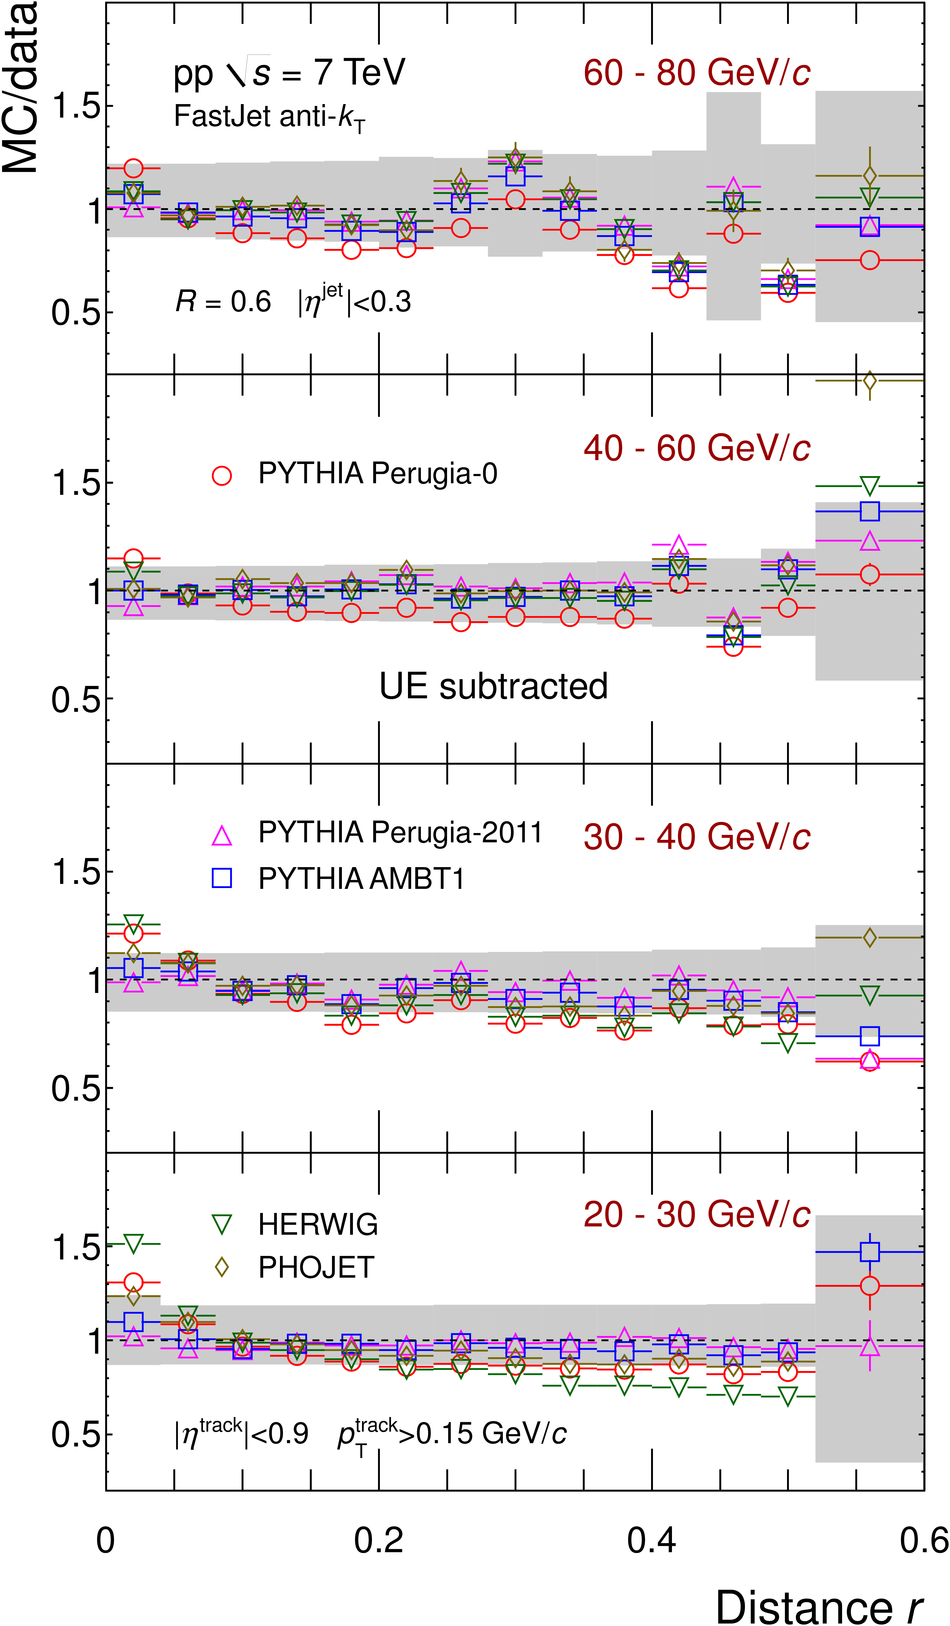
Figure 11
Top panel: Distributions of average radius '$\langle R_{\rm 80} \rangle$' containing 80% of the $p_{\rm T}$ with respect to the total reconstructed jet $p_{\rm T}$ as a function of jet $p_{\rm T}$ compared to MC models for pp collisions at $\sqrt{s}$ = 7 TeV for various jet resolution parameters ($R$ = 0.6 (top), $R$ = 0.4 (middle) and $R$ = 0.2 (bottom)). Bottom panel: Ratios MC/data. Shaded bands show quadratic sum of the statistical and systematic uncertainties of the data drawn at unity. | 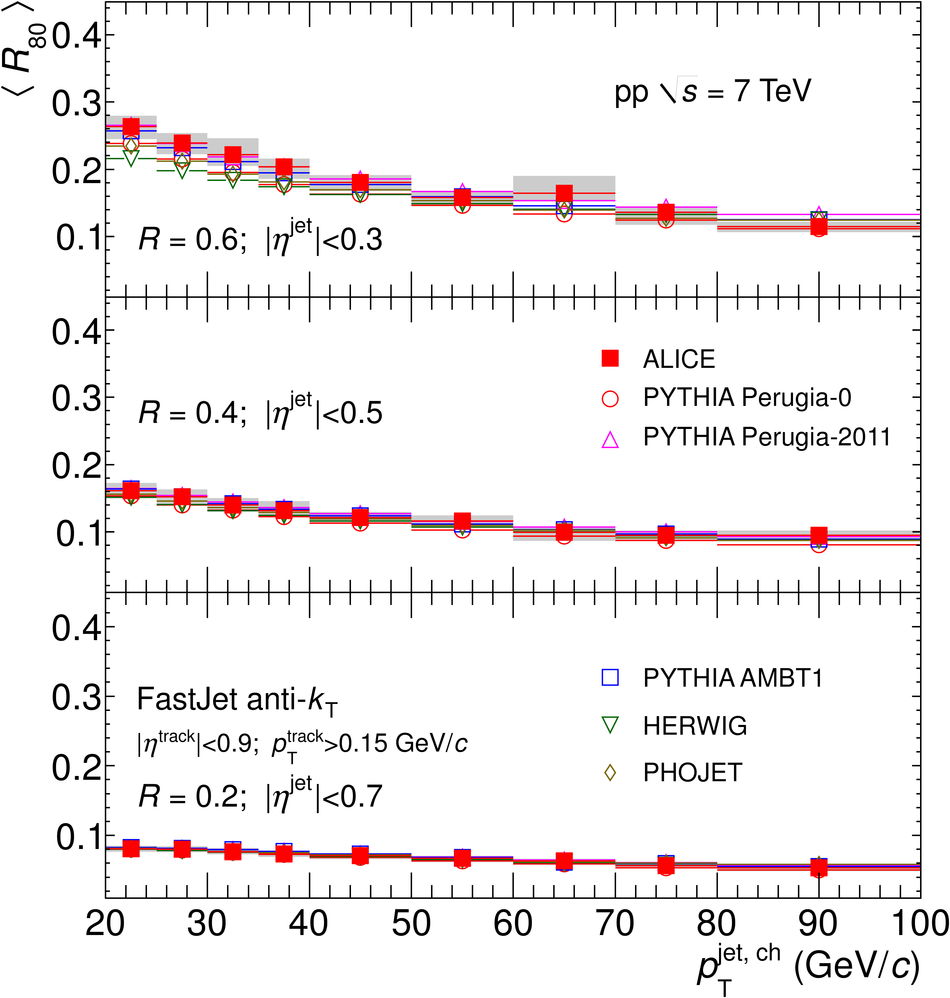 |
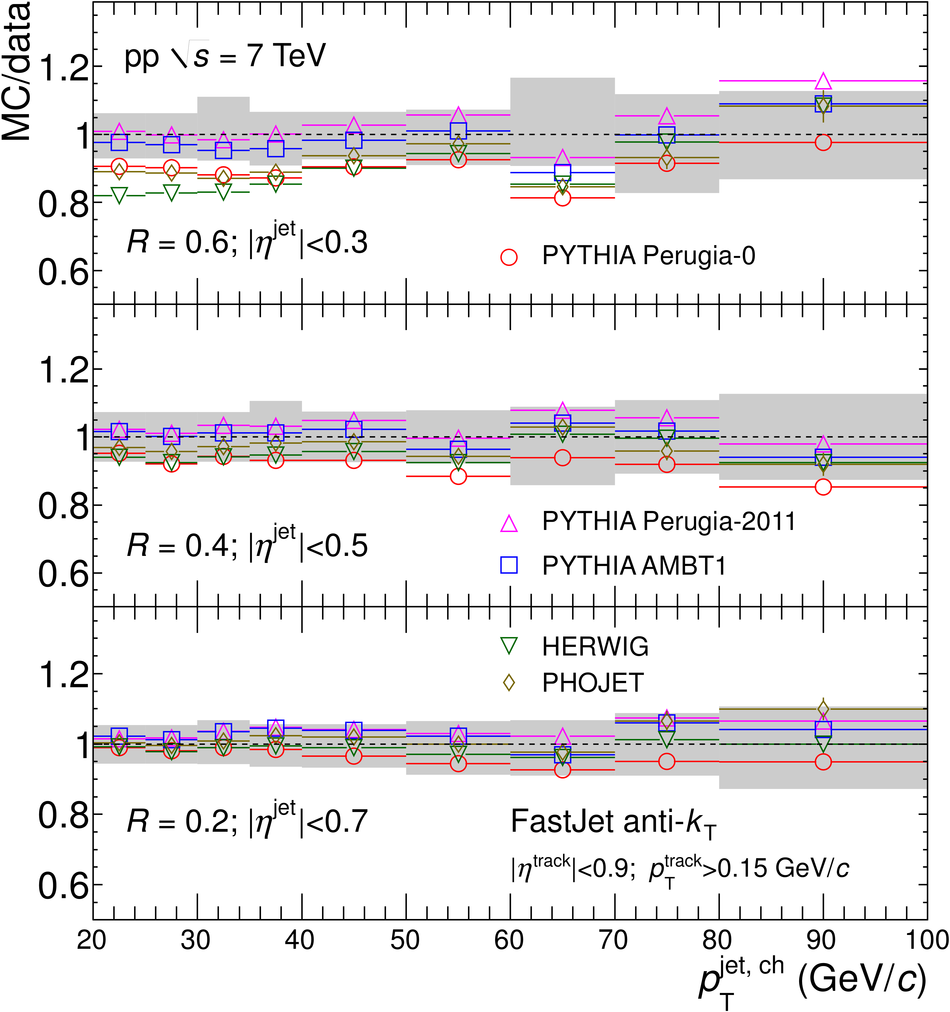
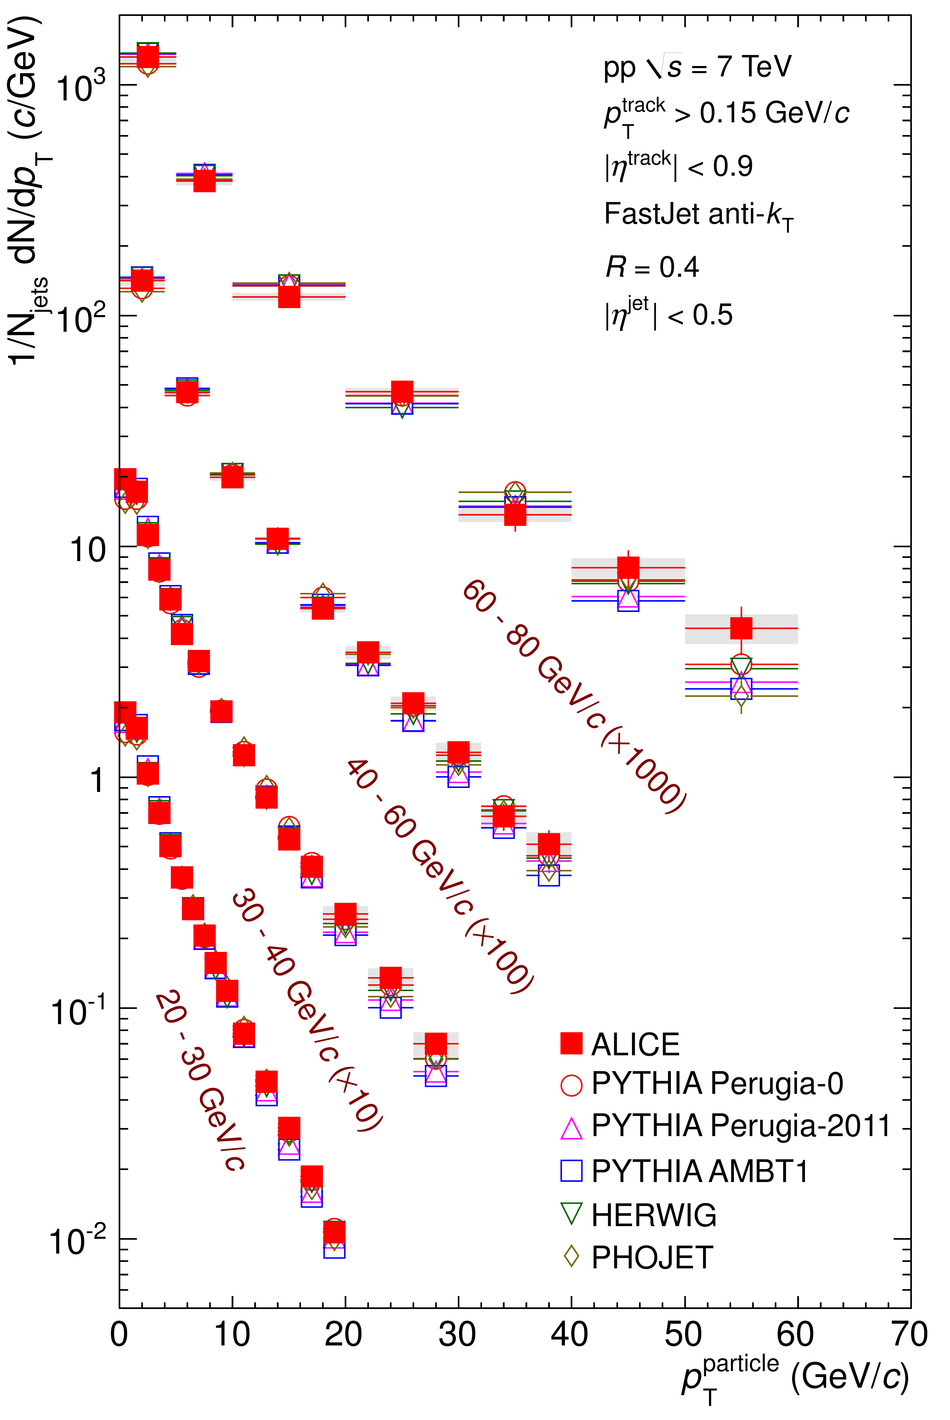
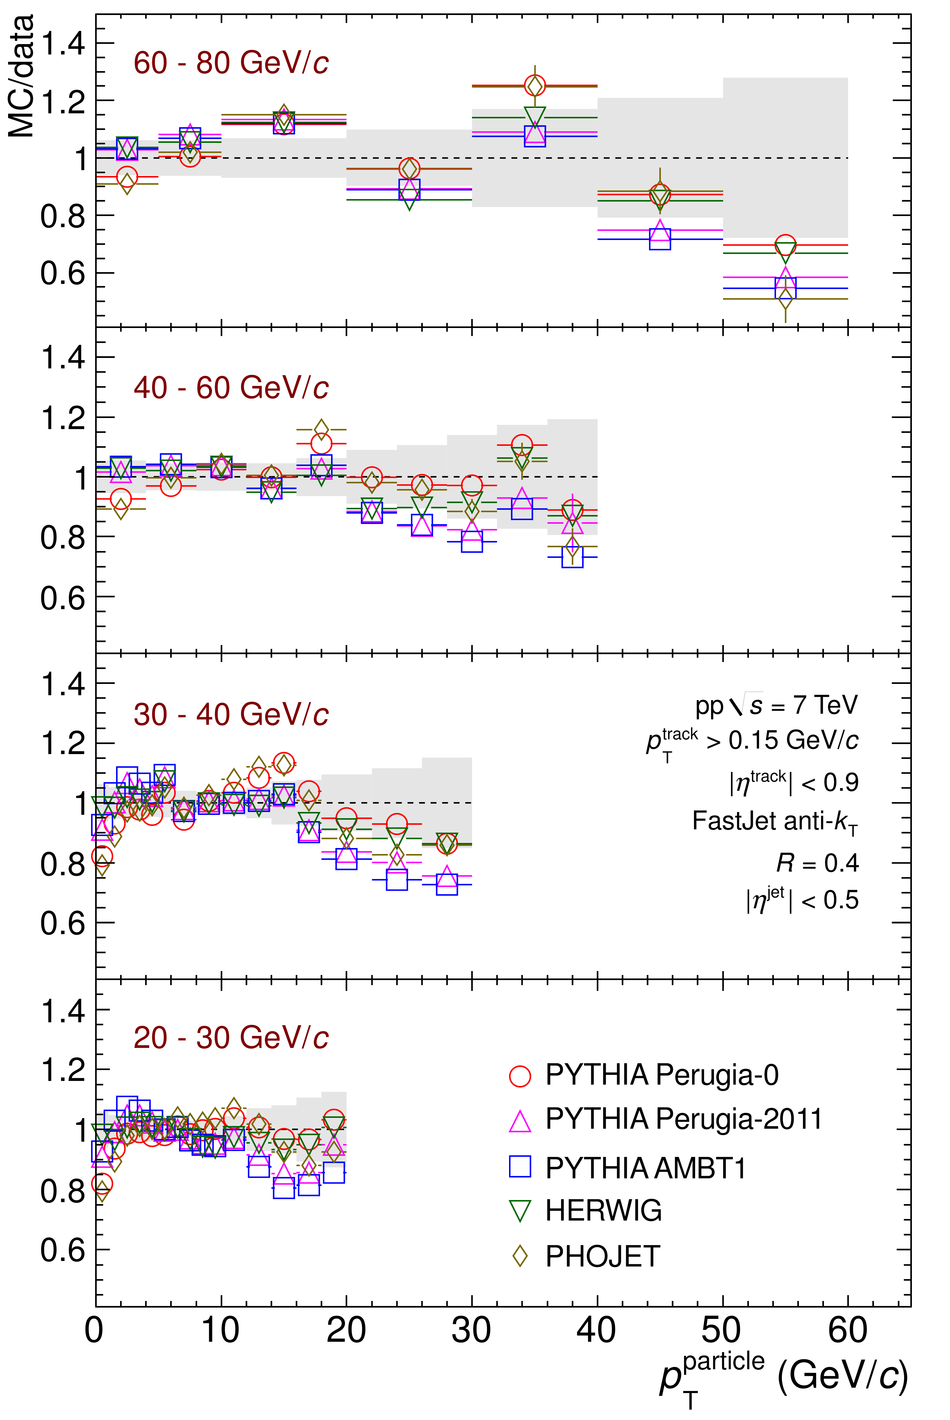
Figure 12
Top panel: Charged particle $p_{\rm T}$ spectra ${\rm d}N/{\rm d}p_{\rm T}$ in leading jets for different bins in jet transverse momentum, compared to simulations. For simulations and data, the UE contribution is subtracted Bottom panel: Ratio of simulations to data. The shaded band indicates the quadratic sum of statistical and systematic uncertainties on the data. | 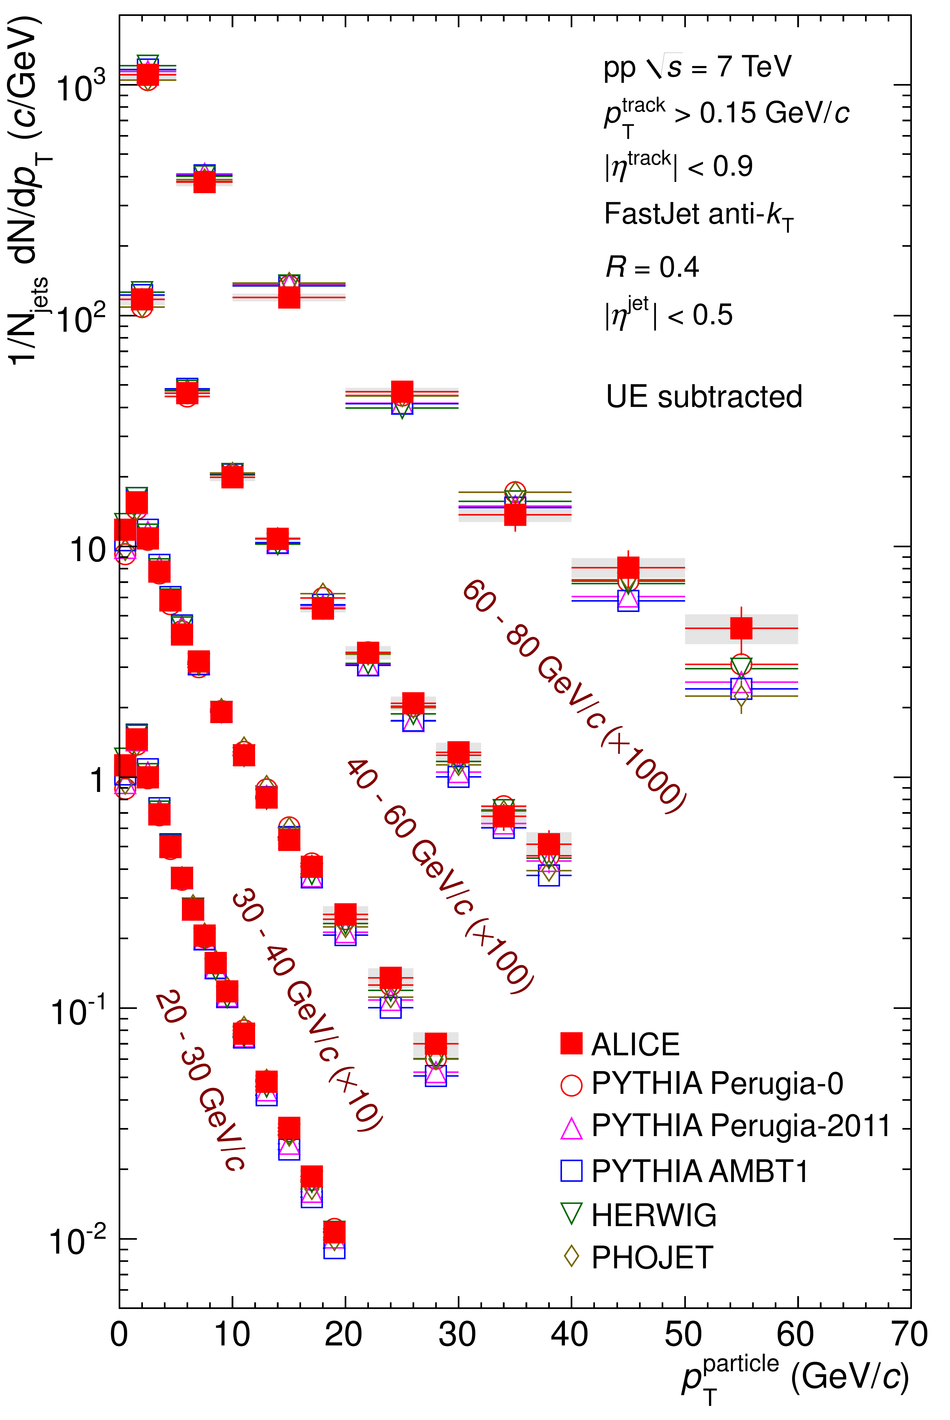 |

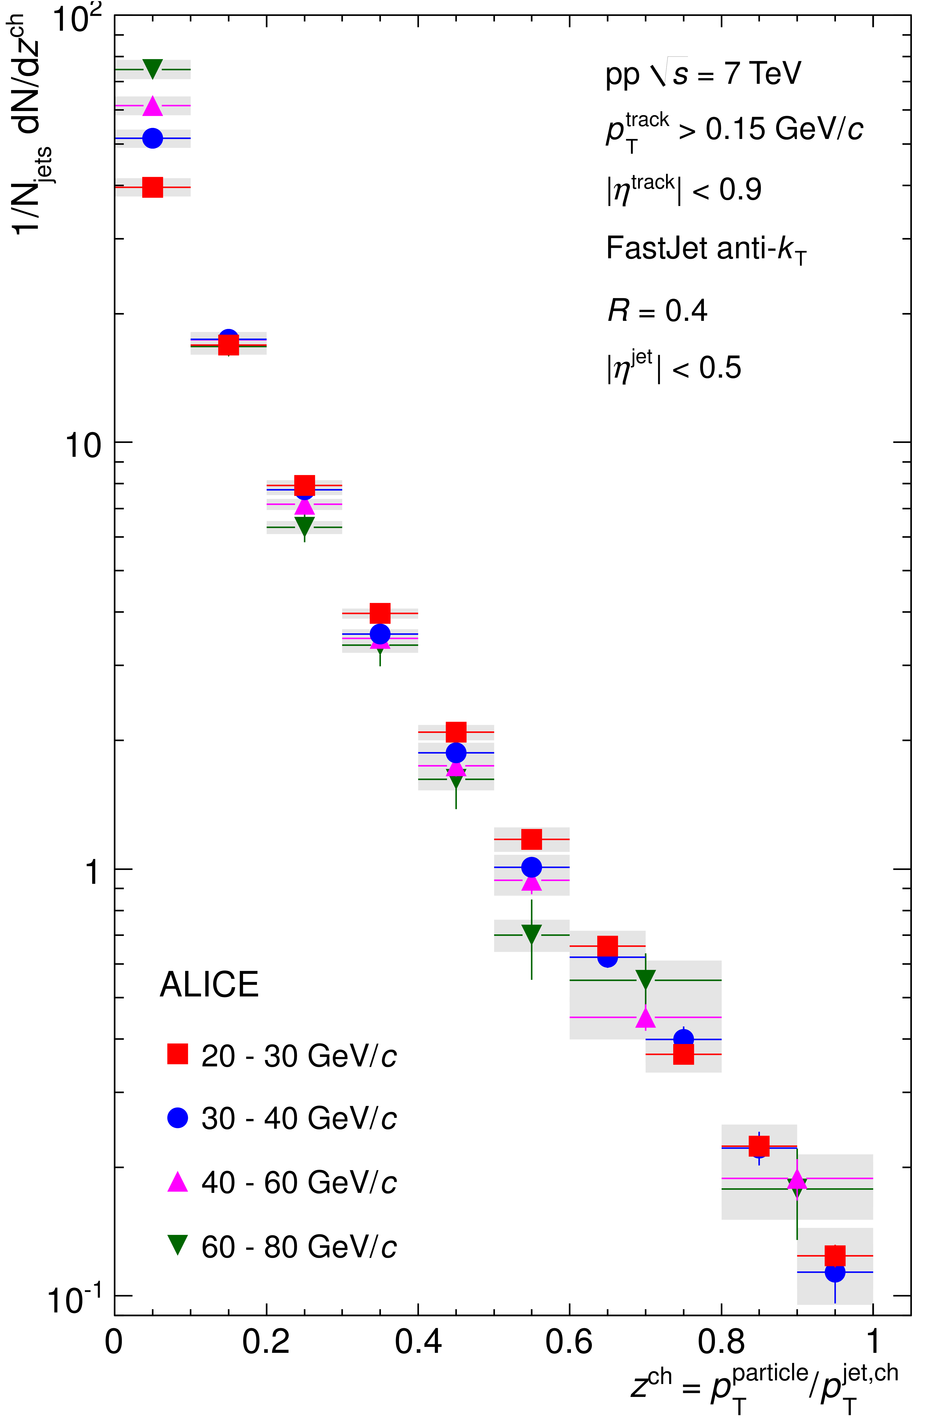
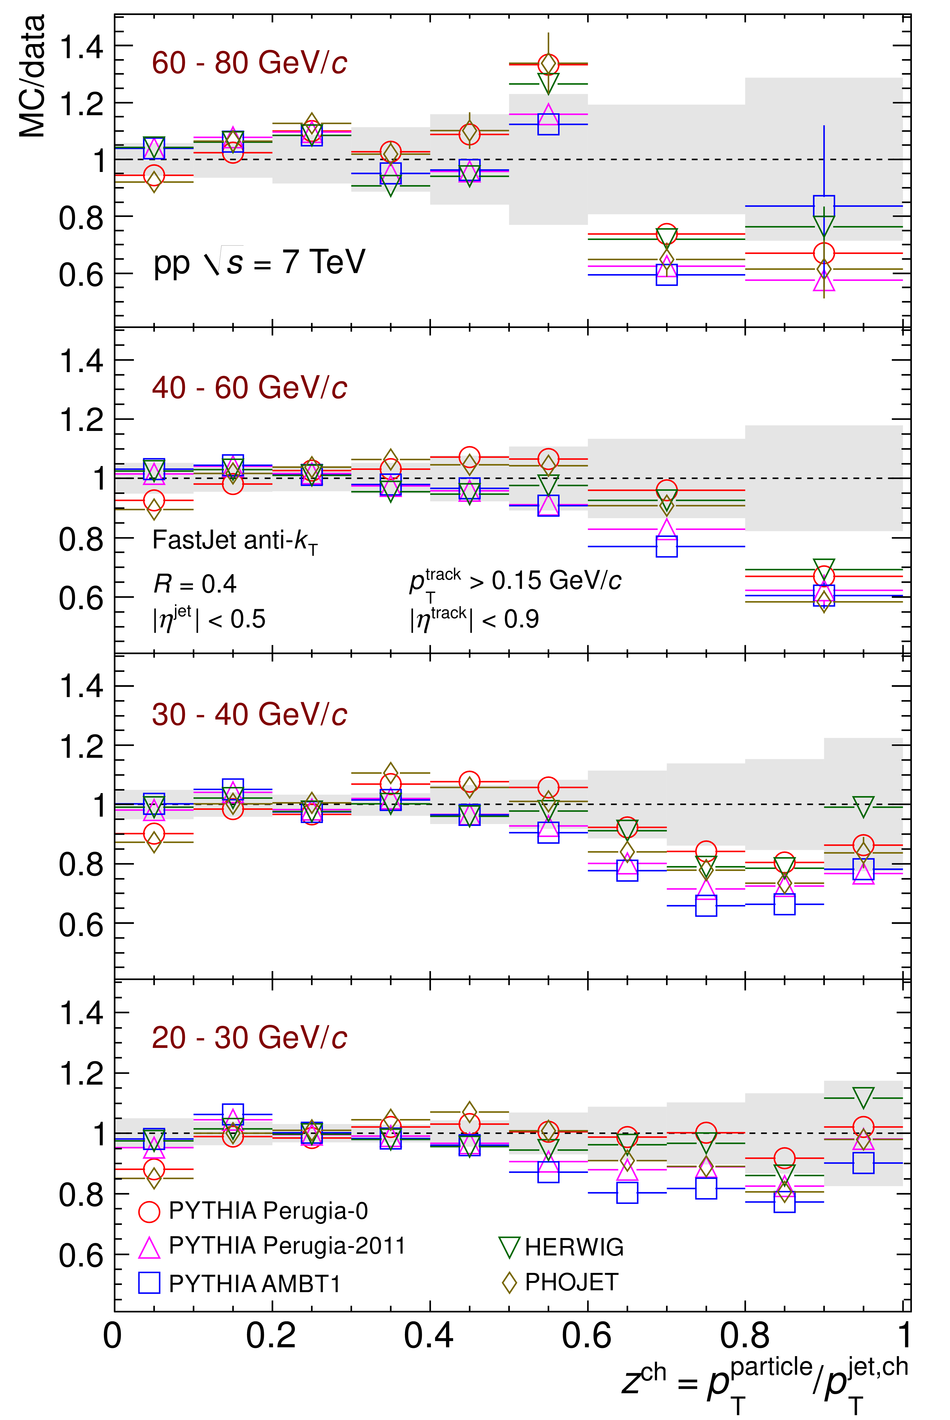
Figure 13
Top panel: Charged particle scaled $p_{\rm T}$ spectra ${\rm d}N/{\rm d}z^{\rm ch}$ in leading jets for different bins in jet transverse momentum. Bottom panel: Ratio of simulations to data. The shaded band indicates the quadratic sum of statistical and systematic uncertainties on the data. UE contributions are subtracted from both data and simulations. | 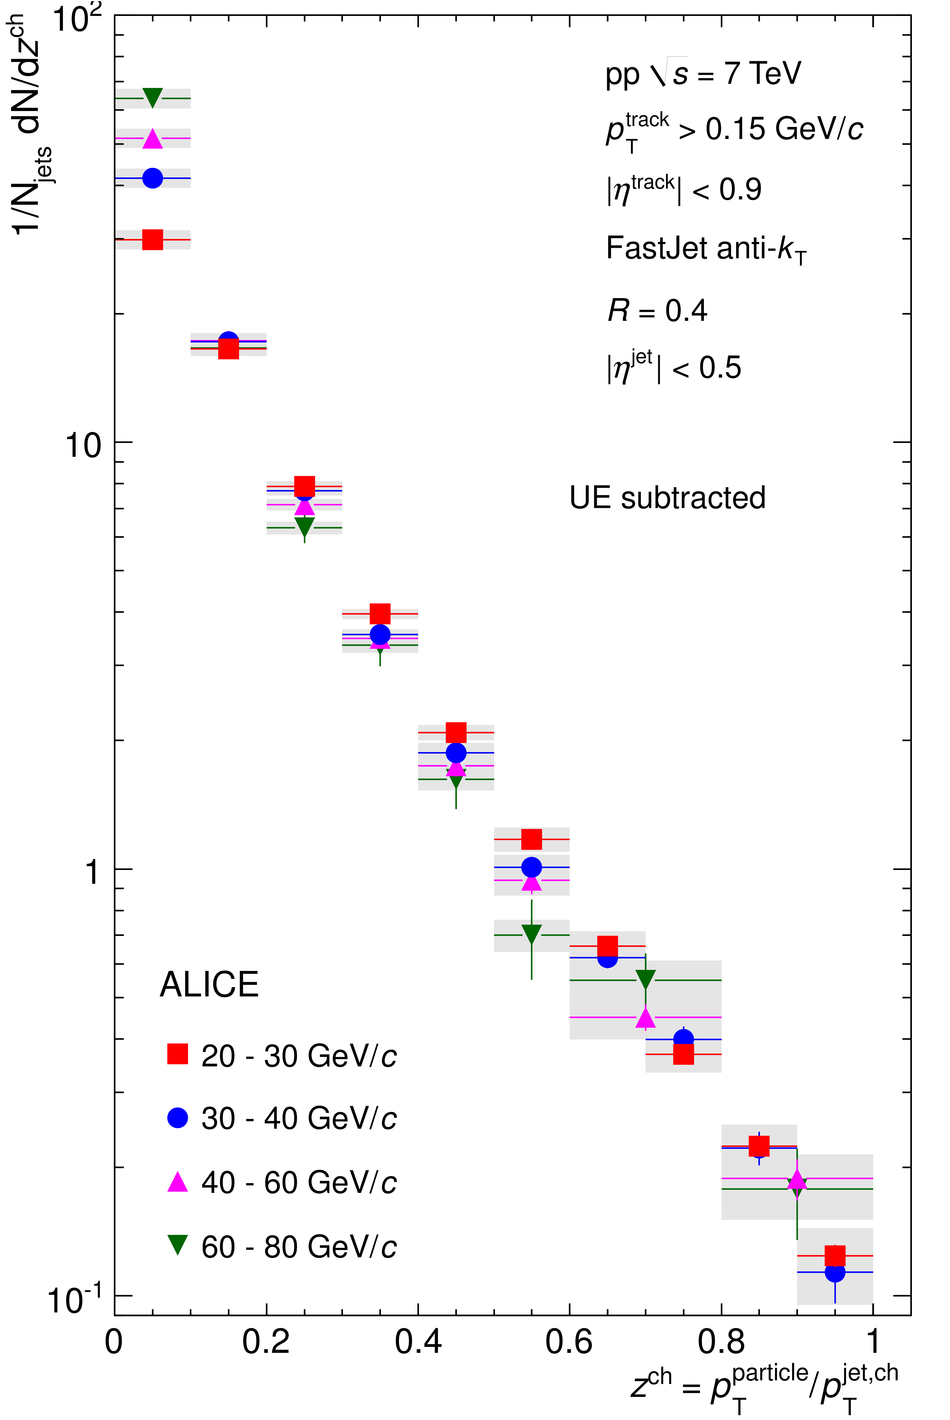 |
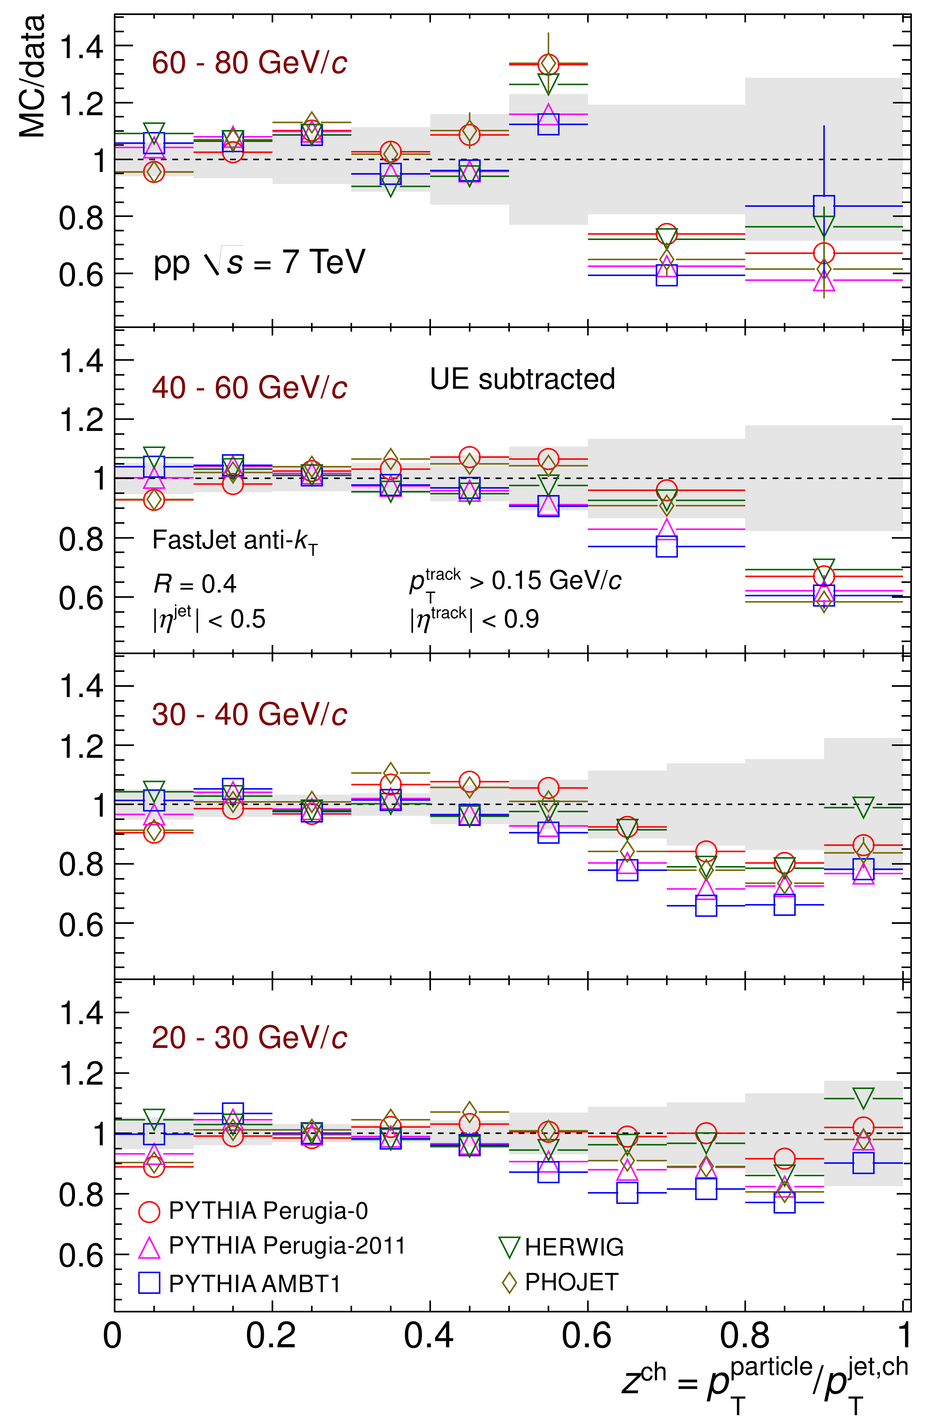
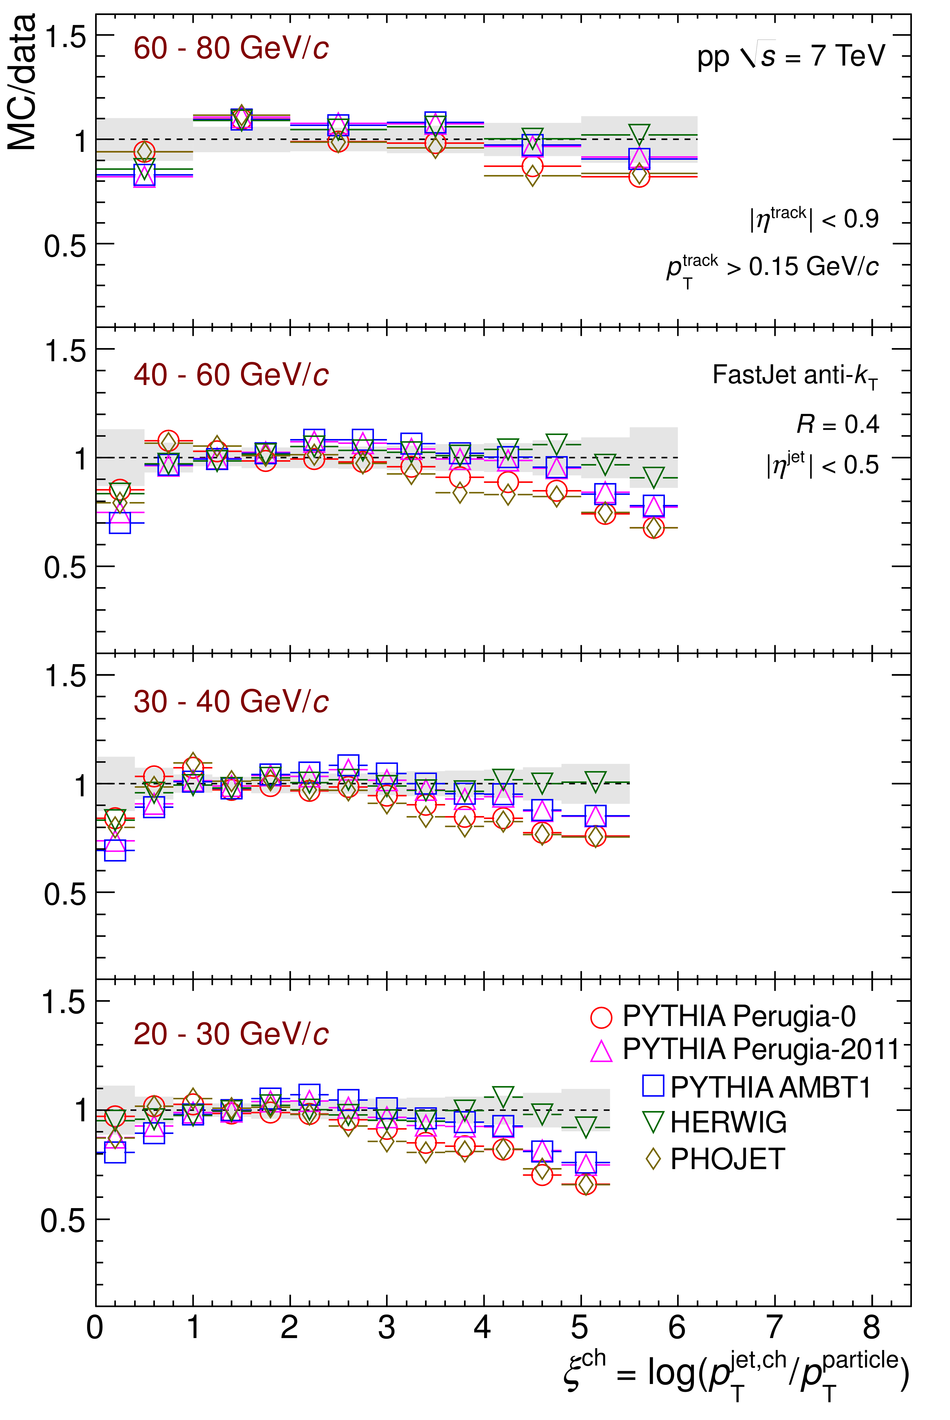
Figure 14
Top panel: Charged particle scaled $p_{\rm T}$ spectra ${\rm d}N/{\rm d}{\xi^{\rm ch}}$ in leading jets for different bins in jet transverse momentum Bottom panel: Ratio of simulations to data. The shaded band indicates the quadratic sum of statistical and systematic uncertainties on the data. UE contributions are subtracted from both data and simulations. | 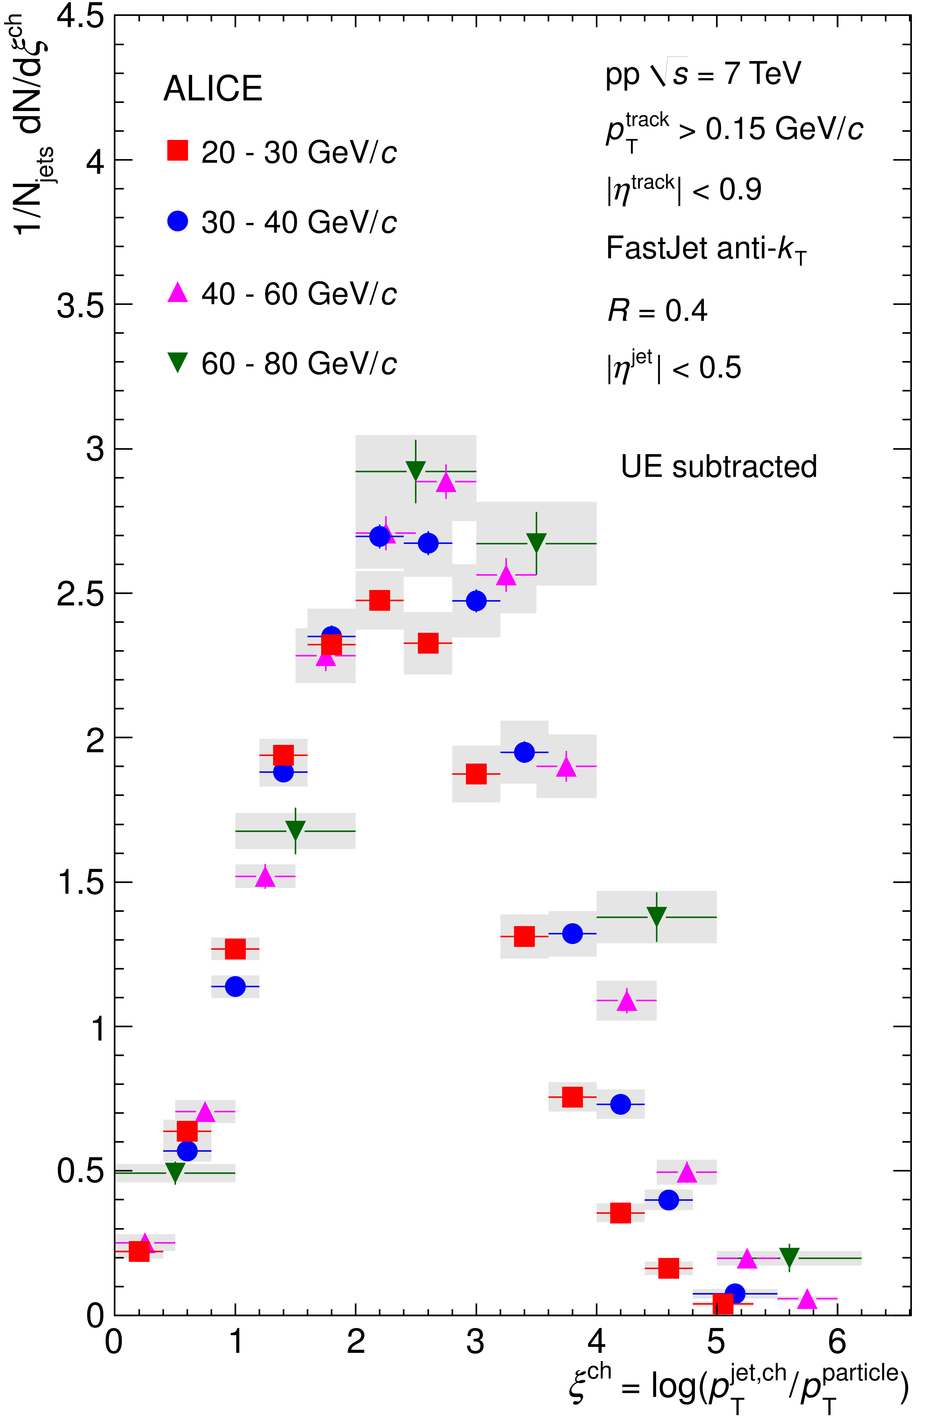 |
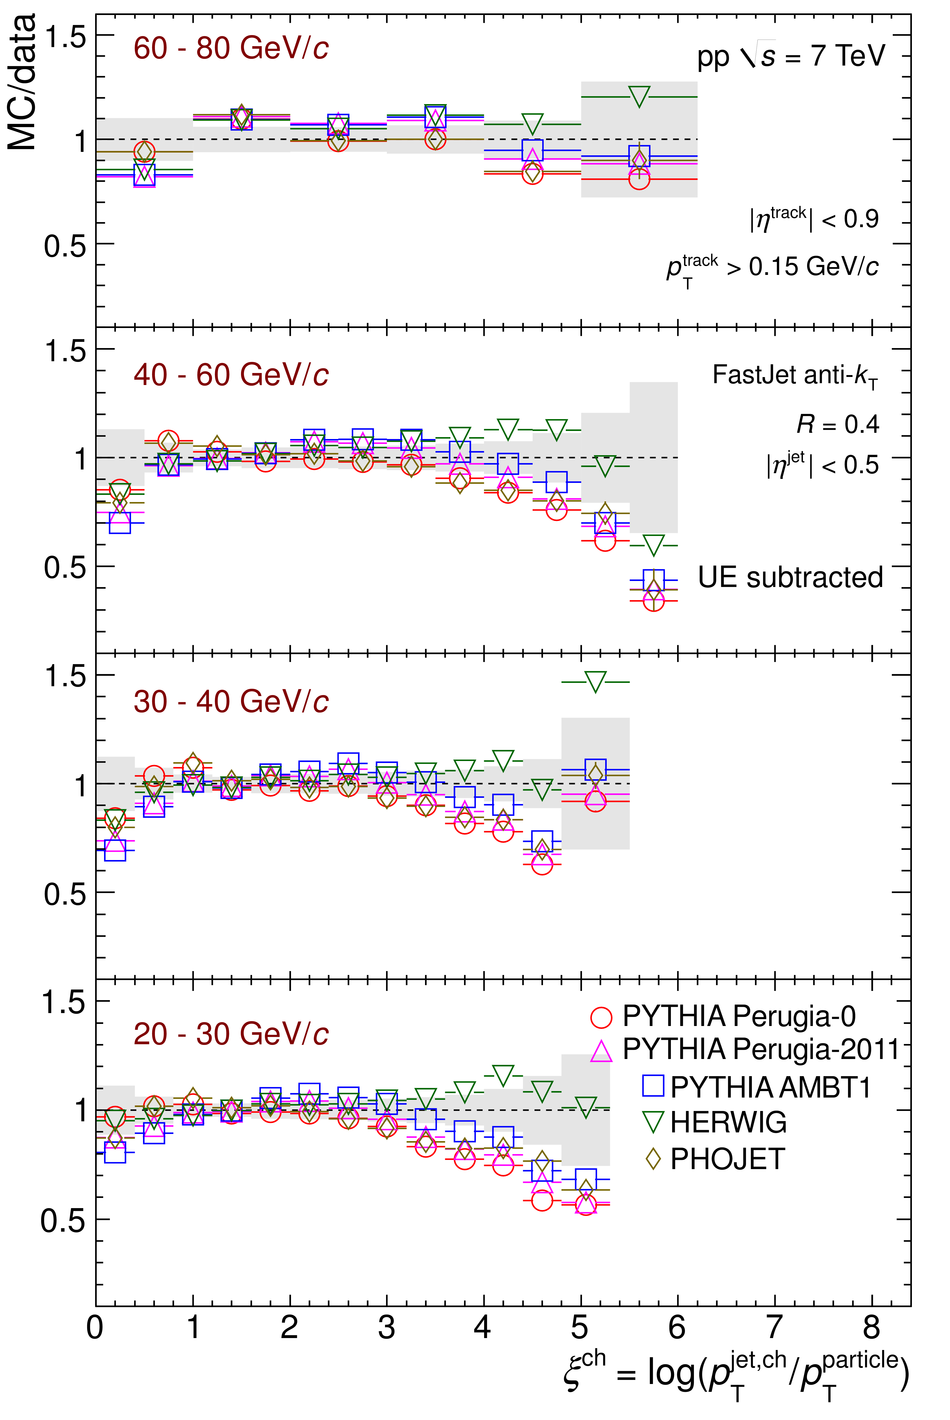
Figure 15
Top panels: Charged jet cross sections measured in the ALICE experiment in pp collisions at $\sqrt{s}$ = 7 TeV without UE subtraction compared to several MC generators: PYTHIA AMBT1, PYTHIA Perugia-0 tune, PYTHIA Perugia-2011 tune, HERWIG, and PHOJET. Bottom panels: Ratios MC/Data. Shaded bands show quadratic sum of statistical and systematic uncertainties on the data drawn at unity. |  |