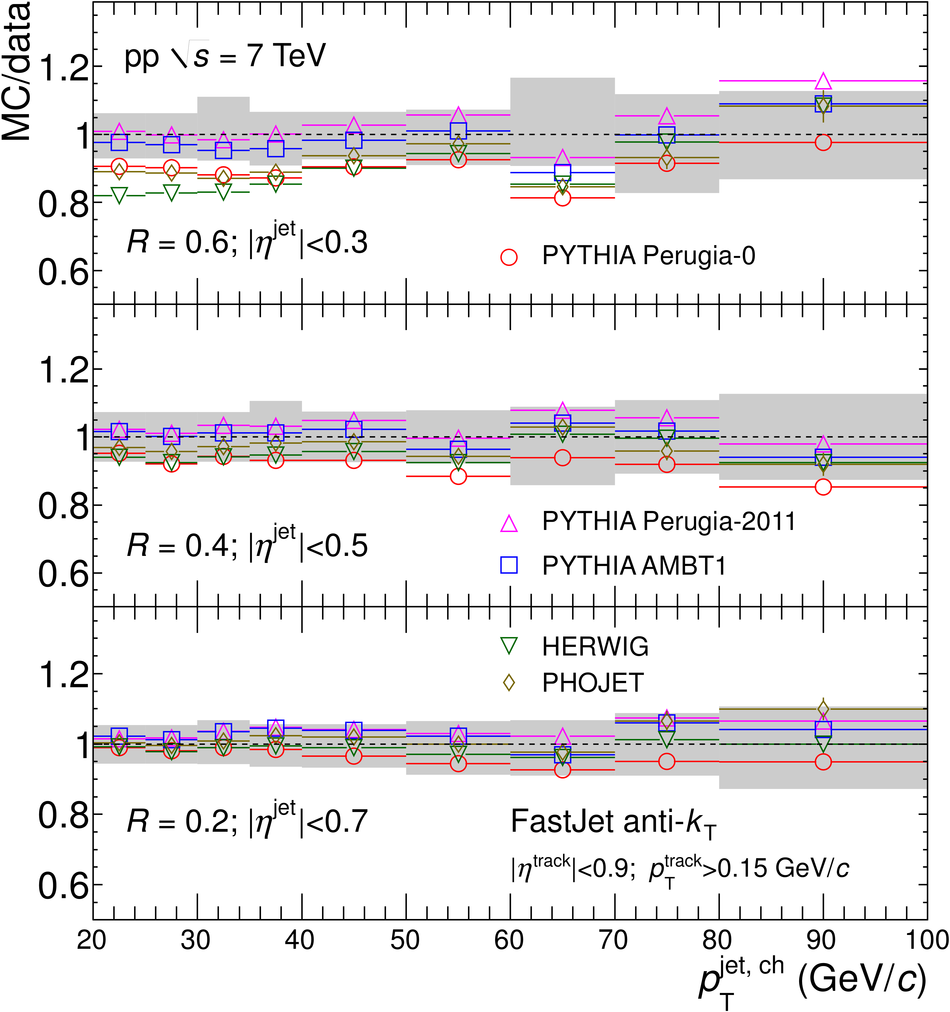
Top panel: Distributions of average radius '$\langle R_{\rm 80} \rangle$' containing 80% of the $p_{\rm T}$ with respect to the total reconstructed jet $p_{\rm T}$ as a function of jet $p_{\rm T}$ compared to MC models for pp collisions at $\sqrt{s}$ = 7 TeV for various jet resolution parameters ($R$ = 0.6 (top), $R$ = 0.4 (middle) and $R$ = 0.2 (bottom)). Bottom panel: Ratios MC/data. Shaded bands show quadratic sum of the statistical and systematic uncertainties of the data drawn at unity. | 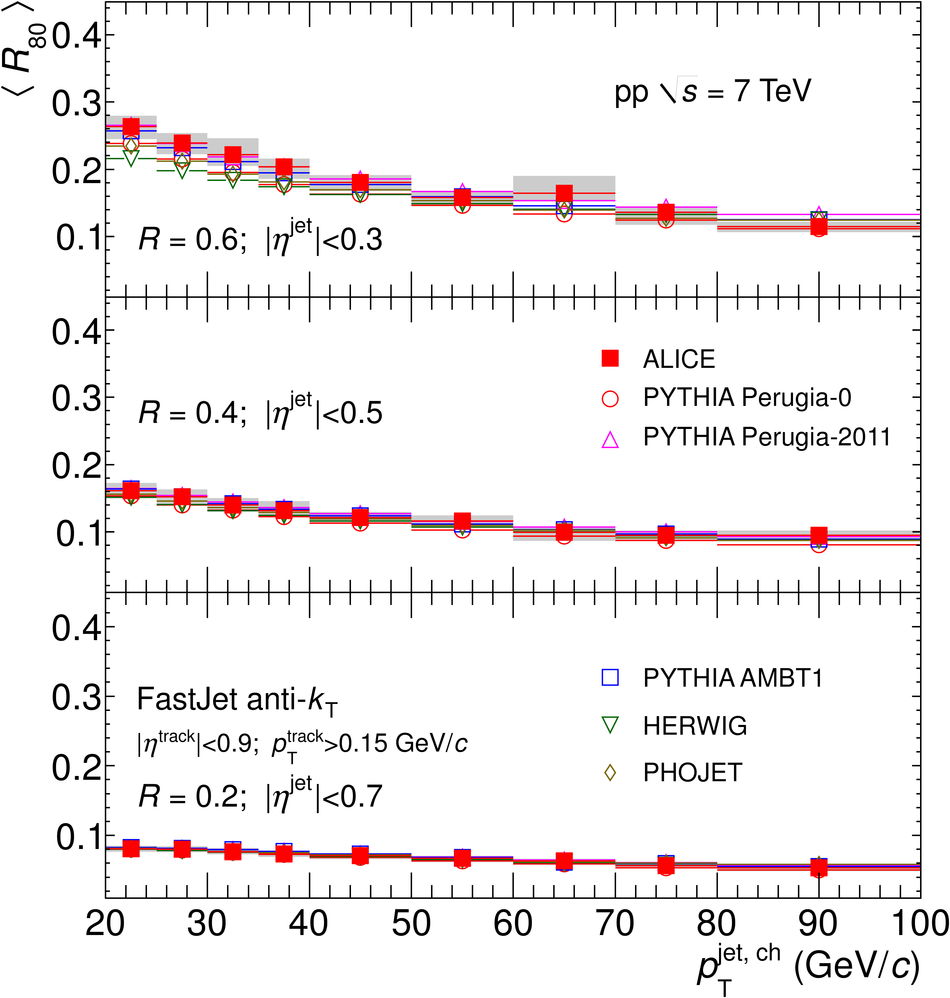 |