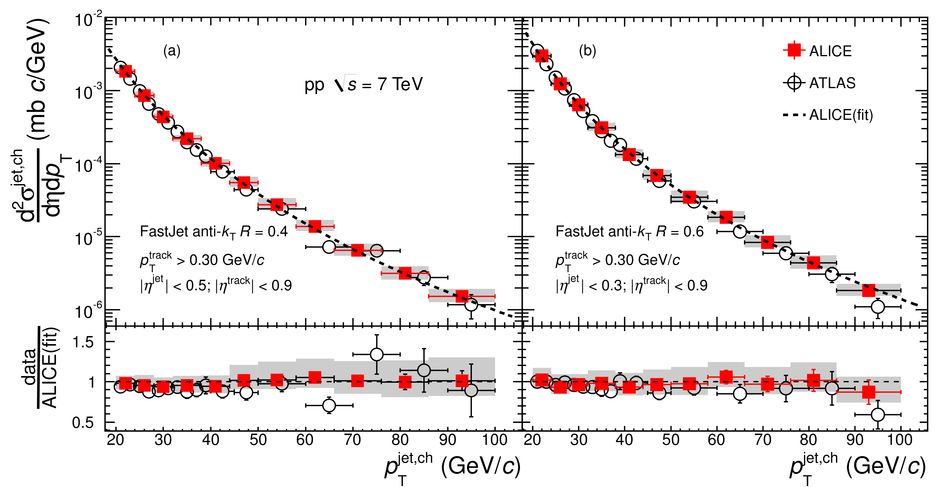
Top panels: Comparison of the charged jet cross section in the ALICE and the ATLAS experiments in pp collisions at $\rm{\sqrt{s}=7}$ TeV. Statistical and systematic uncertainties are shown separately for ALICE data points, the gray bands indicating the systematic uncertainties, while for the ATLAS data points, the error bars show the statistical and systematic uncertainties summed in quadrature The dotted line represents a Tsallis fit used to parametrize the ALICE data Bottom panels: The ratio of the ALICE and ATLAS charged jet spectrum to the parametrized ALICE data Note that the labels in the figures correspond to the ALICE measurements (see text for details). |  |