The nuclear modification factor, $R_{\rm AA}$, of the prompt charmed mesons ${\rm D^0}$, ${\rm D^+}$ and ${\rm D^{*+}}$, and their antiparticles, was measured with the ALICE detector in Pb-Pb collisions at a centre-of-mass energy $\sqrt{s_{\rm NN}} = 2.76$ TeV in two transverse momentum intervals, $5<~p_{\rm T}<~8$ GeV/$c$ and $8<~p_{\rm T}<~16$ GeV/$c$, and in six collision centrality classes. The $R_{\rm AA}$ shows a maximum suppression of a factor of 5-6 in the 10% most central collisions. The suppression and its centrality dependence are compatible within uncertainties with those of charged pions. A comparison with the $R_{\rm AA}$ of non-prompt ${\rm J}/\psi$ from B meson decays, measured by the CMS Collaboration, hints at a larger suppression of D mesons in the most central collisions.
Note:
Addendum to this paper published on JHEP 6 (2017) 032, also available at CDS: ALICE Public Note: ALICE-PUBLIC-2017-004
(see Additional Figures)
JHEP 11 (2015) 205
HEP Data
e-Print: arXiv:1506.06604 | PDF | inSPIRE
CERN-PH-EP-2015-151
Figure 1
Distributions of the ${\rm K}\pi$ invariant mass for $\Dzero$ candidates (upper panels) and ${\rm K}\pi\pi$ invariant mass for $\Dplus$ candidates (central panels) and of theinvariant mass difference $M({\rm K}\pi\pi)-M({\rm K}\pi)$ for $\Dstar$ candidates (lower panels) and the corresponding charge conjugates in two $\pt$ intervals (left and right panels) for $16.4\times10^6$ Pb--Pb collisions in the 0-10% centrality class. The curves show the fit functions described in the text. The red short-dashed line represents the background fit function For the $\Dzero$ meson, the gray dashed line represents the background without the inclusion of the template for the contribution of reflections, i.e.,signal candidates with swapped ${\rm (K,\pi)}$ mass hypothesis. The template is defined as the sum of two Gaussians with parameters fixed to the values obtained in simulation. | 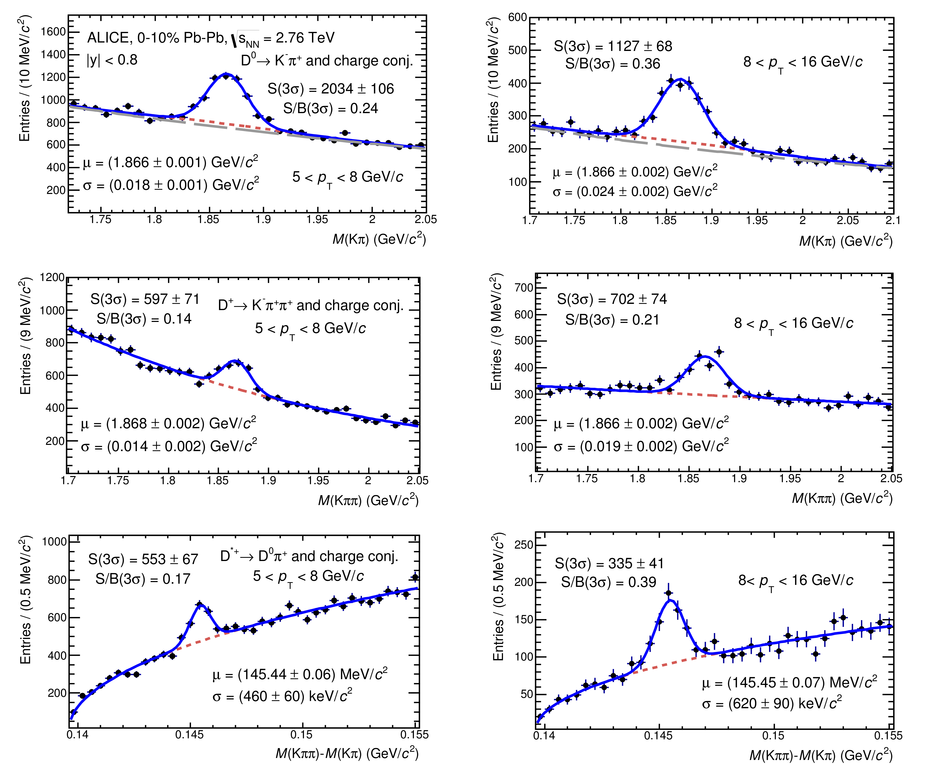 |
Figure 2
$\RAA$ as a function of centrality ($\langle N_{\rm part}\rangle$, see text) of $\Dzero$, $\Dplus$ and $\Dstar$ in $5< \pt< 8$ Gev/$c$ (left) and $8< \pt< 16 $Gev/$c$ (right). The bars represent the statistical uncertainty while the filled (empty) boxes represent the systematic uncertainties that are correlated (uncorrelated) among centrality intervals. The symbols for $\Dstar$ and $\Dplus$ are shifted by $\langle N_{\rm part}\rangle$ = 10 for better visibility. |  |

Figure 3
Comparison of the D meson $\RAA$ (average of $\Dzero$, $\Dplus$ and $\Dstar$) and of the charged pion $\RAA$ in $5< \pt< 8 $ Gev/$c$ (left) and in $8< \pt< 16 $ Gev/$c$ (right). The right panel also includes the $\RAA$ of non-prompt $\jpsi$ mesons in $6.5< \pt< 30$ Gev/$c$ measured by the CMS Collaboration. The vertical bars represent the statistical uncertainties. The D meson systematic uncertainties are displayed as in the previous figures The total systematic uncertainties of charged pions are shown by boxes The centrality-dependent systematic uncertainties are shown by boxes on the individual data points. | 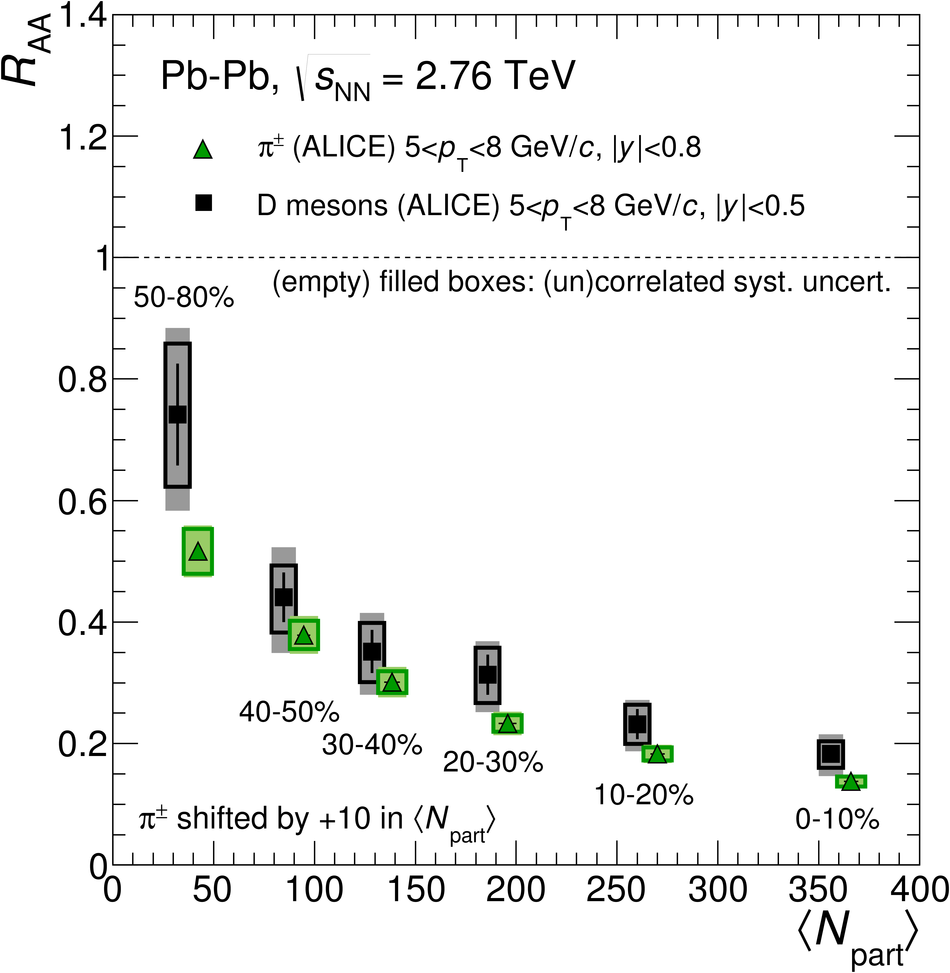 |

Figure 4
Comparison of the $\RAA$ measurements with the calculations by Djordjevic et al.[57] including radiative and collisional energy loss. Lines of the same style enclose a band representing the theoretical uncertainty Left: D mesons and charged pions in $8< \pt< 16 $ Gev/$c$. Right: D mesons in $8< \pt< 16 $ Gev/$c$ and non-prompt J/$\psi$ mesons in $6.5< \pt< 30 $ Gev/$c$ [30] For the latter, the model results for the case in which the b quark interactions are calculatedusing the c quark mass are shown as well [15]. | 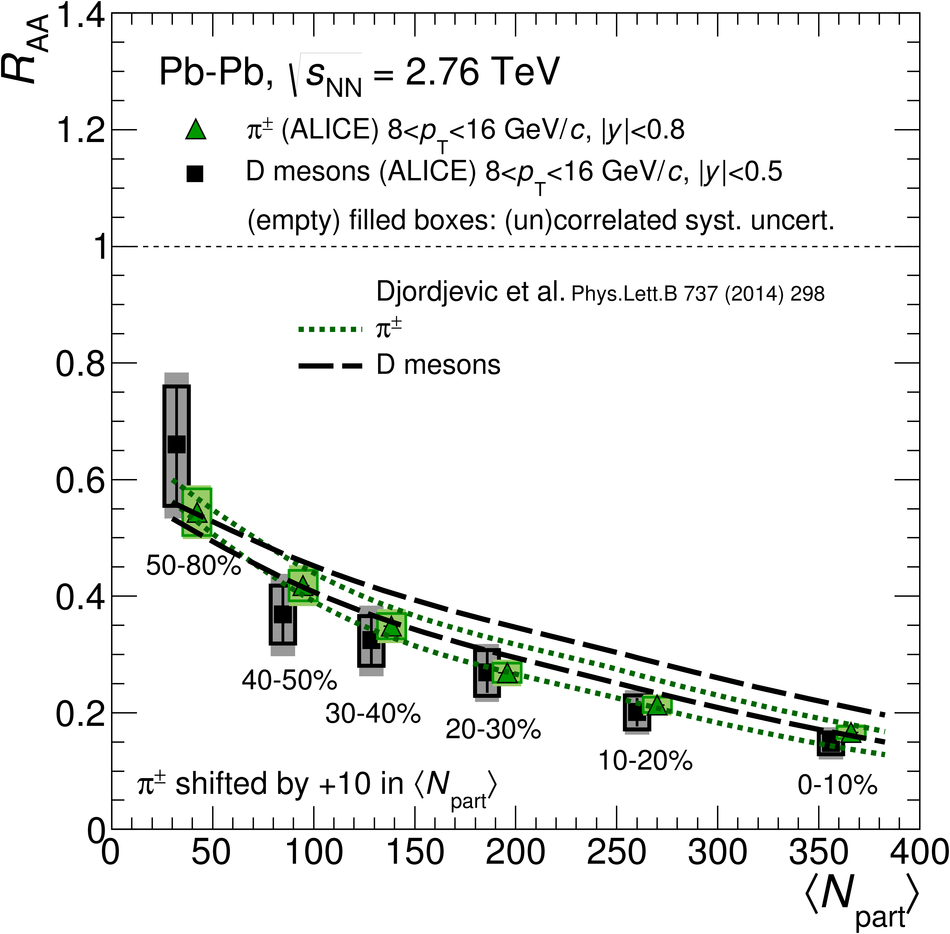 |
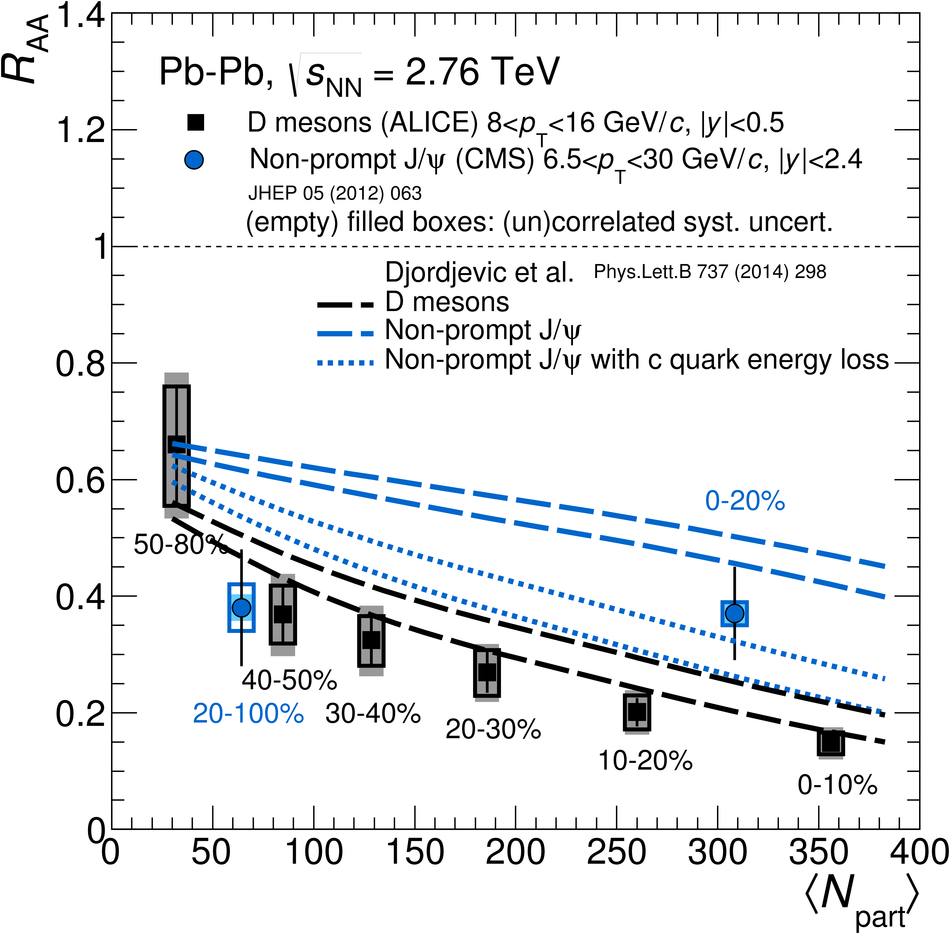
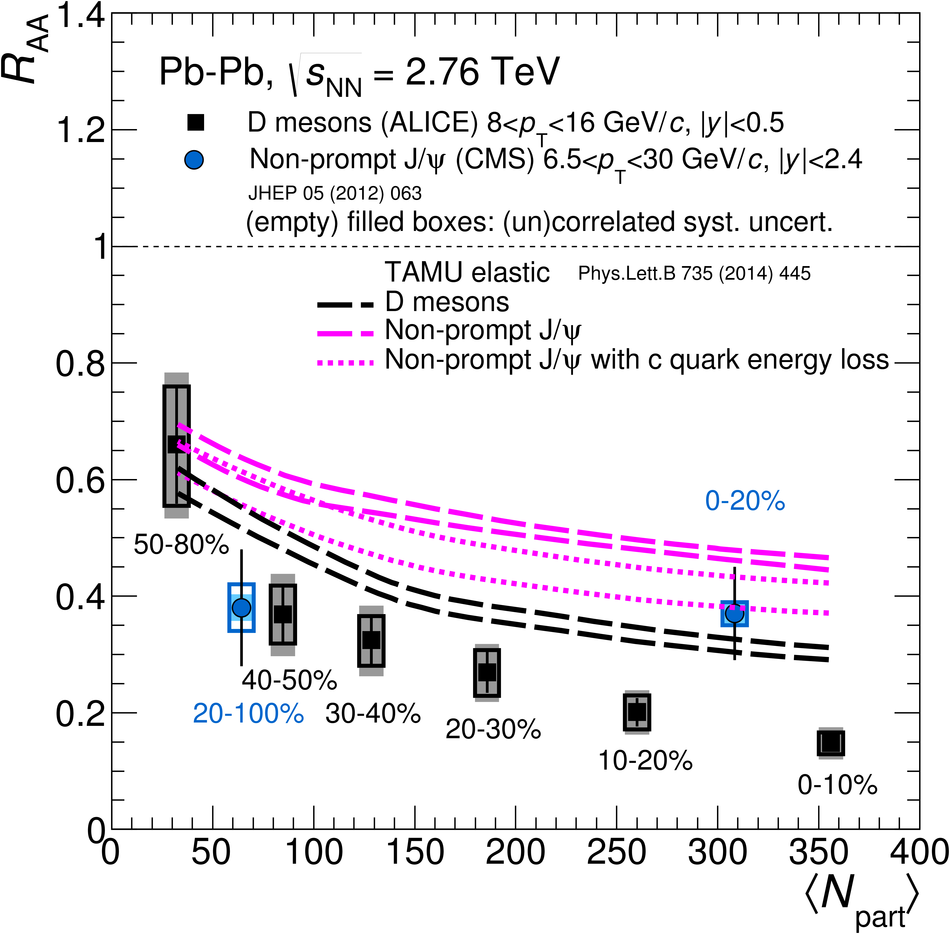
Figure 5
Comparison of the $\RAA$ measurements for D mesons ($8< \pt< 16 $ Gev/$c$) and non-prompt J/$\psi$ mesons ($6.5< \pt< 30 $ Gev/$c$) with the MC@sHQ+EPOS2 model including radiative and collisional interactions (left) and with the TAMU elastic model including collisional interactions via in-medium resonance formation For both models, results for the case in which the b quark interactions are calculated using the c quark mass are shown as well In the right-hand panel, the band between lines with the same style represents the theoretical uncertainty. |  |