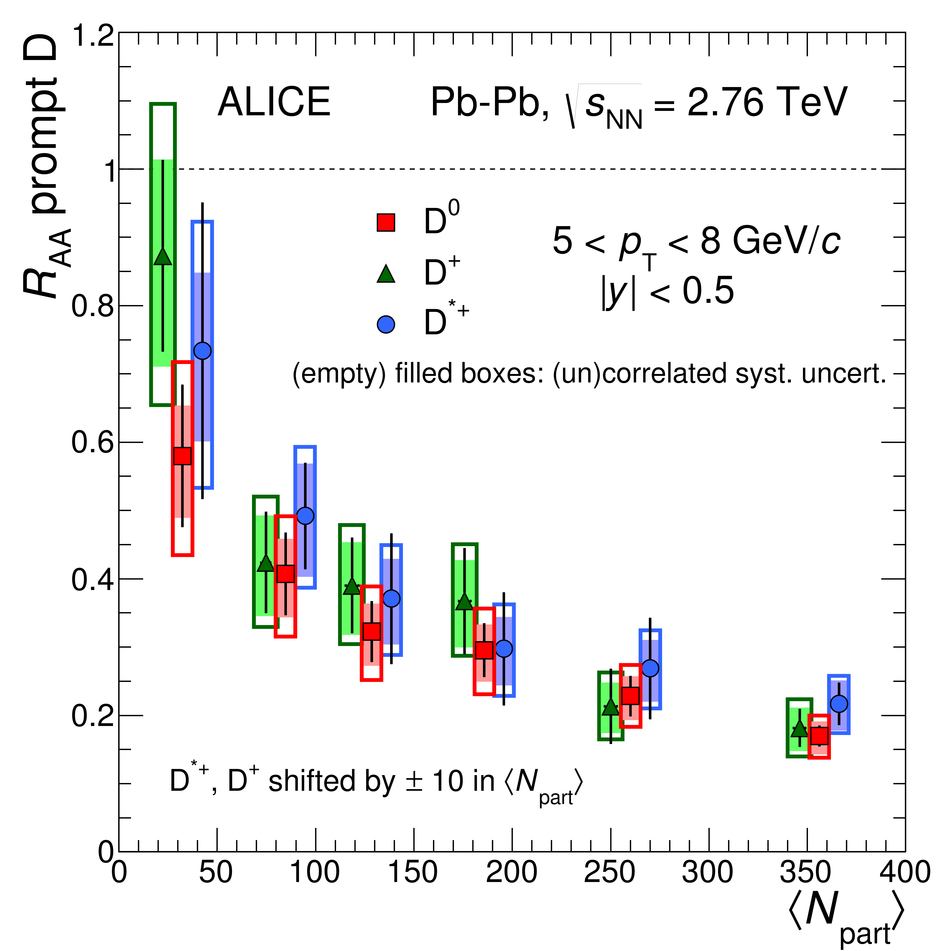
$\RAA$ as a function of centrality ($\langle N_{\rm part}\rangle$, see text) of $\Dzero$, $\Dplus$ and $\Dstar$ in $5< \pt< 8$ Gev/$c$ (left) and $8< \pt< 16 $Gev/$c$ (right). The bars represent the statistical uncertainty while the filled (empty) boxes represent the systematic uncertainties that are correlated (uncorrelated) among centrality intervals. The symbols for $\Dstar$ and $\Dplus$ are shifted by $\langle N_{\rm part}\rangle$ = 10 for better visibility. |  |