We report the measurement of a new observable of jet quenching in central Pb-Pb collisions at $\sqrt{s_{\rm NN}} = 2.76$ TeV, based on the semi-inclusive rate of charged jets recoiling from a high transverse momentum (high-$p_{\rm T}$) charged hadron trigger. Jets are measured using collinear-safe jet reconstruction with infrared cutoff for jet constituents of 0.15 GeV/$c$, for jet resolution parameters $R = 0.2$, 0.4 and 0.5. Underlying event background is corrected at the event-ensemble level, without imposing bias on the jet population. Recoil jet spectra are reported in the range $20< p_\mathrm{T,jet}^\mathrm{ch}< 100$ GeV/$c$. Reference distributions for pp collisions at $\sqrt{s} = 2.76$ TeV are calculated using Monte Carlo and NLO pQCD methods, which are validated by comparing with measurements in pp collisions at $\sqrt{s} = 7$ TeV. The recoil jet yield in central Pb-Pb collisions is found to be suppressed relative to that in pp collisions. No significant medium-induced broadening of the intra-jet energy profile is observed within 0.5 radians relative to the recoil jet axis. The angular distribution of the recoil jet yield relative to the trigger axis is found to be similar in central Pb-Pb and pp collisions, with no significant medium-induced acoplanarity observed. Large-angle jet deflection, which may provide a direct probe of the nature of the quasi-particles in hot QCD matter, is explored.
JHEP 09 (2015) 170
HEP Data
e-Print: arXiv:1506.03984 | PDF | inSPIRE
CERN-PH-EP-2015-136
Figure 1
Semi-inclusive distributions of jets recoiling from a hadron trigger for two exclusive TT classes (Eq.3}), for pp collisions at $\sqrt{s}$ = 7 TeV from ALICE data (top), pp collisions at $\sqrt{s}$ = 2.76 TeV from particle-level PYTHIA simulations (center), and central Pb-Pb collisions at $\sqrt{s_{\mathrm {NN}}}$ = 2.76 TeV from ALICE data (bottom). All distributions are a function of $p_\mathrm{T,jet}^\mathrm{reco,ch}$ (Eq.2). Distributions from data are not corrected for background fluctuations and instrumental effects. |  |

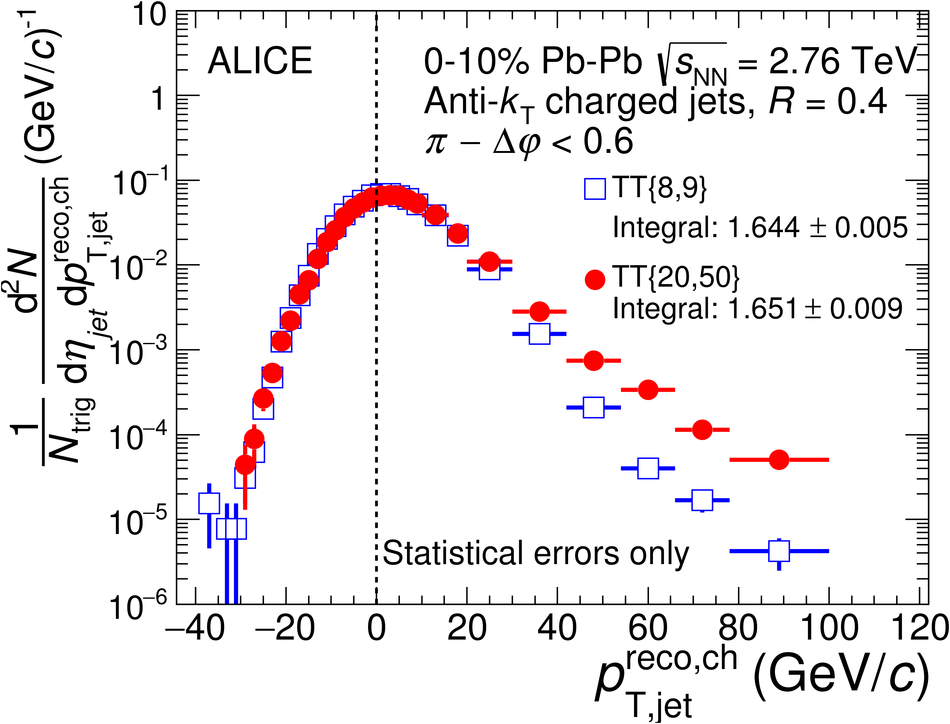
Figure 2
Uncorrected trigger-normalized recoil charged jet distributions for central Pb-Pb collisions, with Signal TT{20,50} and Reference TT{8,9}. Jets are reconstructed with the anti-$k_\mathrm{T}$ algorithm, constituent $p_\mathrm{T,const} > 0.15$ $\mathrm{GeV/}c$, and ${R}$ = 0.2, 0.4, and 0.5. Up: individual spectra. Just below: their ratios. The red line shows a linear fit in the indicated region. Error bars show statistical errors only. Third panel (from top) (${R}$ = 0.4) is identical to bottom panel in Fig.1.
| 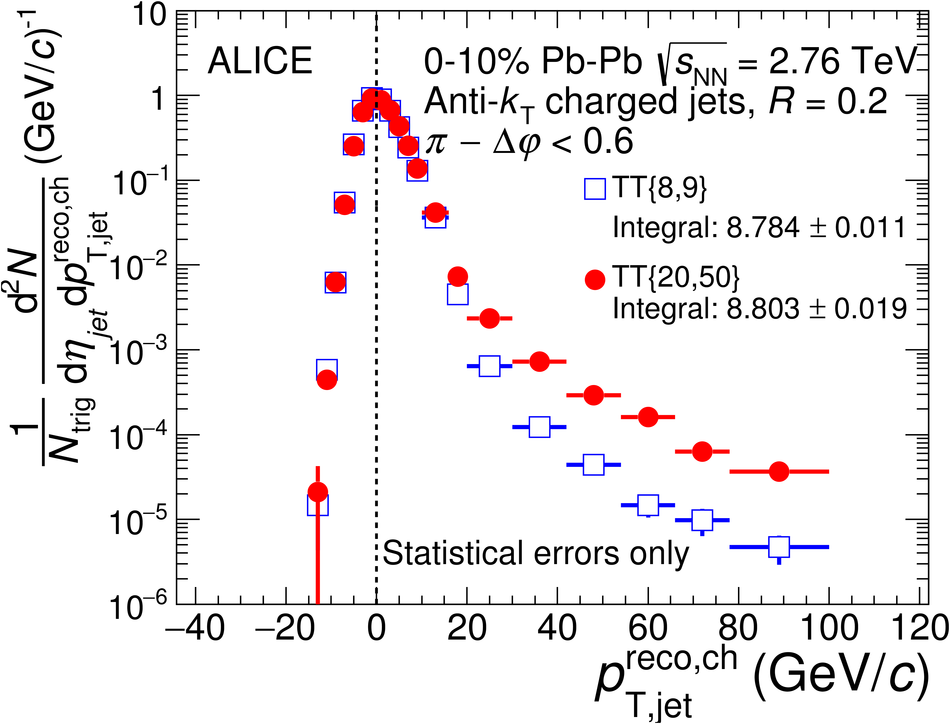 |
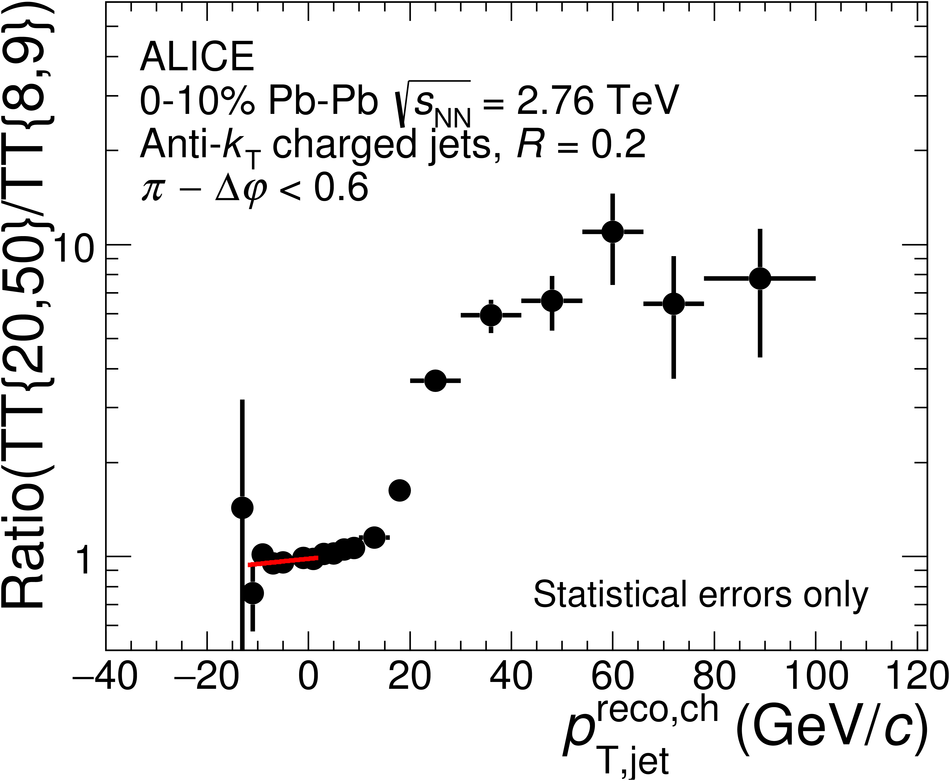
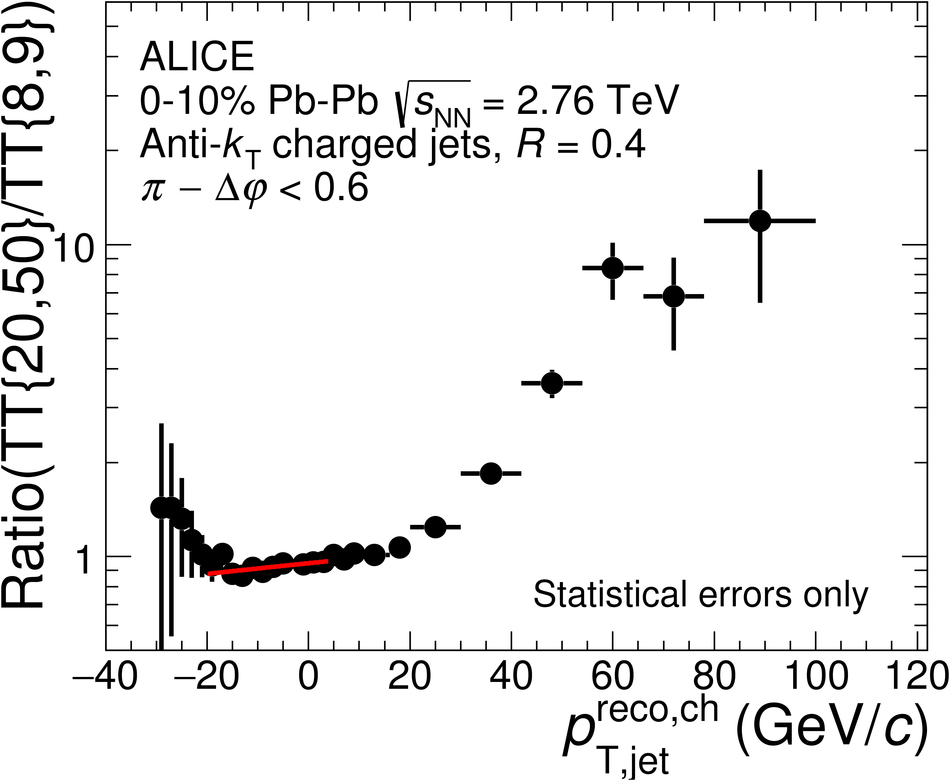
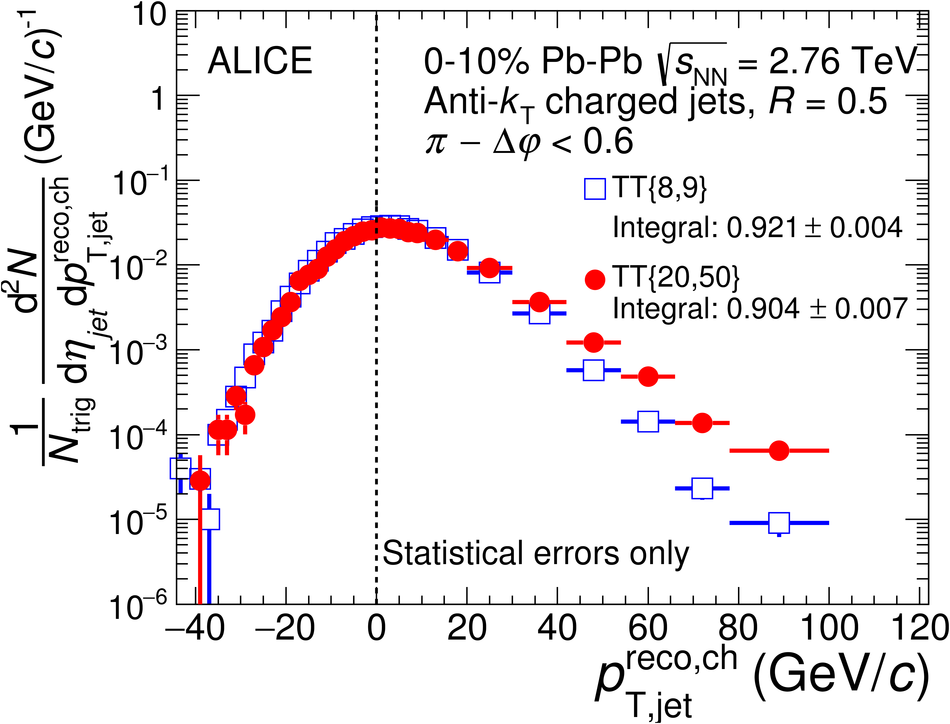

Figure 3
Distribution of raw $\Delta_\mathrm{recoil}$ for ${R}$ = 0.2, 0.4, and 0.5, measured in central Pb-Pb collisions for Signal TT class {20,50} and Reference TT class {8,9}. First three pannels (from top): $p_\mathrm{T,jet}^\mathrm{reco,ch}$ range of fit to extract $c_\mathrm{Ref}$, with linear vertical scale. Last three pannels (from top): $p_\mathrm{T,jet}^\mathrm{reco,ch}$ range above fit region, with logarithmic vertical scale. Error bars show statistical errors only.
| 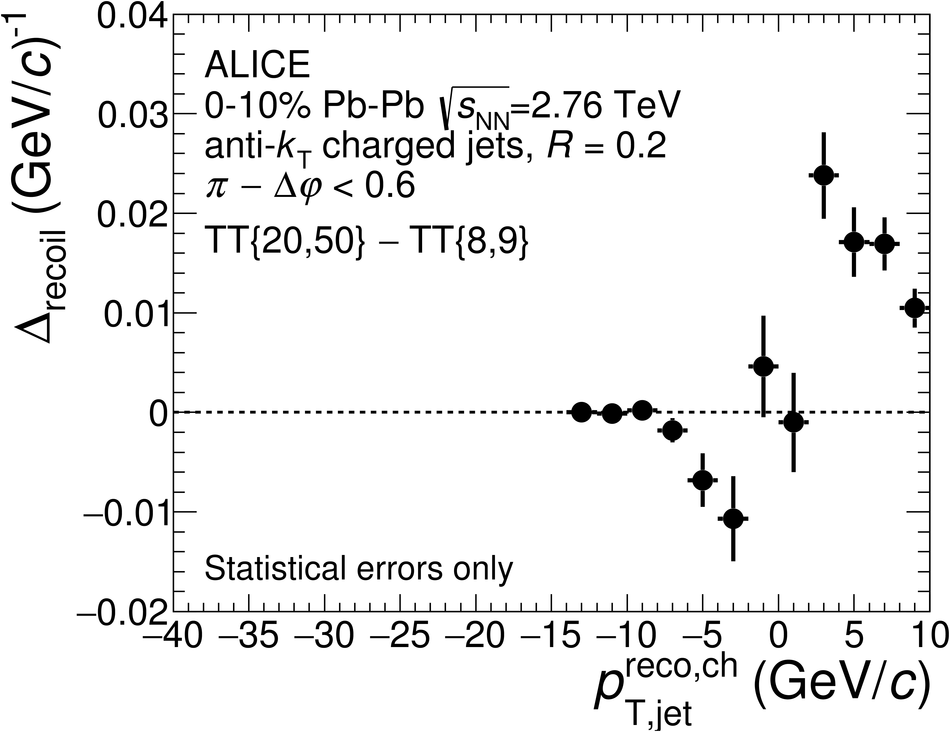 |
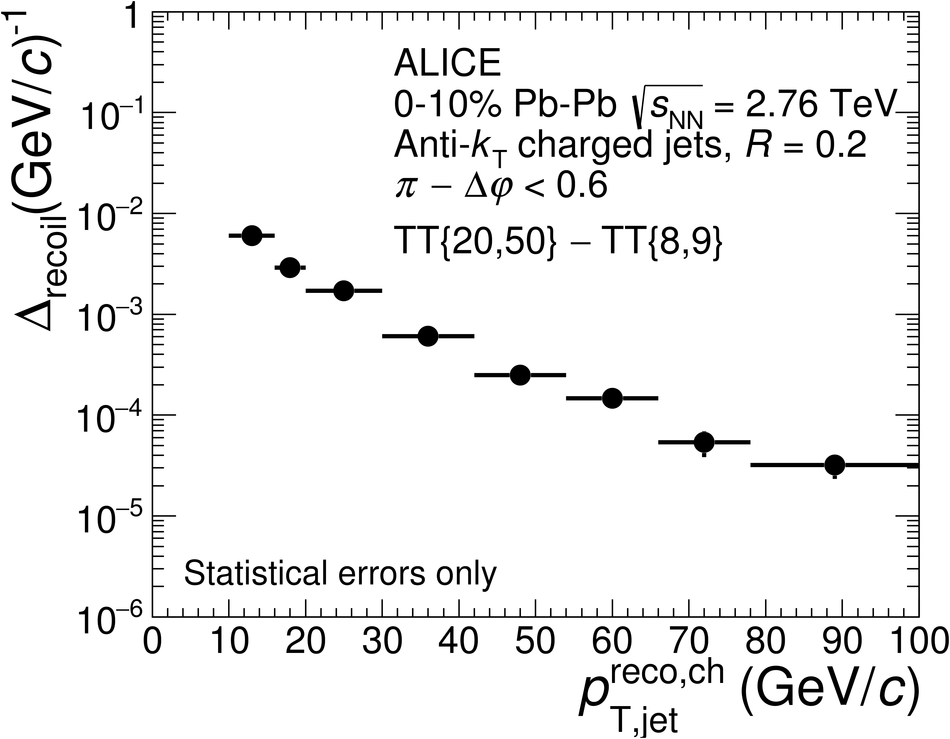
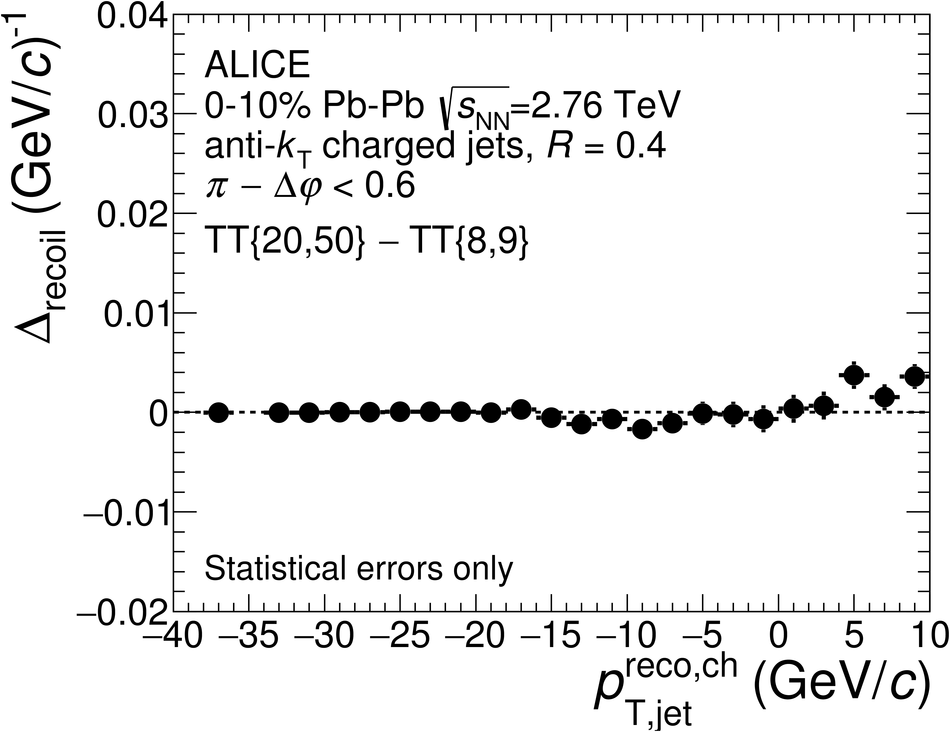
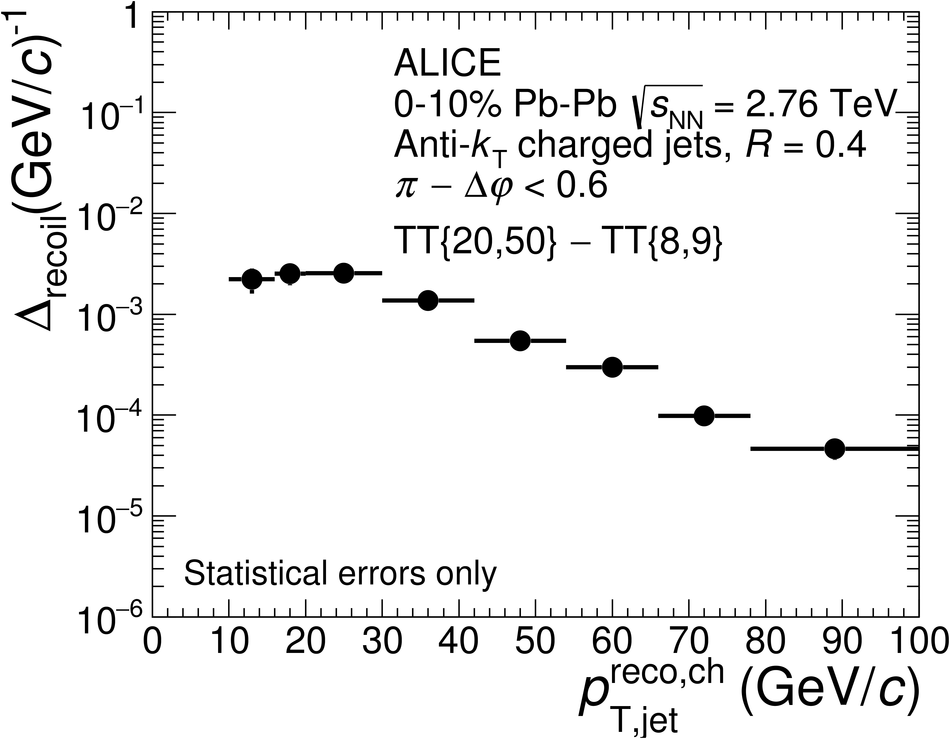
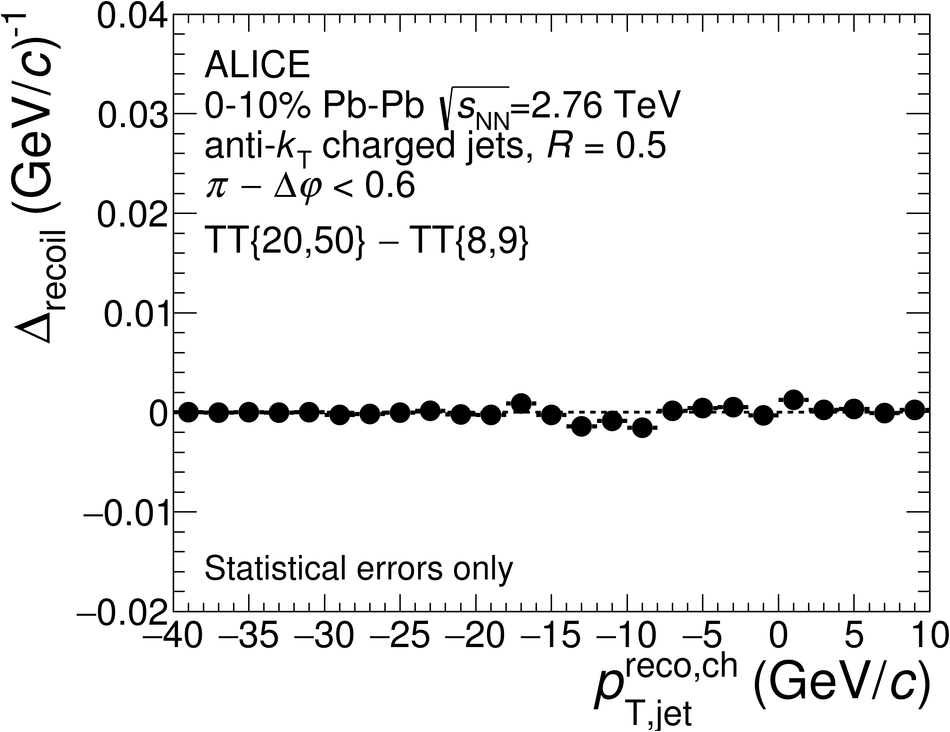

Figure 4
$\Phi(\dphi)$ (top) and $\Sigma\left(\Delta\varphi_{\mathrm{thresh}}\right)$ (bottom) distributions in central Pb-Pb collisions for TT{20,50} (open red circles), TT{8,9} (open blue boxes), and TT{20,50}-TT{8,9} (filled black circles), for jets with $40< p_\mathrm{T,jet}^\mathrm{reco,ch}< 60 \mathrm{GeV/}c$. All error bars are statistical only. The vertical dashed line in the top panel indicates the acceptance limit for the $\Delta_\mathrm{recoil}$ measurement. Points in the bottom panel are displaced horizontally for clarity. | 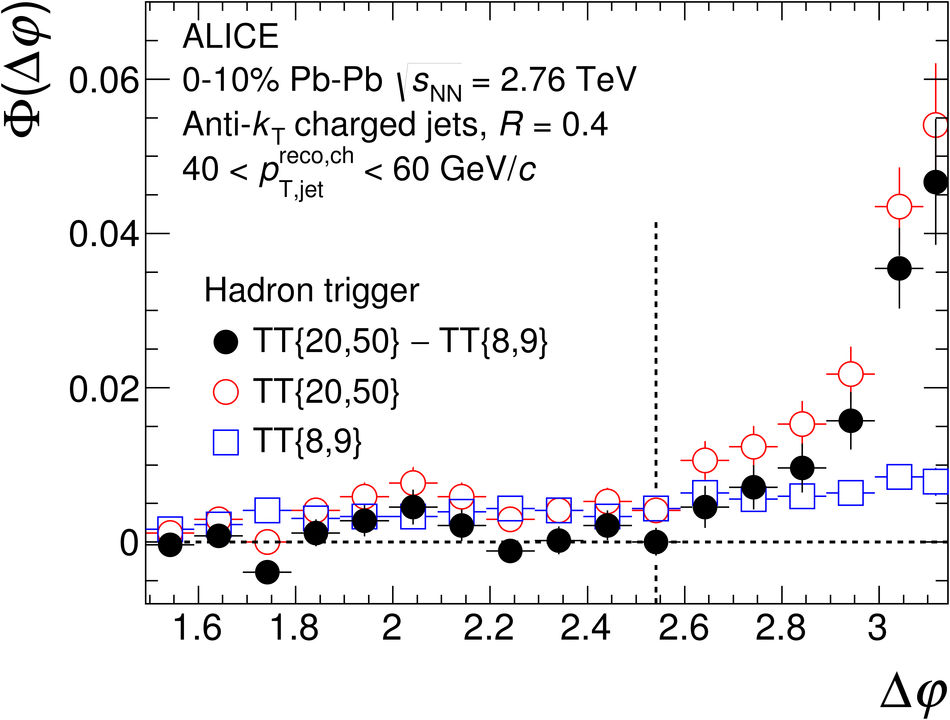 |
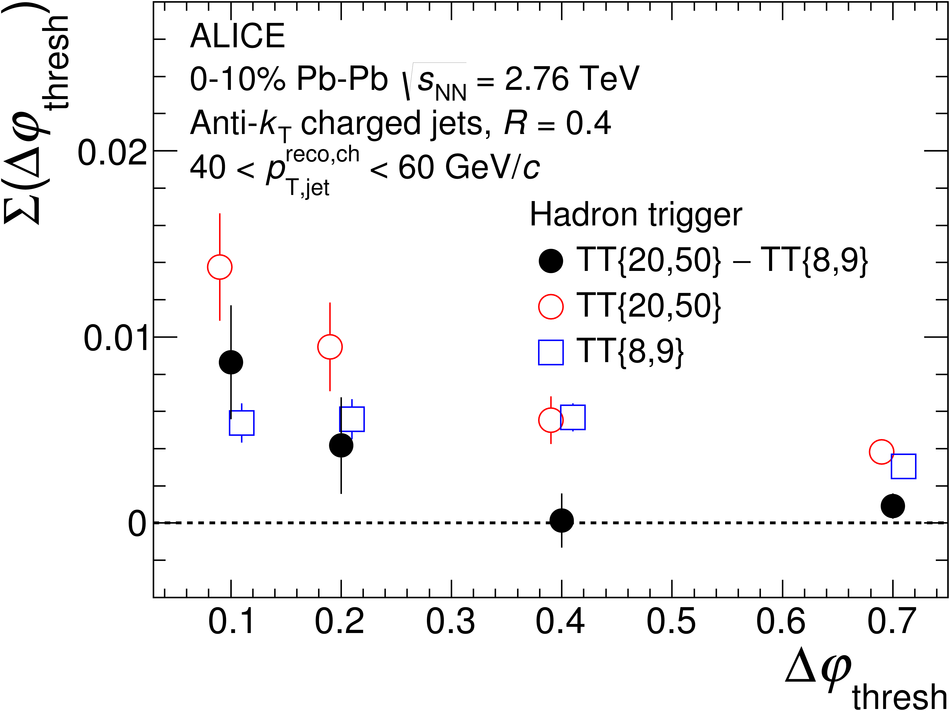
Figure 5
Ratio of $\Delta_\mathrm{recoil}$ distributions for pp collisions at $\sqrt{s}$ = 2.76 TeV, for ${R}$ = 0.2 (top) and ${R}$ = 0.5 (bottom). The numerator is convoluted with $R_{\mathrm{det}}$ and $\delta{\pT}$ separately, and with $R_{\mathrm{tot}}$. The denominator is the unsmeared distribution.
| 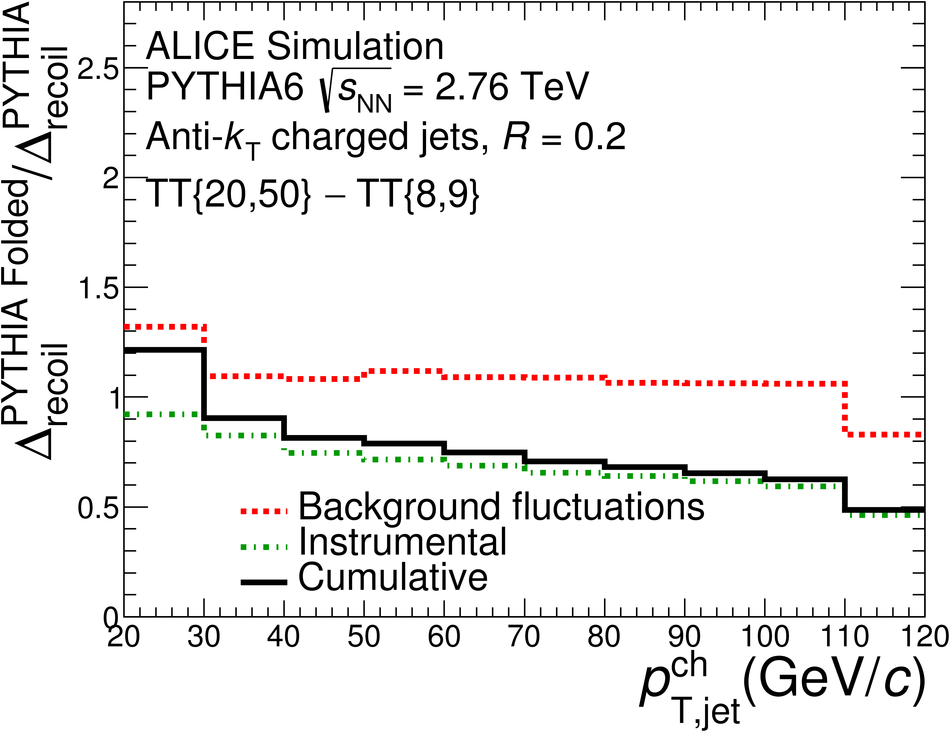 |
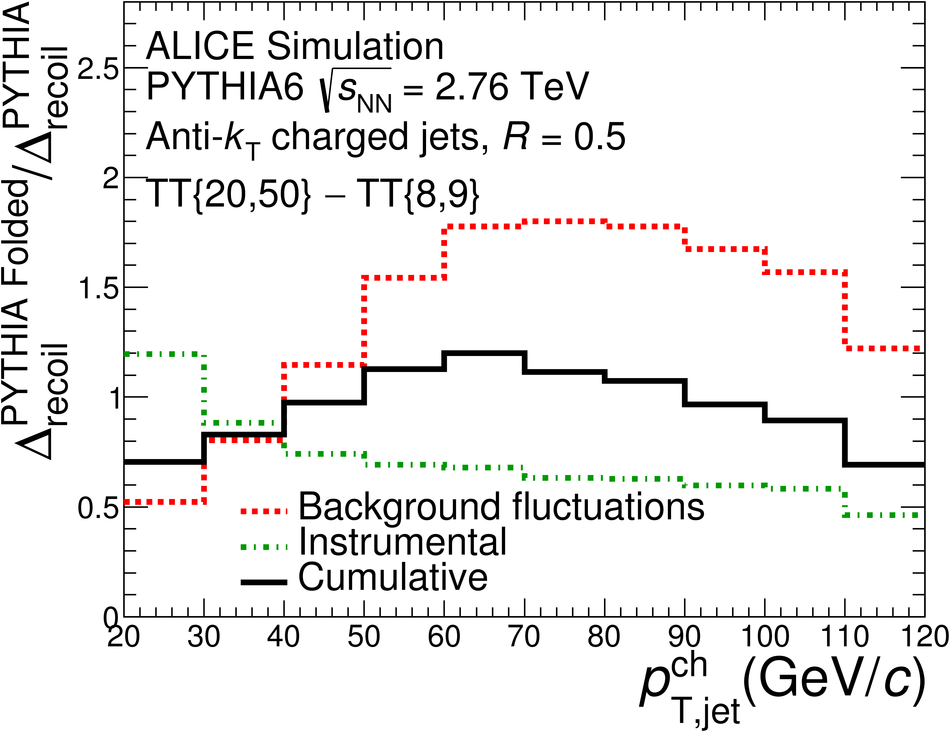
Figure 6
$\Delta_\mathrm{recoil}$ distributions for ${R}$ = 0.5, for ALICE data and calculations of pp collisions $\sqrt{s}$ = 7 TeV. ALICE data, which are the same in both panels, are compared with calculations based on PYTHIA (top) and NLO pQCD (bottom). The green boxes in the bottom panel show the systematic uncertainty of the NLO calculation. The lower panels show the ratios of data and calculations to a smooth function fit to the data.
| 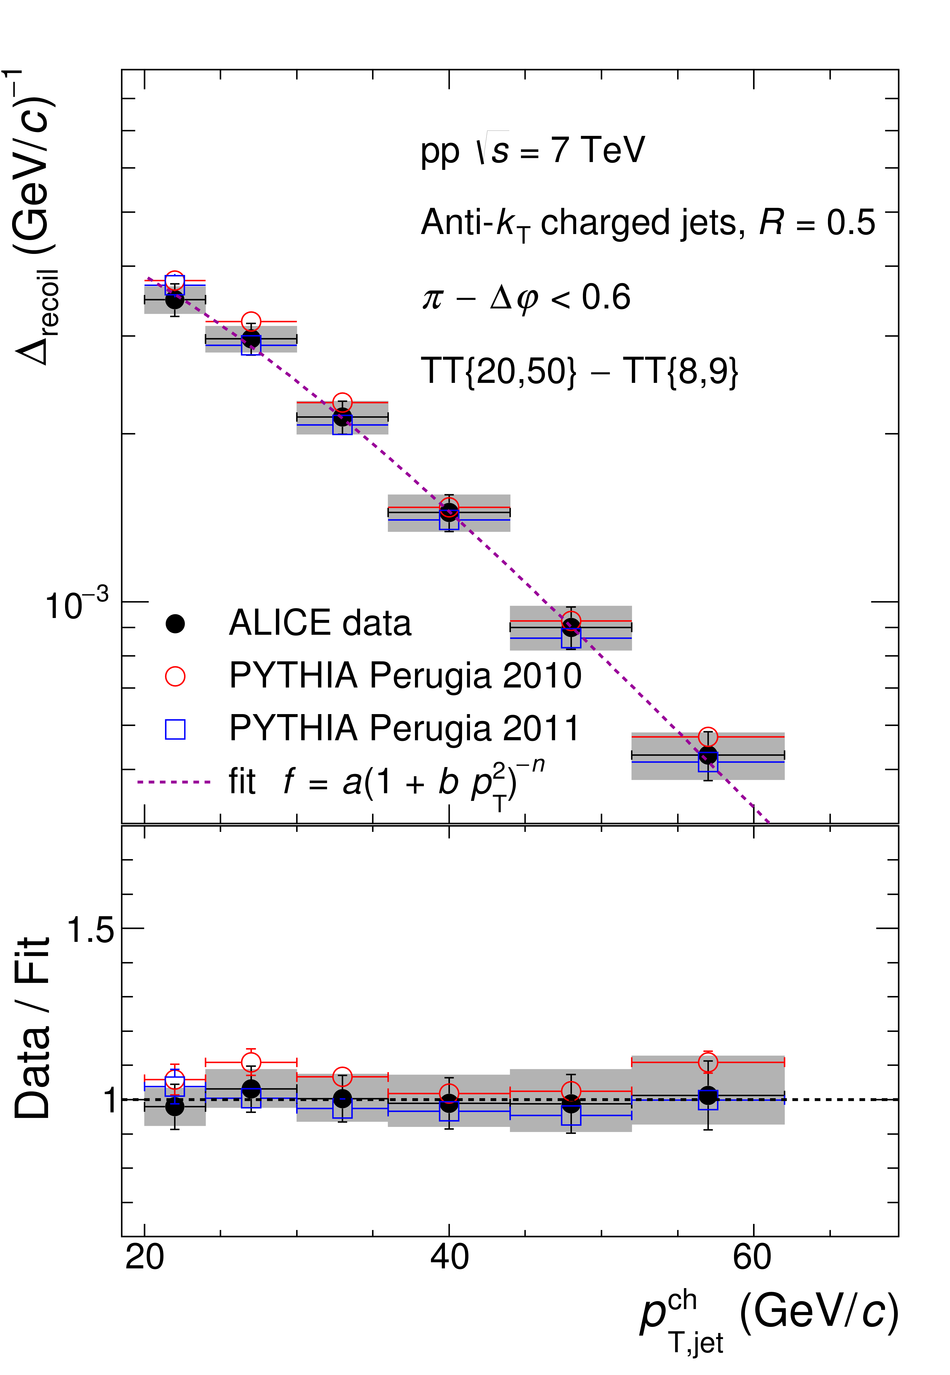 |
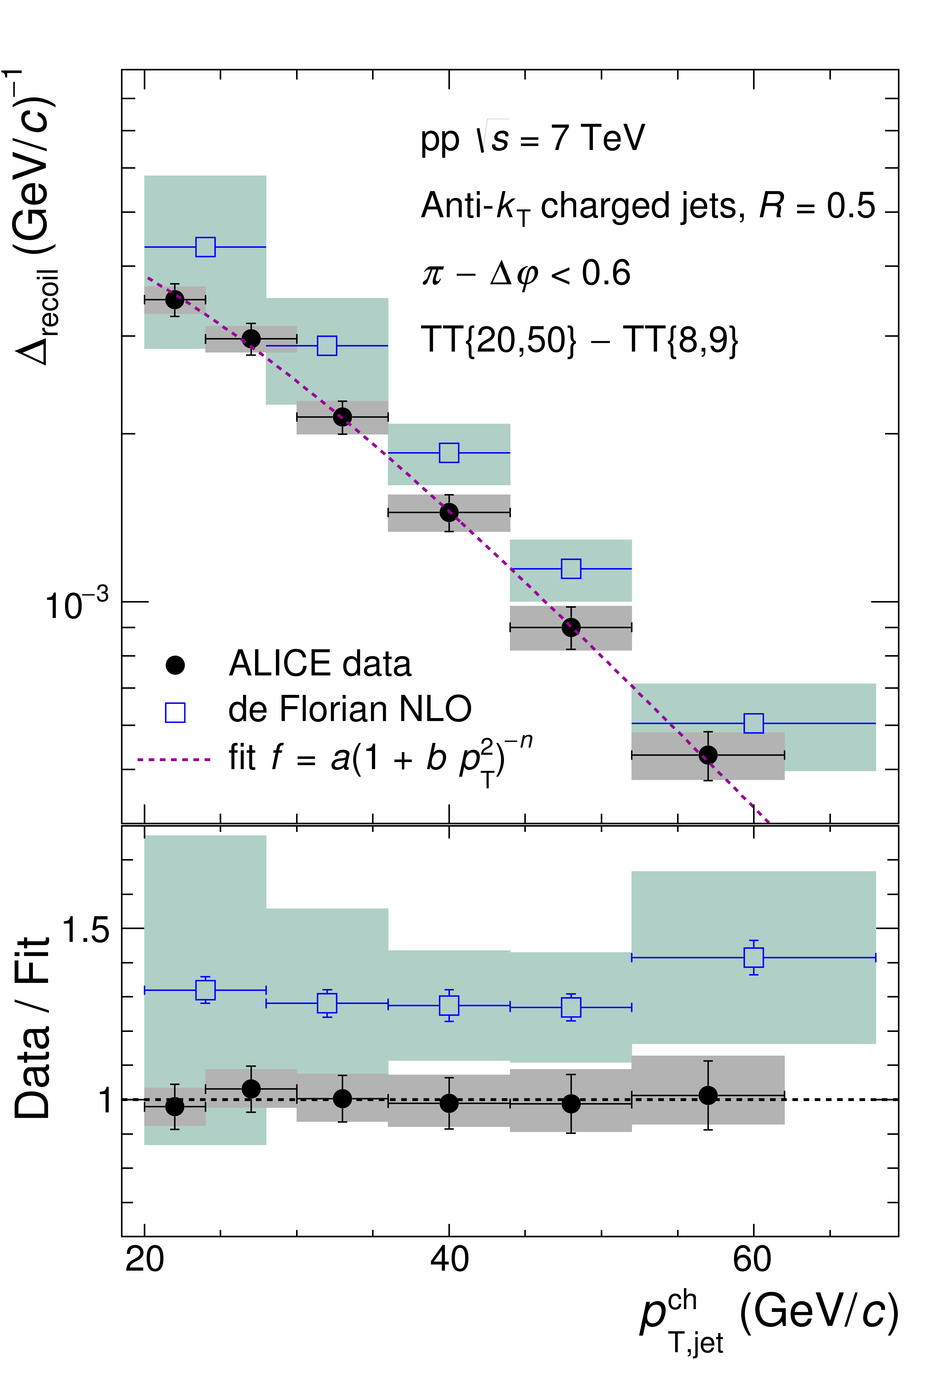

Figure 8
$\Delta_\mathrm{recoil}$ for 0-10% central Pb-Pb collisions at $\sqrt{s_{\mathrm {NN}}}$ = 2.76 TeV for anti-$k_\mathrm{T}$ jets with ${R}$ = 0.2, 0.4 and 0.5. The vertical error bars are the square root of the diagonal elements of the unfolding covariance matrix, with the boxes indicating correlated and uncorrelated (shape) systematic uncertainties.
| 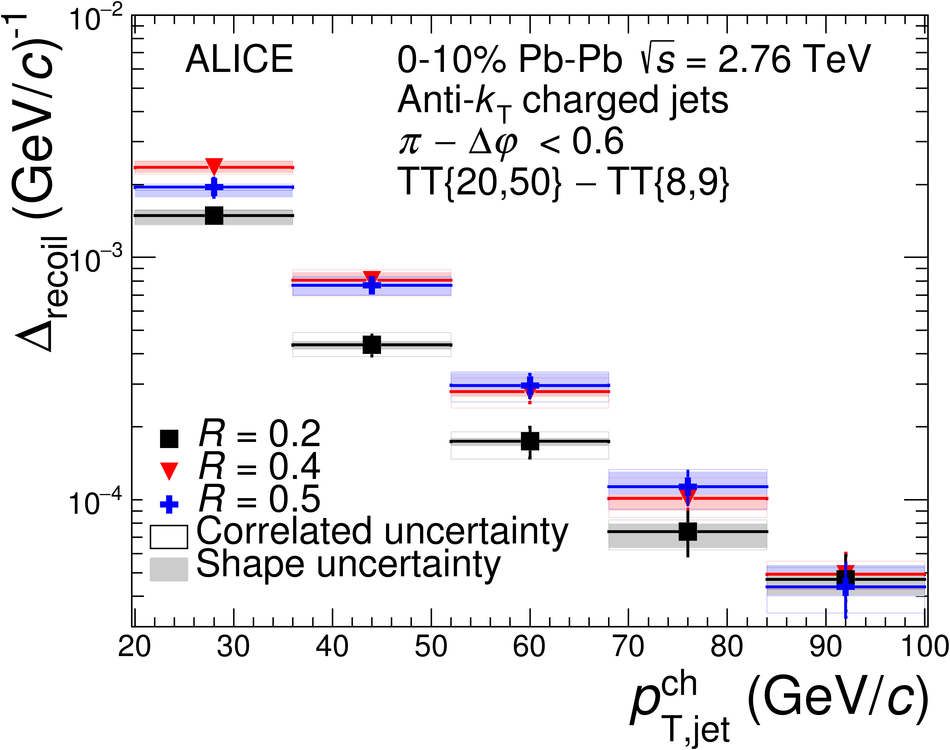 |

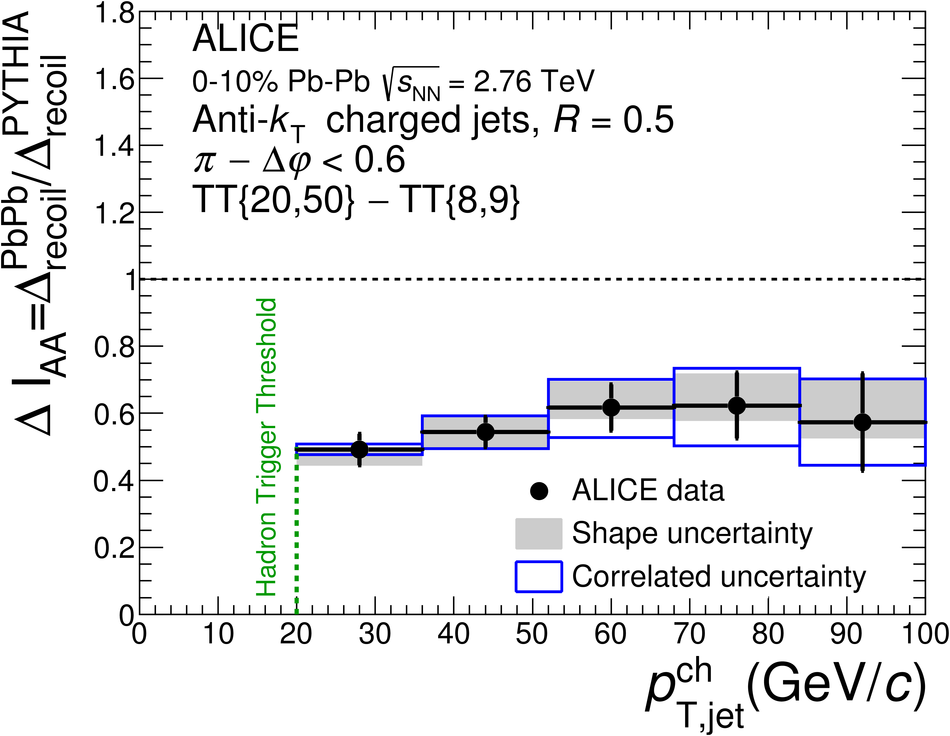
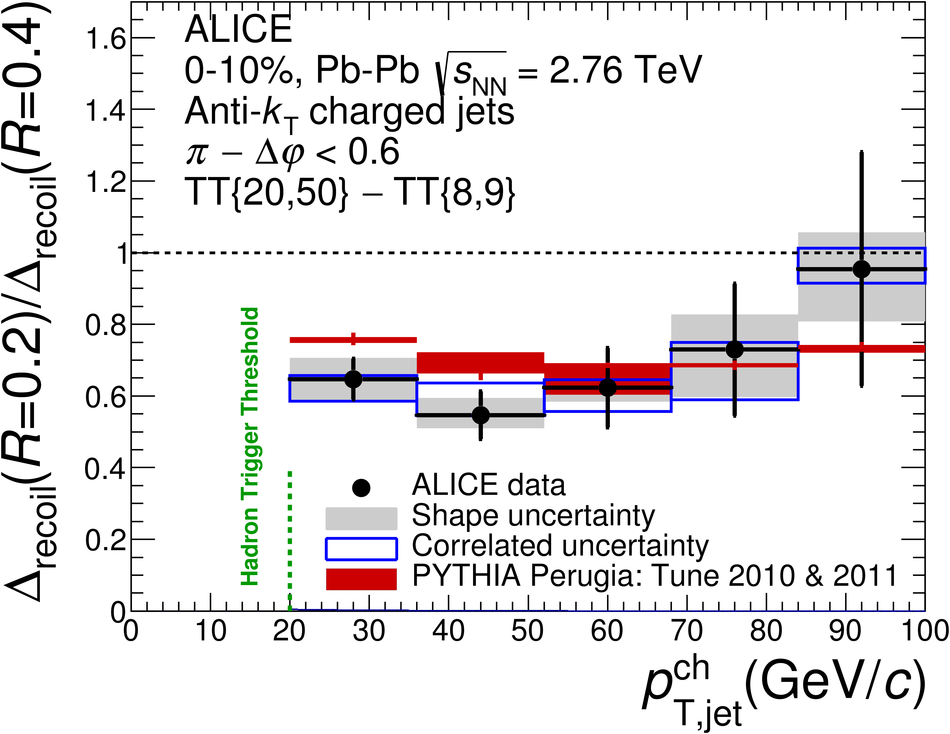
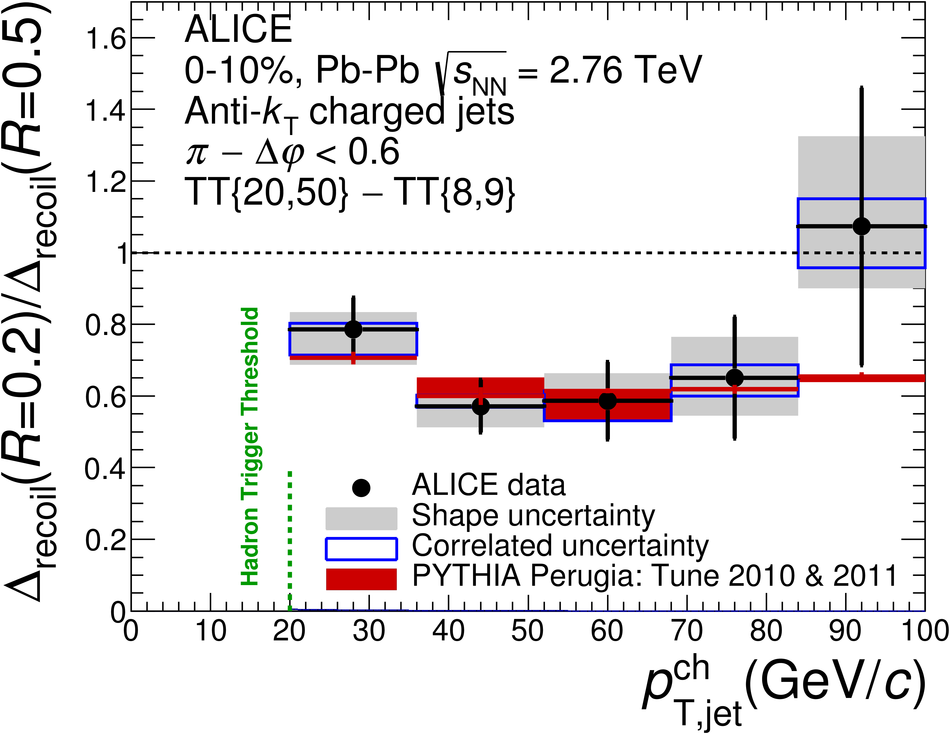
Figure 11
$\Phi(\dphi)$ distributions for 0-10% central Pb-Pb data (black circles) and pp collisions simulated by detector-level PYTHIA events embedded into central Pb-Pb events (red squares), at $\sqrt{s_{\mathrm {NN}}}$ = 2.76 TeV. Jets have $40< p_\mathrm{T,jet}^\mathrm{reco,ch} < 60$, with $p_\mathrm{T,jet}^\mathrm{reco,ch}$ not corrected for background fluctuations and instrumental effects. The lines show the result of fitting Eq.8 to the distributions, with the value of $\sigma$ from the fit as indicated. The error bars show statistical errors only. The Pb-Pb data points are the same as the solid circles shown in the top panel of Fig.4.
| 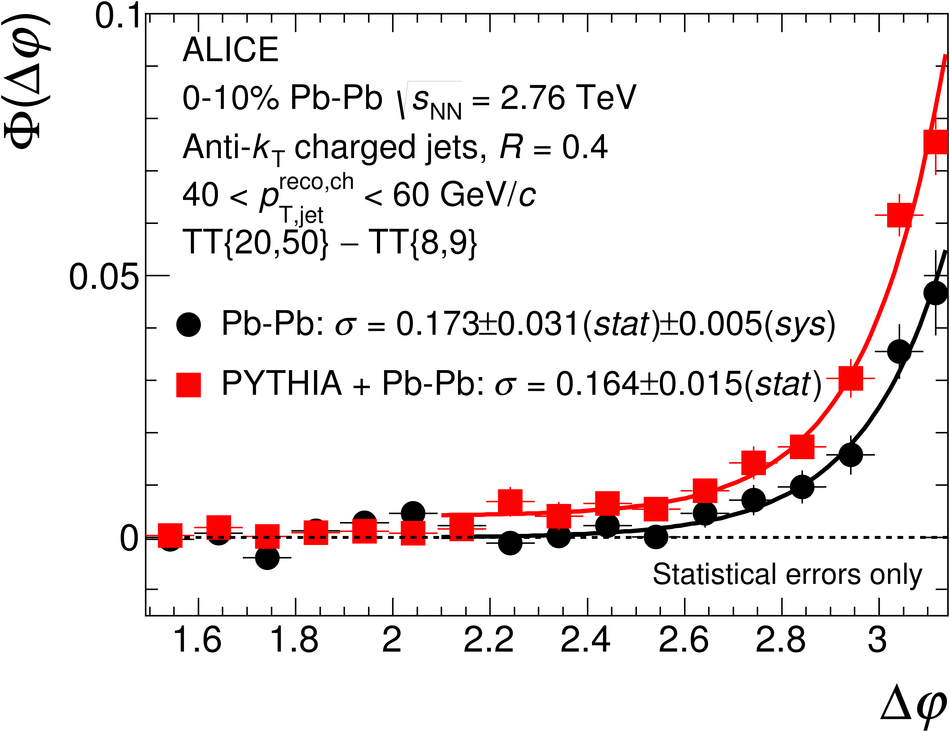 |
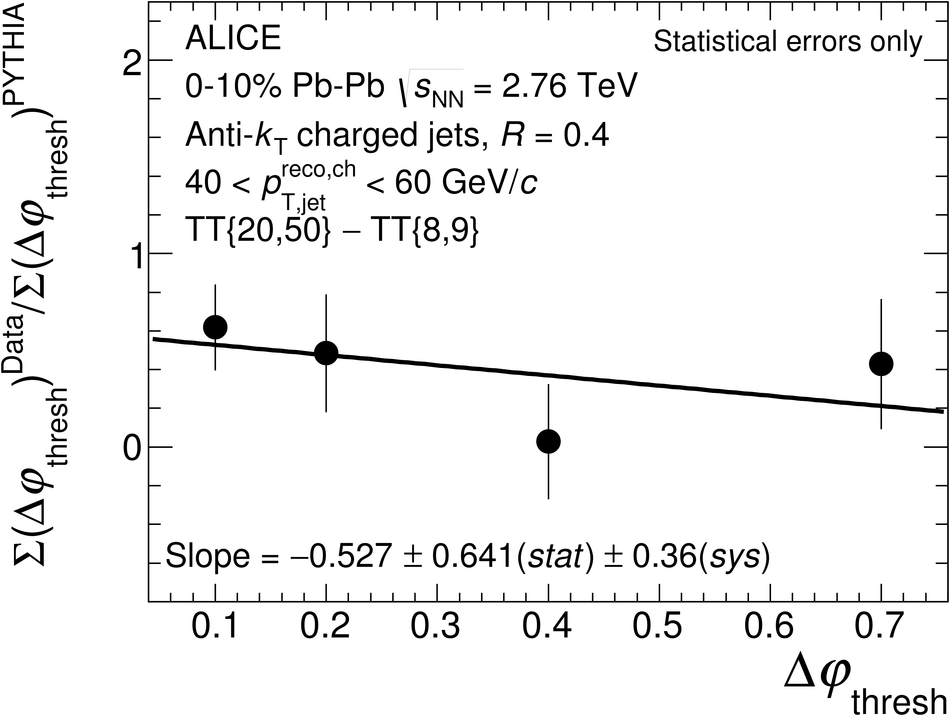
Figure 12
Top: $\Sigma\left(\Delta\varphi_{\mathrm{thresh}}\right)$ distributions for central Pb-Pb data (black circles) and the pp reference distribution (red squares), obtained by embedding detector-level PYTHIA events into real data. bottom: ratio of the $\Sigma\left(\Delta\varphi_{\mathrm{thresh}}\right)$ distribution between Pb-Pb data and the PYTHIA reference shown in the top along with a first-order polynomial fit. The error bars in both panels show statistical errors only.
|  |