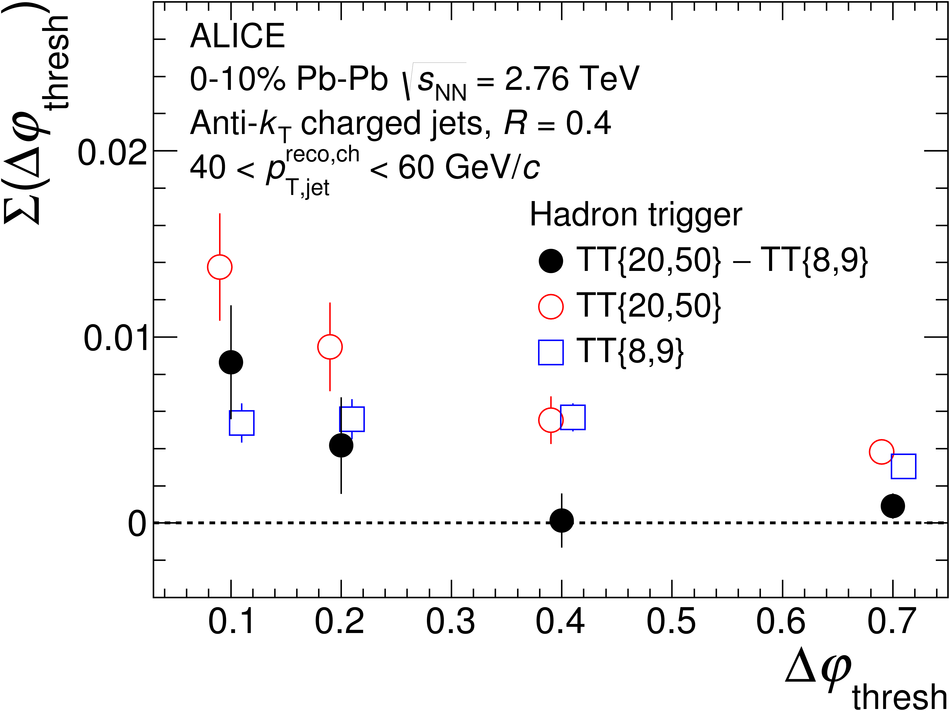
$\Phi(\dphi)$ (top) and $\Sigma\left(\Delta\varphi_{\mathrm{thresh}}\right)$ (bottom) distributions in central Pb-Pb collisions for TT{20,50} (open red circles), TT{8,9} (open blue boxes), and TT{20,50}-TT{8,9} (filled black circles), for jets with $40< p_\mathrm{T,jet}^\mathrm{reco,ch}< 60 \mathrm{GeV/}c$. All error bars are statistical only. The vertical dashed line in the top panel indicates the acceptance limit for the $\Delta_\mathrm{recoil}$ measurement. Points in the bottom panel are displaced horizontally for clarity. | 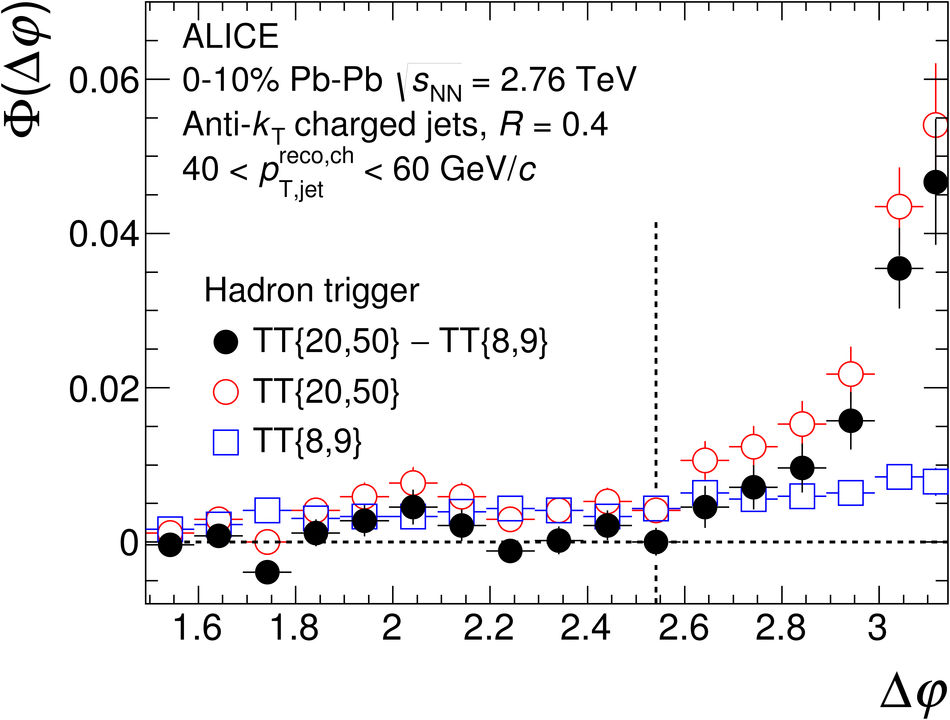 |