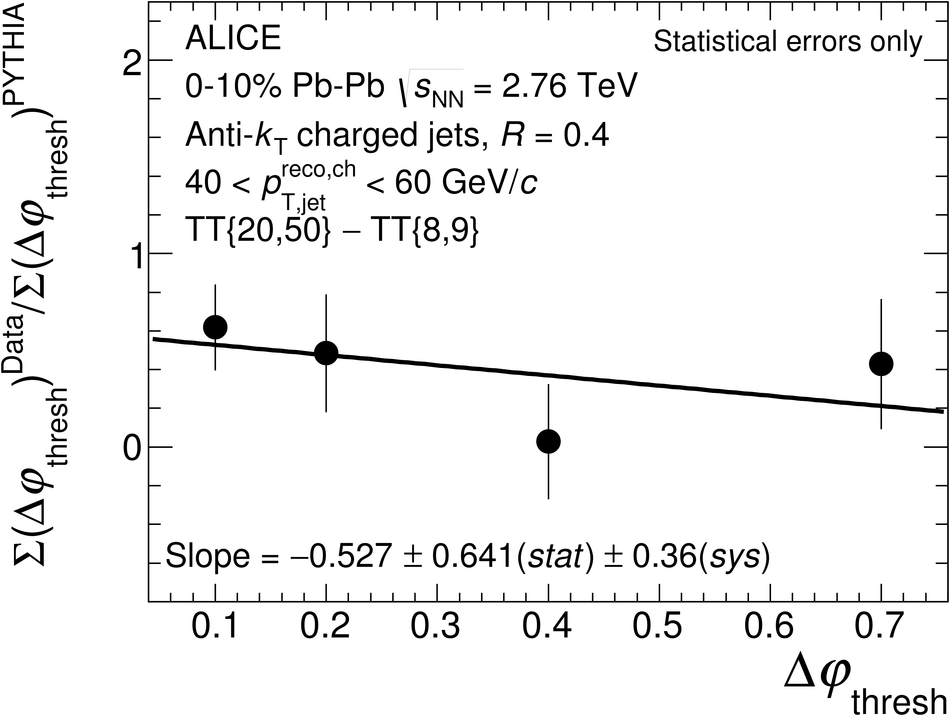
Top: $\Sigma\left(\Delta\varphi_{\mathrm{thresh}}\right)$ distributions for central Pb-Pb data (black circles) and the pp reference distribution (red squares), obtained by embedding detector-level PYTHIA events into real data. bottom: ratio of the $\Sigma\left(\Delta\varphi_{\mathrm{thresh}}\right)$ distribution between Pb-Pb data and the PYTHIA reference shown in the top along with a first-order polynomial fit. The error bars in both panels show statistical errors only.
|  |