
Scattering experiments have long been the gold standard for constraining hadron$-$hadron interactions, providing direct information on the angular momentum and spin dependence over a wide range of kinematic configurations. However, experimental constraints on three-body dynamics remain limited, specifically for unbound systems and systems involving short-lived hadrons. In this work, the three-proton correlation function is measured in pp collisions at $\sqrt{s}=13.6$ TeV with ALICE at the LHC and presented as a novel approach to access hadronic interactions in three-body systems. A new analysis strategy is employed to isolate the p$-$p$-$p contribution to the correlation function by correcting for background channels and experimental effects, and enabling a direct comparison with state-of-the-art three-body continuum calculations. The extracted correlation function provides the first direct access to the isospin $3/2$ three-body system. The measured observable is found to be sensitive to the partial-wave structure of the nucleon$-$nucleon interaction and indicates that the nuclear interaction acts even at high angular momentum and parity states of the three-body system, revealing an effective long-range attractive component, observed experimentally for the first time in a three-proton continuum system. Hence, three-hadron femtoscopy emerges as an effective 3$\rightarrow$3 scattering experiment with three unbound hadrons in initial and final states. The copious production of hyperons at the modern high-energy colliders ensures the possibility of extending such measurements beyond nucleons, opening a new avenue for future precision studies of three-body dynamics in the strangeness sector.
Submitted to: OTHERS
e-Print: arXiv:2608.05708 | PDF | inSPIRE
CERN-EP-2026-237
Figure group
Figure 1
The p--p correlation function for proton pairs within p--p--p triplets measured in pp collisions at $\sqrt{s} = 13.6$ TeV is presented in black markers. The vertical lines represent the statistical uncertainty, while the shaded boxes correspond to the systematic uncertainty. The correlation function is normalized to unity in the range $k^* \in [150,200]$ MeV/$c$. The red band corresponds to the correlation function fit as described in the text. The gray band shows the baseline obtained from the fit, while the dashed gray line indicates unity. | 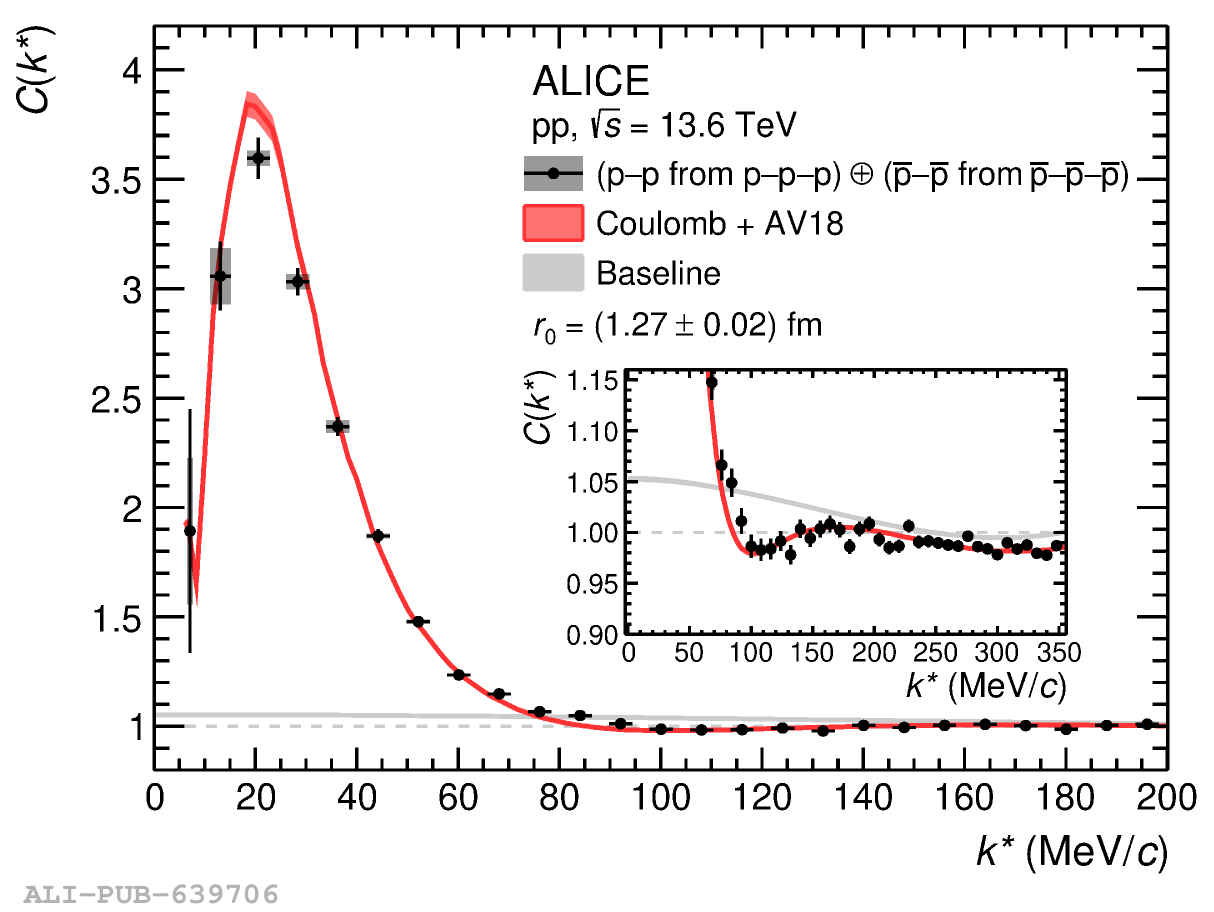 |
Figure 2
The p--p--p correlation function measured in pp collisions at $\sqrt{s} = 13.6$ TeV, normalized to unity in the range $Q_3 \in [1.0,1.2]$ GeV/$c$. The vertical bars indicate the statistical uncertainties, while the shaded boxes represent the systematic ones. The magenta band represents the genuine p--p--p contribution, and the other colored bands correspond to the different components used in the modeling of the correlation function (see text for details). The red band is the result of the fit. The non-femtoscopic baseline is shown in light gray. The bottom panel reports the number of standard deviations ($n_\sigma$) between the data and the full model in each bin, obtained by combining the corresponding statistical and systematic uncertainties. The inset shows the comparison between the non-femtoscopic baseline obtained from the fit of the p--p--p correlation function (light gray band) and the corresponding result inferred from the two-body p--p measurement (darker green band). | 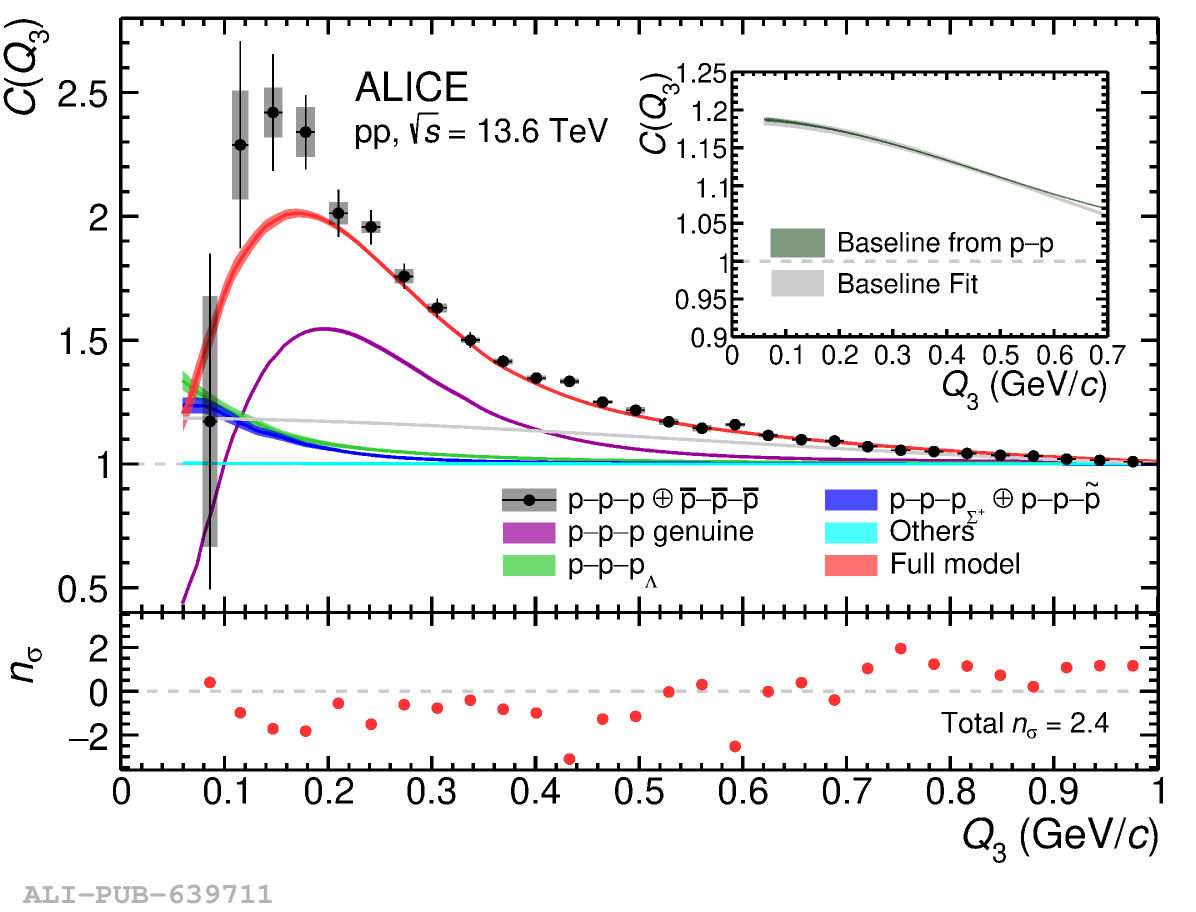 |
Figure 3
Possible configurations of protons in two- and three-body systems shown for correspondence to their quantum numbers, the angular momentum, $l$, for the two-body system and the grand-angular momentum, $K$, for the three-body system. The $K=0$ configuration is forbidden for three protons due to antisymmetrization arguments. The green color here encodes particles in $l=0$, red in $l=1$ and blue in $l=2$ states. | 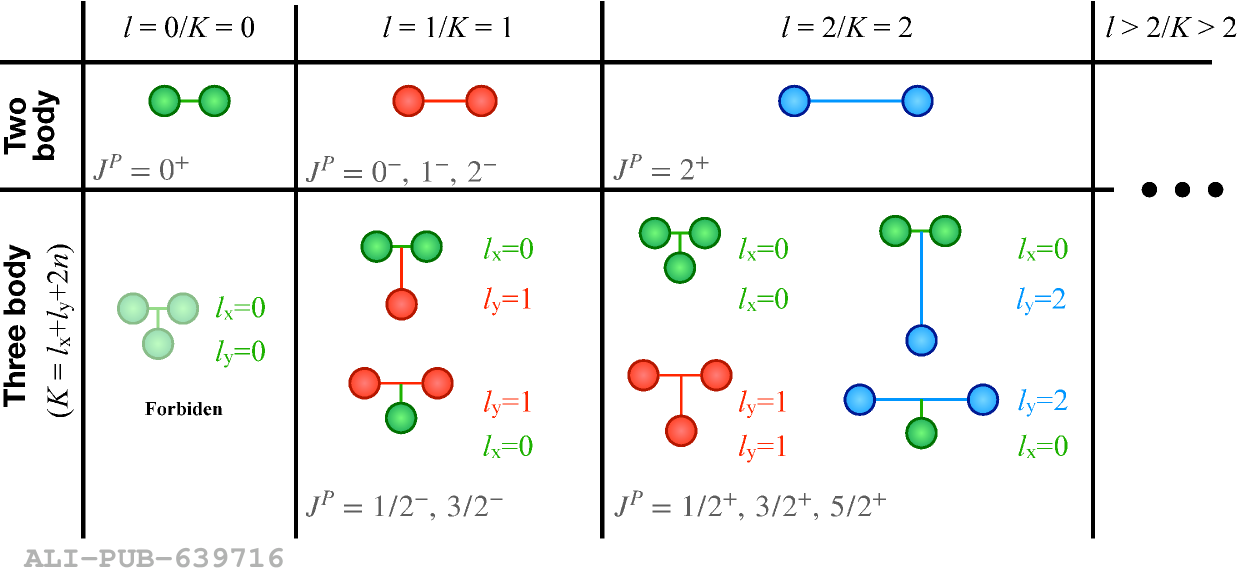 |
Figure 4
Genuine p--p--p correlation function with statistical (bars) and systematic uncertainties(boxes). Left: The magenta and green bands depict the calculations obtained by using the AV18 nuclear potential with and without including the $p$-wave component of the interaction, respectively. Calculations are performed using $K_\mathrm{max}=7$. Right: The different color bands correspond to calculations including the interaction in s-, p-, and d-waves of AV18 potential, and differ by the maximum value of the grand-angular momentum $K$ used to construct the interacting part of the scattering wave function: $K_\mathrm{max}=2$ (blue band), $K_\mathrm{max}=5$ (green band) and $K_\mathrm{max}=7$ (magenta band). The magenta band is identical in both panels. For all bands, the width corresponds to the uncertainty on the source radius. The bottom panel reports the number of standard deviations ($n_\sigma$) between the theory and the data in each bin, evaluated by combining the statistical and systematic uncertainties of the data and the uncertainty of the source radius used in the calculations. The total $n_\sigma$ values refer to the full $Q_3$ range shown in the plots. The first bin is reported as a 1$\sigma$ upper limit, as the corresponding confidence interval extends into the non-physical region (values below zero). | 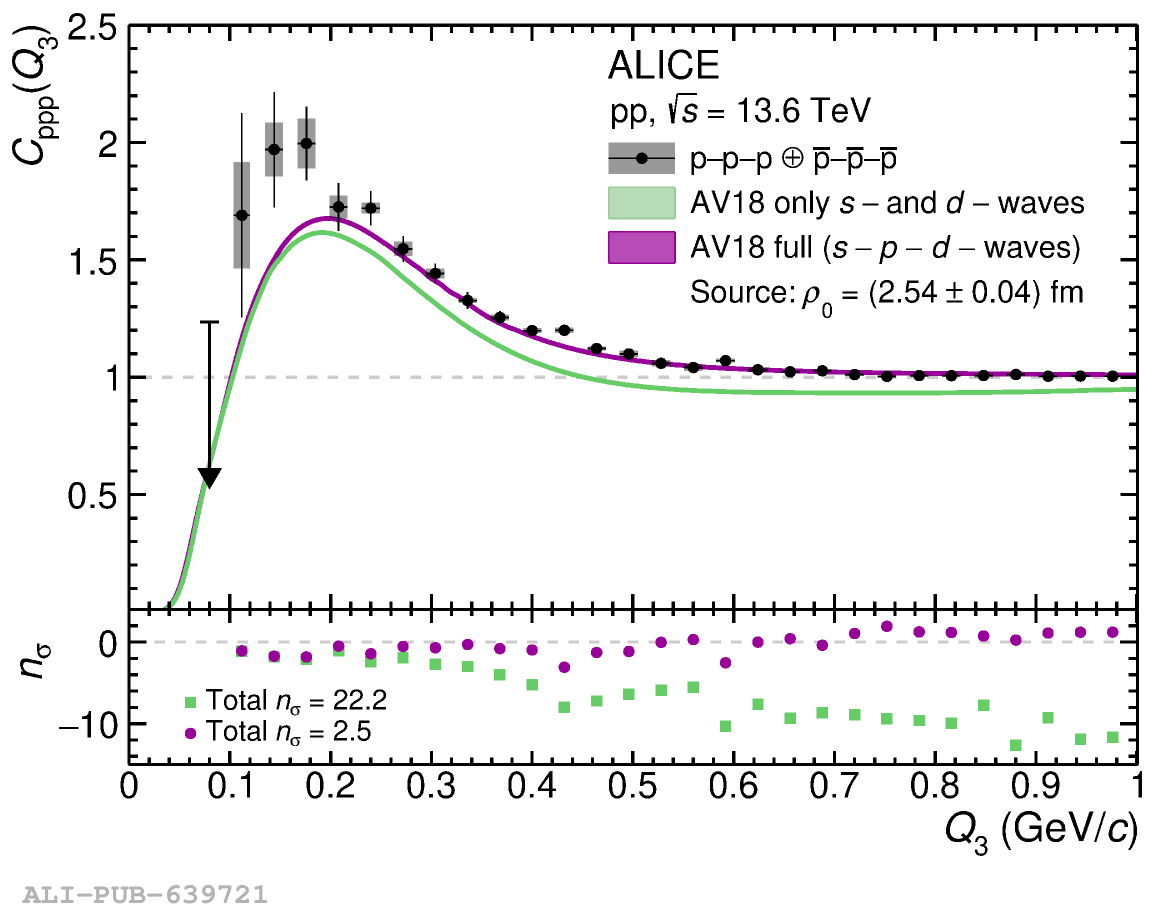 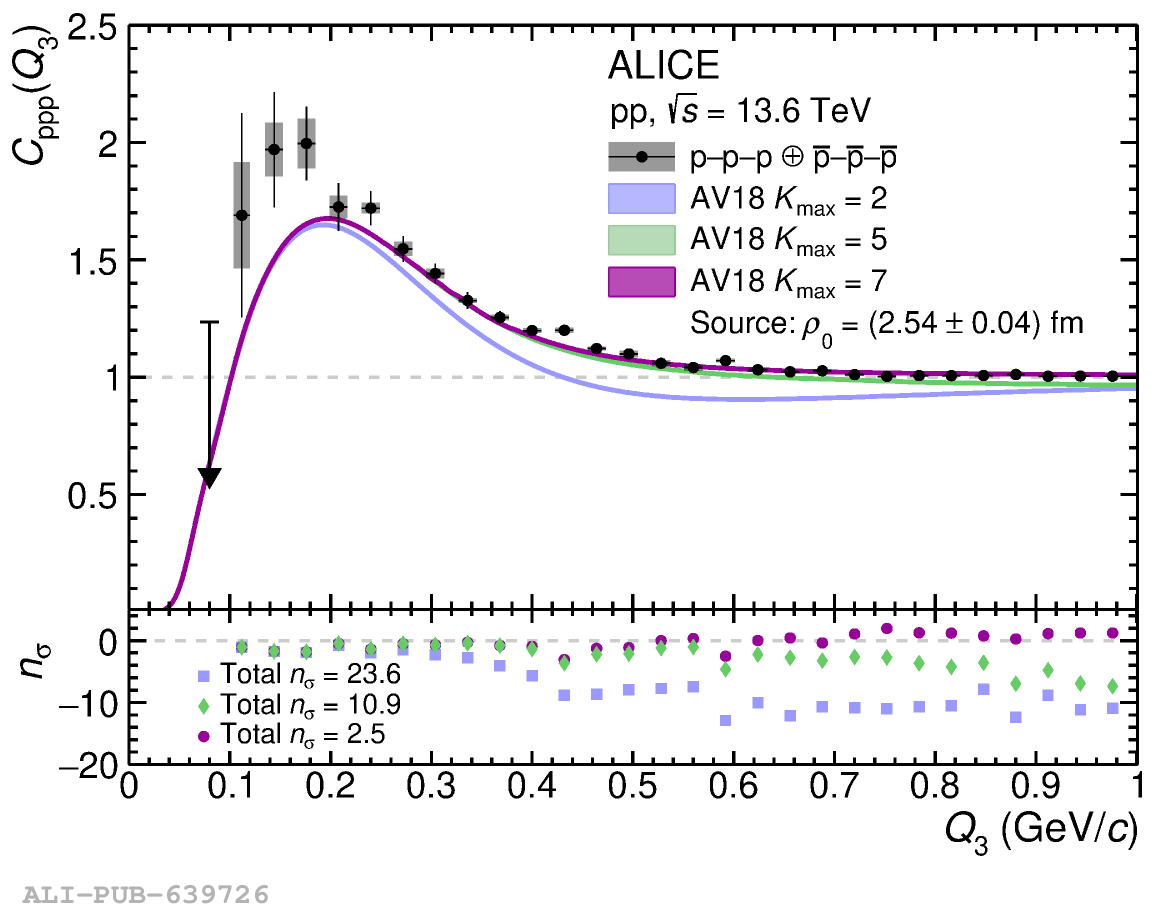 |
Figure A.3
Left: Difference between the effective and free three-body potentials for the $K=1$, $K=3$, and $K=5$ grand-angular momenta in the $1/2^-$, $5/2^-$, and $9/2^-$ three-proton wave functions, respectively. Right: For the same p--p--p states, the function $f(\rho)=(m/\hbar'26\mkern-9muh^2)(V_\mathrm{eff}(\rho)-V_\mathrm{free}(\rho))\rho^3$ is shown which asymptotically goes to the $\zeta$ constant in Eq.A.2. | 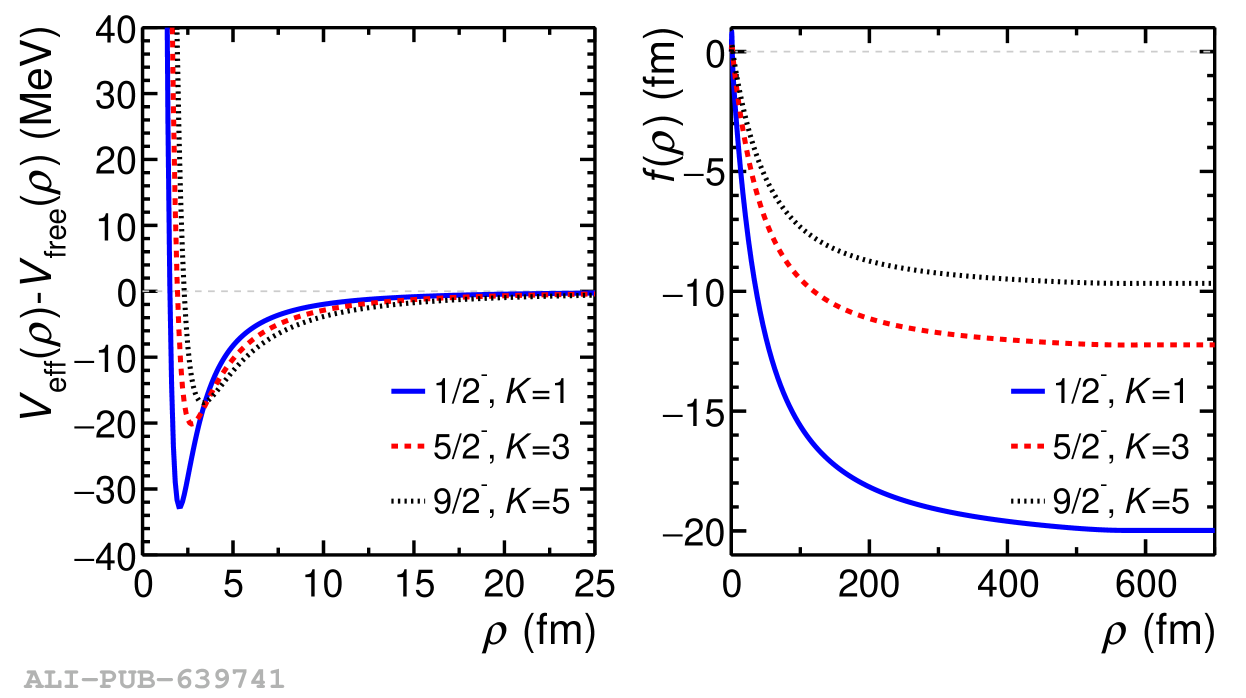 |