
Genuine p--p--p correlation function with statistical (bars) and systematic uncertainties(boxes). Left: The magenta and green bands depict the calculations from Ref. obtained by using the AV18 nuclear potential with and without including the $p$-wave component of the interaction, respectively. Calculations are performed using $K_\mathrm{max}=7$. Right: The different color bands correspond to calculations including the interaction in s-, p-, and d-waves of AV18 potential, and differ by the maximum value of the grand-angular momentum $K$ used to construct the interacting part of the scattering wave function: $K_\mathrm{max}=2$ (blue band), $K_\mathrm{max}=5$ (green band) and $K_\mathrm{max}=7$ (magenta band). The magenta band is identical in both panels. For all bands, the width corresponds to the uncertainty on the source radius. The bottom panel reports the number of standard deviations ($n_\sigma$) between the theory and the data in each bin, evaluated by combining the statistical and systematic uncertainties of the data and the uncertainty of the source radius used in the calculations. The total $n_\sigma$ values refer to the full $Q_3$ range shown in the plots. The first bin is reported as a 1$\sigma$ upper limit, as the corresponding confidence interval extends into the non-physical region (values below zero). | 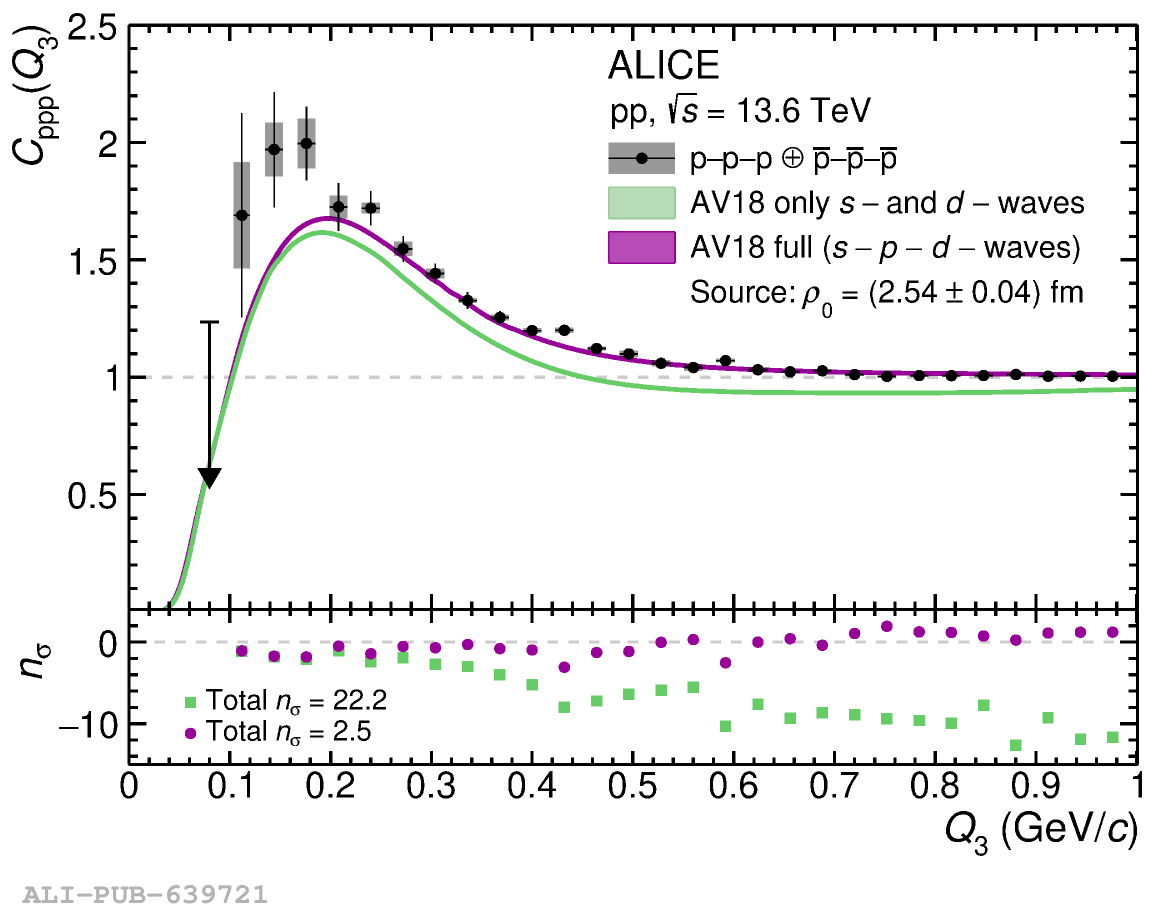 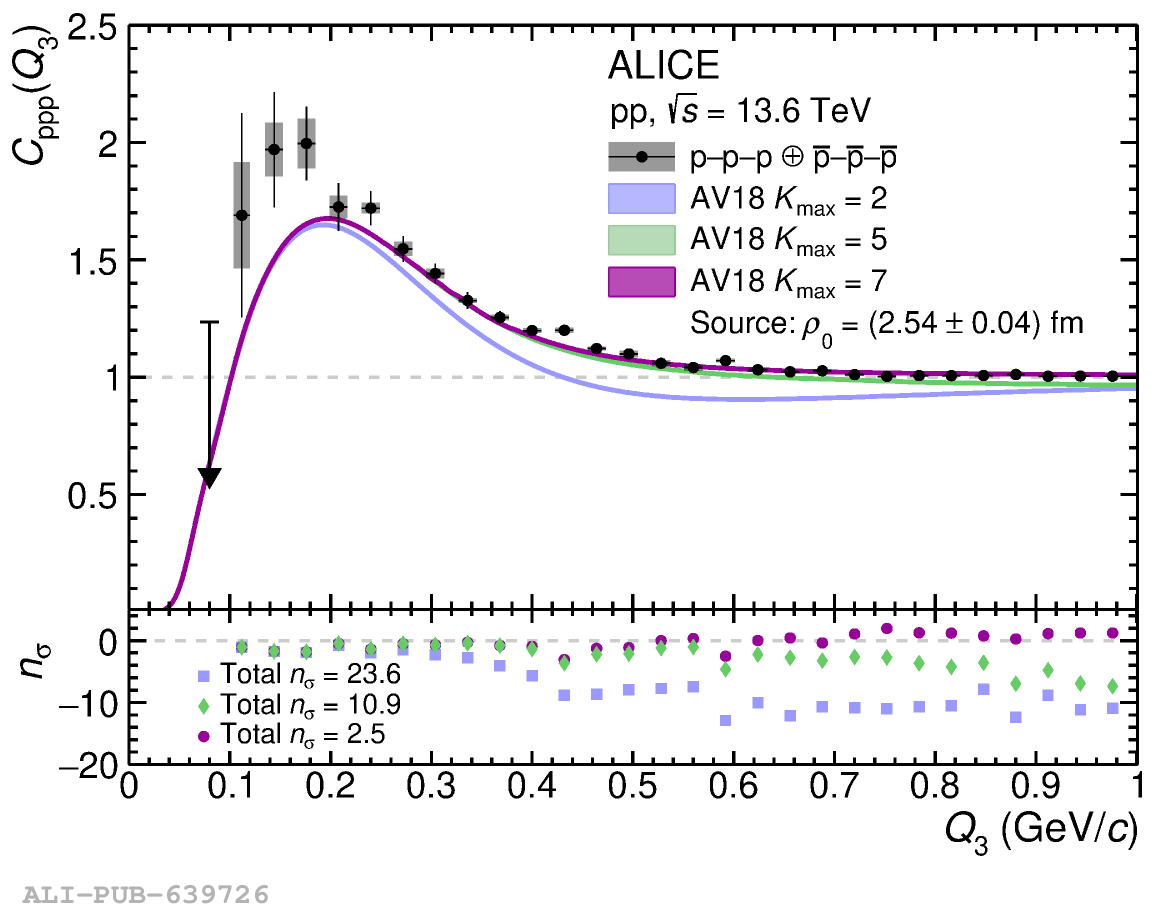 |