
The p--p correlation function for proton pairs within p--p--p triplets measured in pp collisions at $\sqrt{s} = 13.6$ TeV is presented in black markers. The vertical lines represent the statistical uncertainty, while the shaded boxes correspond to the systematic uncertainty. The correlation function is normalized to unity in the range $k^* \in [150,200]$ MeV/$c$. The red band corresponds to the correlation function fit as described in the text. The gray band shows the baseline obtained from the fit, while the dashed gray line indicates unity. | 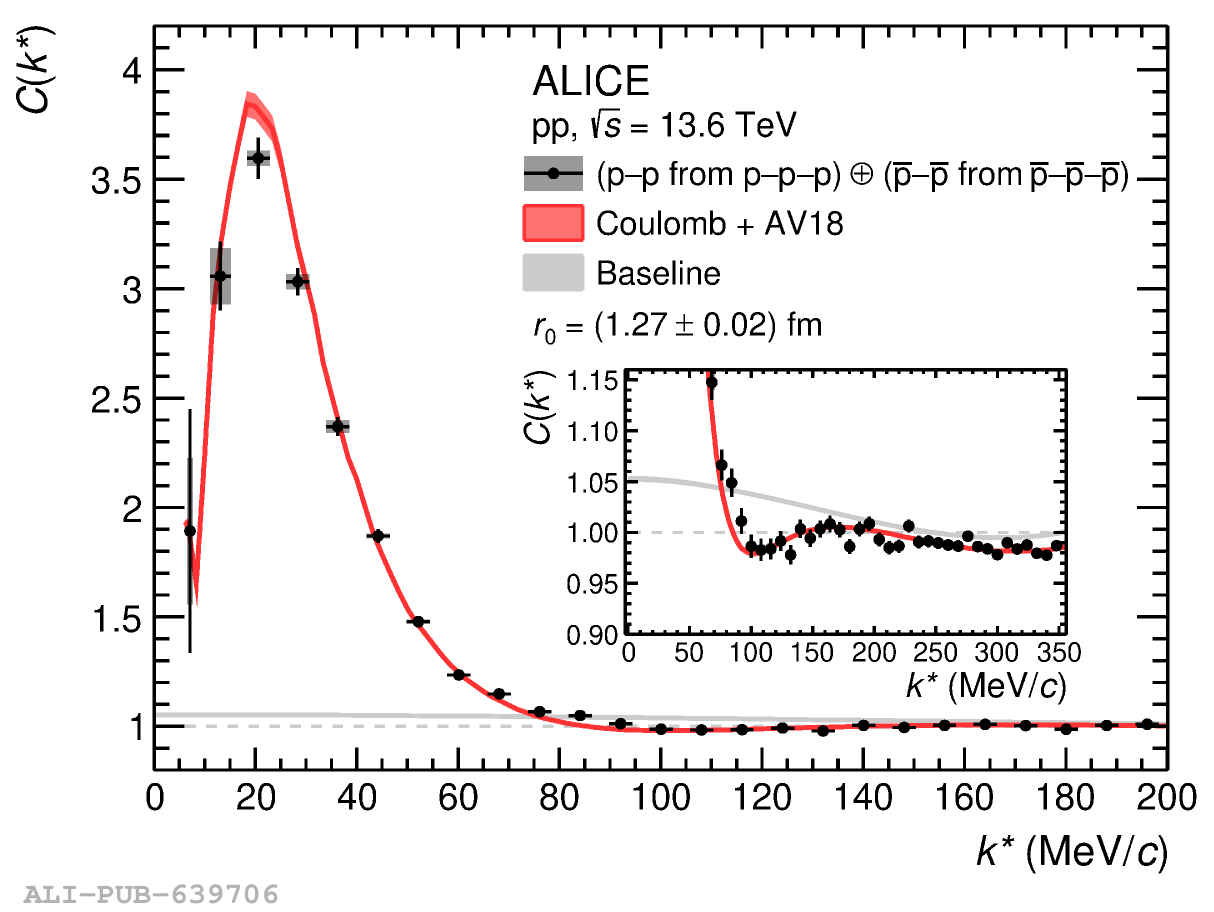 |