Results from a one-dimensional femtoscopic analysis of ${\rm K}^{0}_{\rm S}-{\rm K}^{0}_{\rm S}$ correlations in Pb$-$Pb collisions at the center-of-mass energy $\sqrt{s_{\mathrm{NN}}}~=~5.02$ TeV using data collected by the ALICE experiment at the LHC are presented. The source radius $R$ and correlation strength $λ$ are studied as a function of centrality and pair-transverse momentum ($k_{\rm T}$) to provide insight into the space-time structure and composition of the particle-emitting source. The observed trends of radii as a function of $k_{\rm T}$ and centrality are consistent with the collective expansion of the system. Comparisons with measurements at $\sqrt{s_{\mathrm{NN}}}~=~2.76$ TeV by the ALICE Collaboration show agreement across multiplicities and $k_{\rm T}$. Hydrokinetic model predictions match the most central collision results but deviate in peripheral events, potentially reflecting limitations in the model's description of peripheral collisions. A comparison with recent measurements at the same energy by the CMS Collaboration shows compatibility in both $R$ and $λ$ within 1.3$σ$. These results extend previous ${\rm K}^{0}_{\rm{S}}-{\rm K}^{0}_{\rm{S}}$ femtoscopy to a higher energy, providing a consistent baseline for future comparisons.
Submitted to: PLB
e-Print: arXiv:2605.02321 | PDF | inSPIRE
CERN-EP-2026-117
Figure group
Figure 1
Purity of \kzero candidates as a function of \pt. Black markers represent the selection using the nominal invariant mass range $0.485 M_{\pi\pi} 0.510$ \GeVmass, red markers represent the selection using the loose range $0.480 M_{\pi\pi} 0.515$ \GeVmass, and blue markers represent the selection using the tight range $0.490 M_{\pi\pi} 0.505$ \GeVmass. | 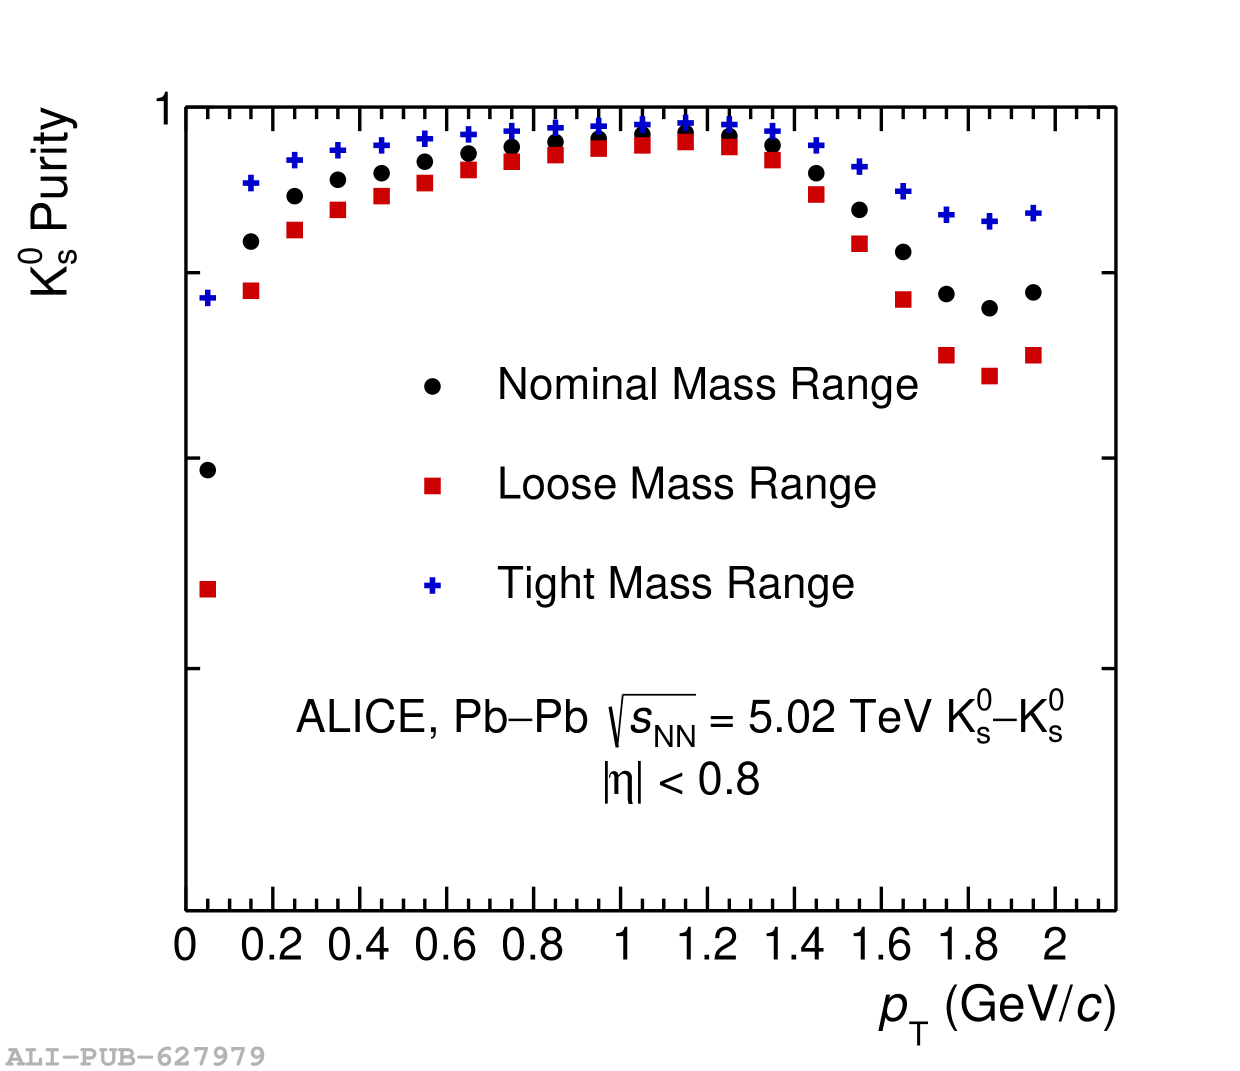 |
Figure 2
Correlation functions with the respective fits in four \kt ranges for \PbPb collisions at \fivenn in the 10-30\% centrality range. Statistical uncertainties are shown as the black bars and systematic uncertainties, described in Sec. \ref{sec:Systematics}, are shown as boxes. The linear baseline contribution is shown in blue and the Lednický-Lyuboshitz model from Eq. \ref{eq:Led} is shown in green. The total fit, shown in red, corresponds to Eq. \ref{eq:Cfit} and is obtained by fitting the product of the baseline and the Lednický-Lyuboshitz model to the data. The shaded band around the fit represents the 95\% confidence interval, reflecting statistical uncertainty on the fit parameters. | 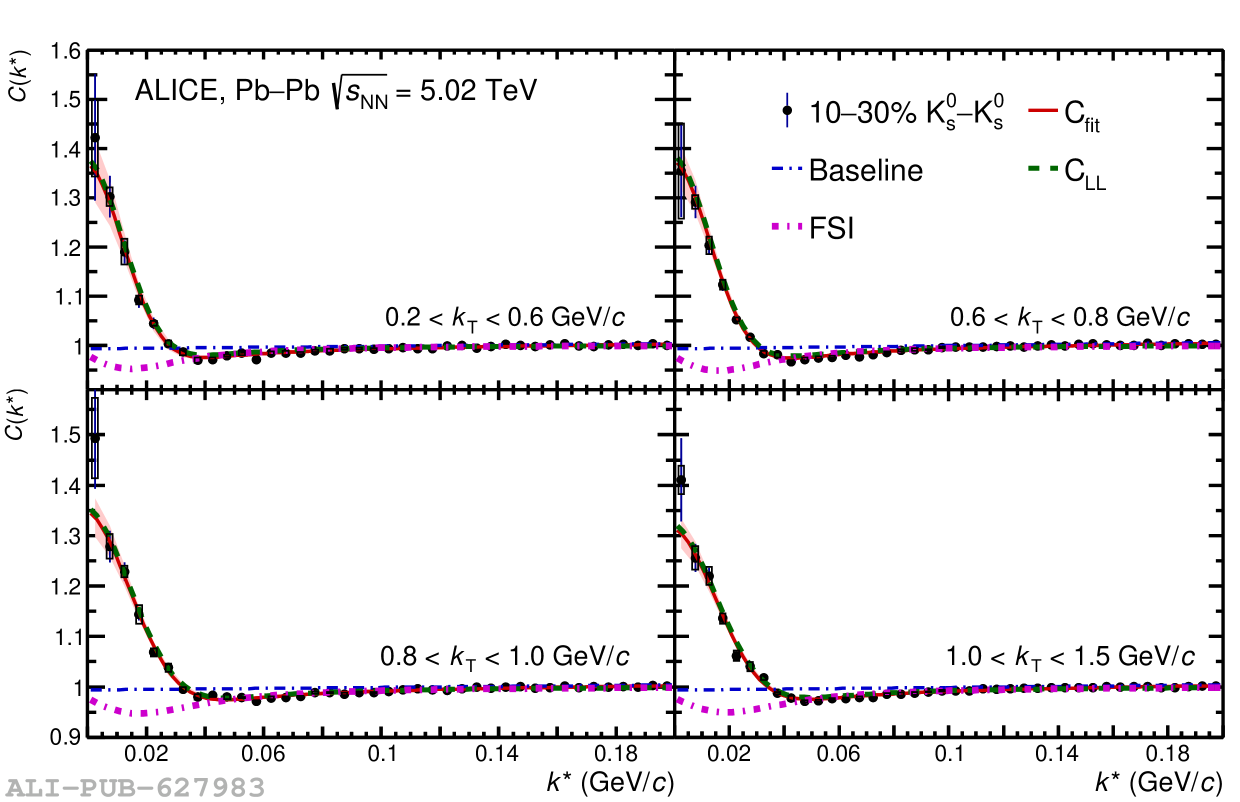 |
Figure 3
Extracted radii $R$ (left panel) and $\lambda$ (right panel) as a function of the average pair-transverse momentum \kt in the ranges 0.2--0.6, 0.6--0.8, 0.8--1.0, and 1.0--1.5 \GeVc for different centrality classes. Filled markers represent the results obtained for \PbPb at \fivenn, hollow markers refer to results obtained in \PbPb at \twosevensixnn with a horizontal offset applied for legibility. Vertical bars and boxes represent the statistical and systematic uncertainties, respectively. Predictions from HKM model calculations are reported with lines for different center-of-mass energies and centrality ranges. In the right panel, the star marker represents the data-driven calculation of the genuine $\lambda$ value (evaluated independently of \kt) from resonance-decay contributions. See text for details. | 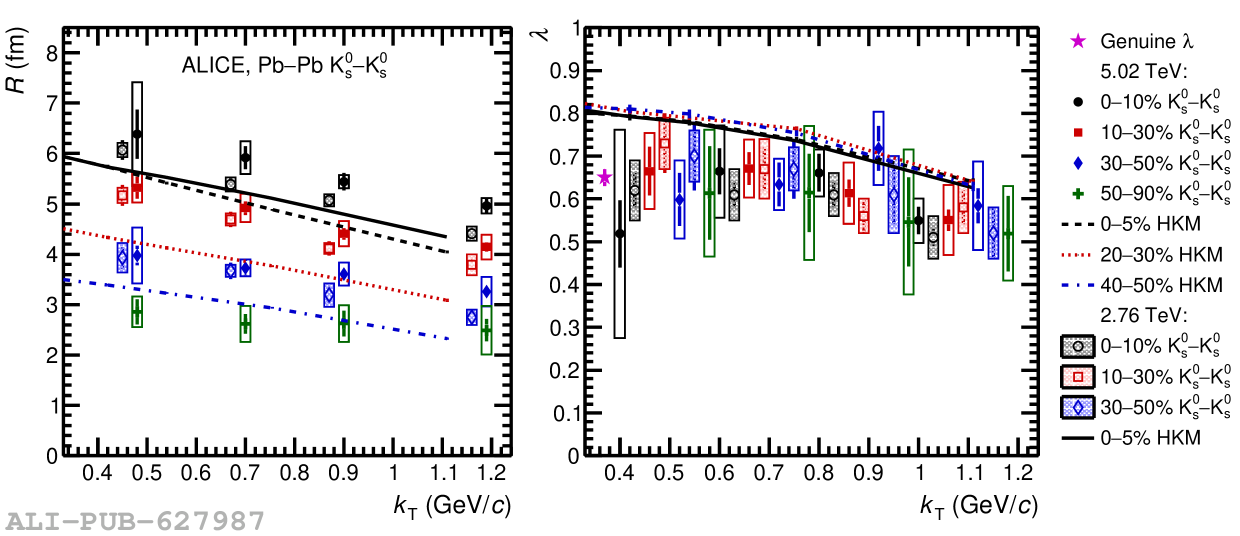 |
Figure 4
Radii $R$ (left) and $\lambda$ (right) as a function of the cubed root of the average charged-particle multiplicity density for different \kt ranges. Filled markers represent the results obtained for \PbPb at \fivenn, hollow markers refer to results obtained in \PbPb at \twosevensixnn . Vertical bars and boxes represent the statistical and systematic uncertainties, respectively. In the right plot, the star marker represents the estimated genuine $\lambda$ value calculated from resonance decay contributions. See text for details. | 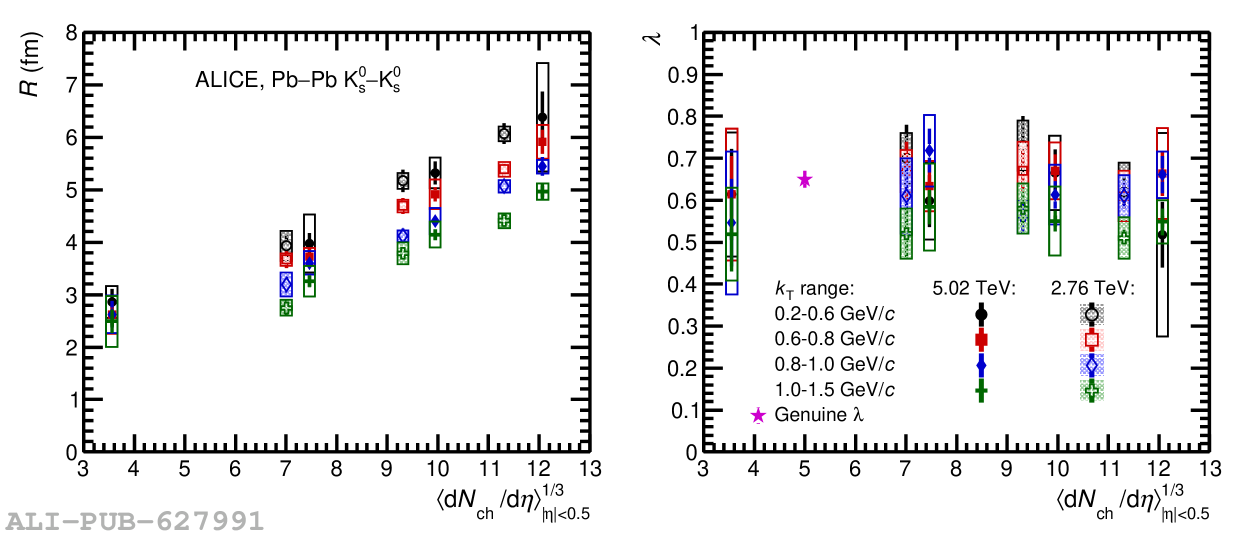 |
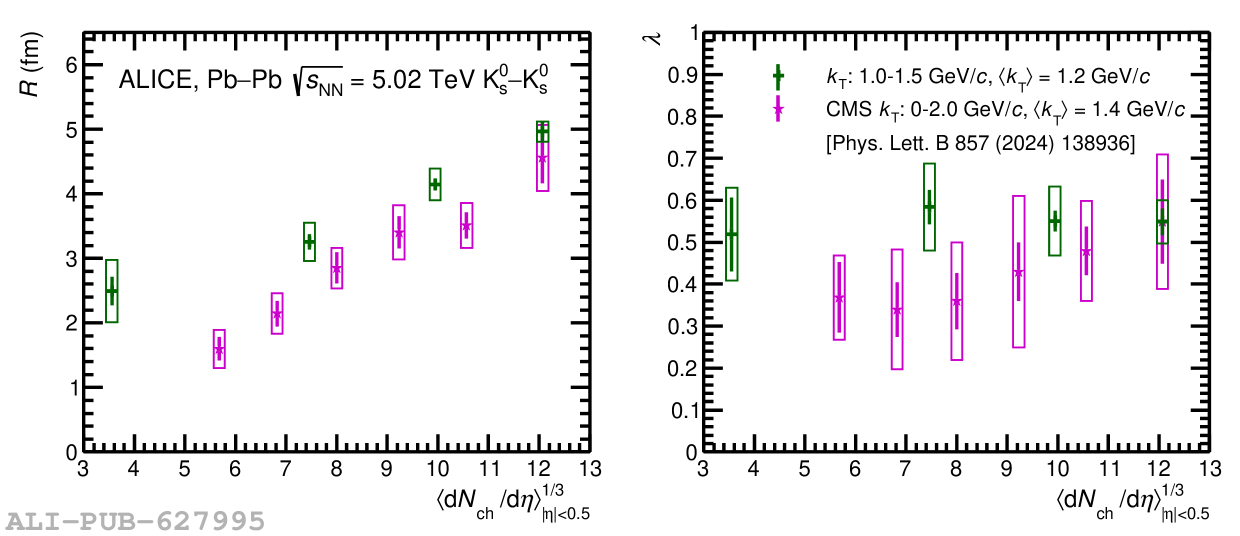
Figure A.1
Correlation functions and their fits for the 0--10\% centrality range. Statistical errors are represented by bars and systematic errors by boxes. The individual contributions to the overall fit are shown as different lines with statistical uncertainty shown as the band around the fit. | 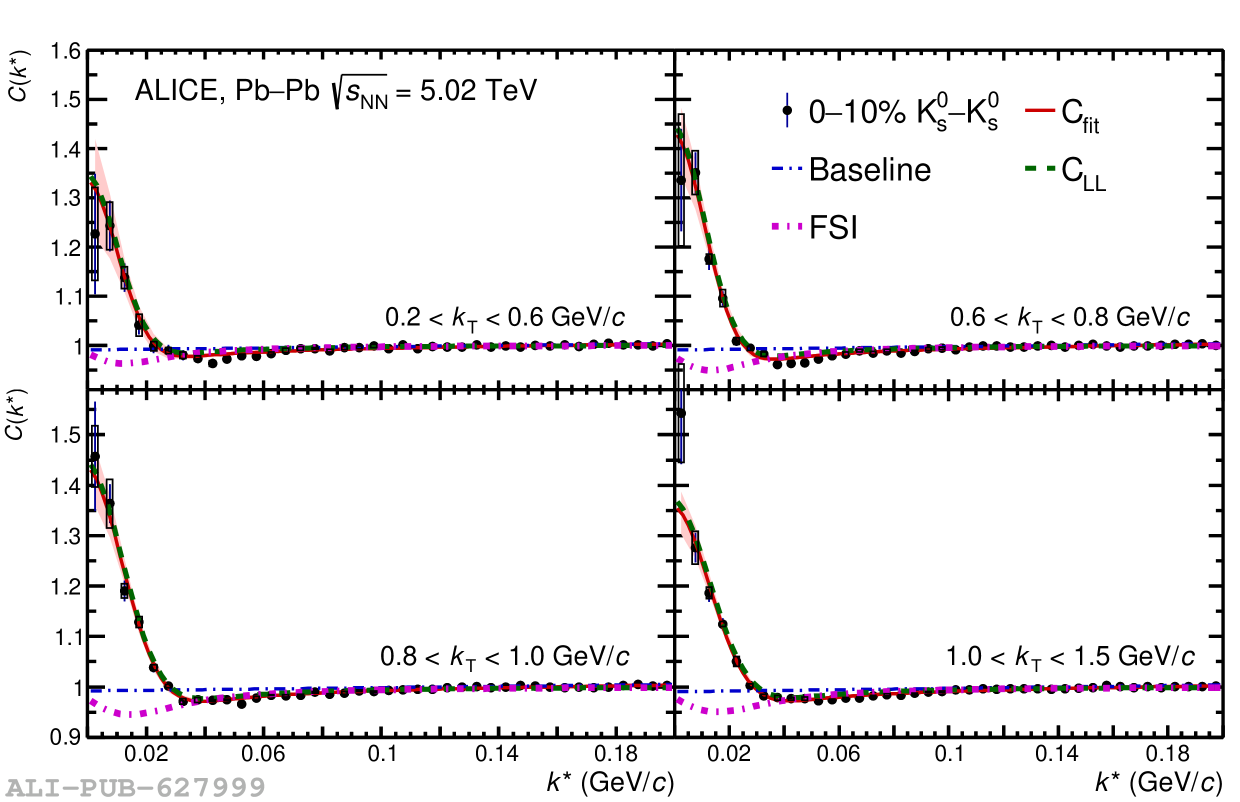 |
Figure A.2
Correlation functions and their fits for the 30--50\% centrality range. Statistical errors are represented by bars and systematic errors by boxes. The individual contributions to the overall fit are shown as different lines with statistical uncertainty shown as the band around the fit. | 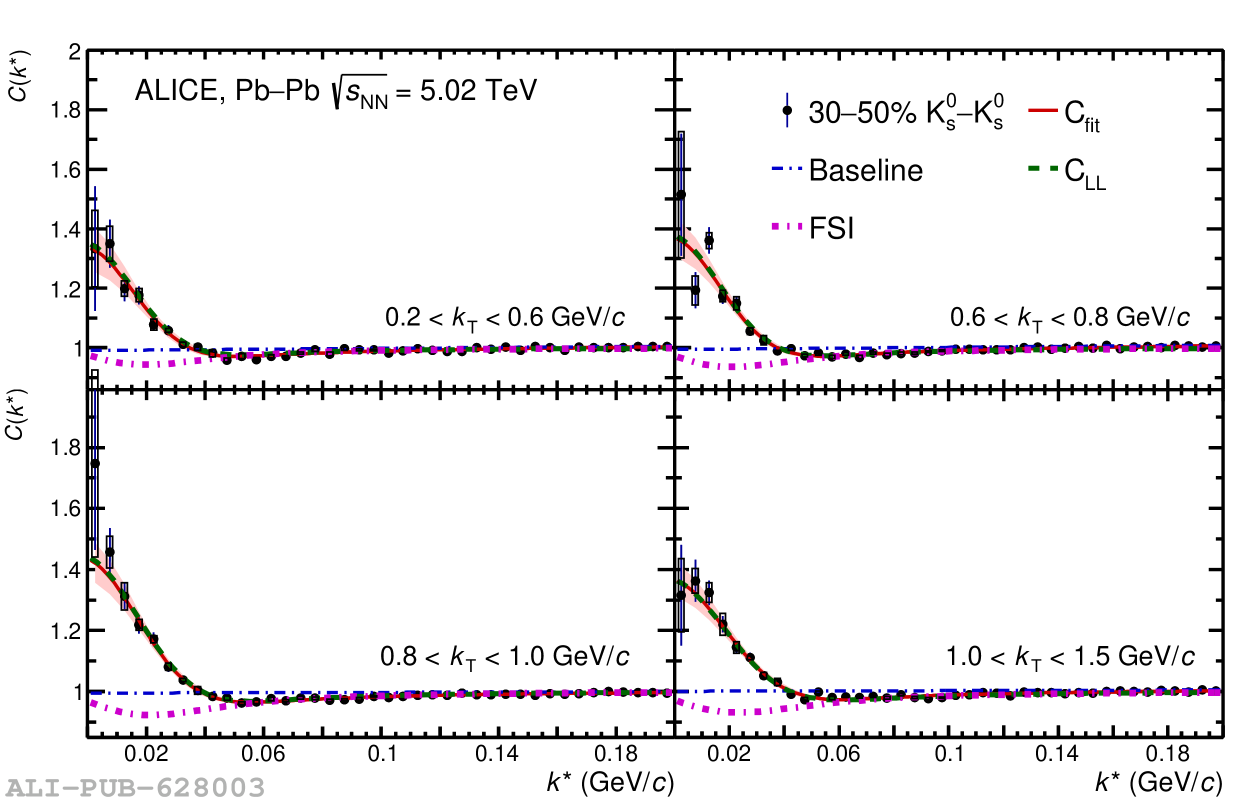 |
Figure A.3
Correlation functions and their fits for the 50--90\% centrality range. Statistical errors are represented by bars and systematic errors by boxes. The individual contributions to the overall fit are shown as different lines with statistical uncertainty shown as the band around the fit. | 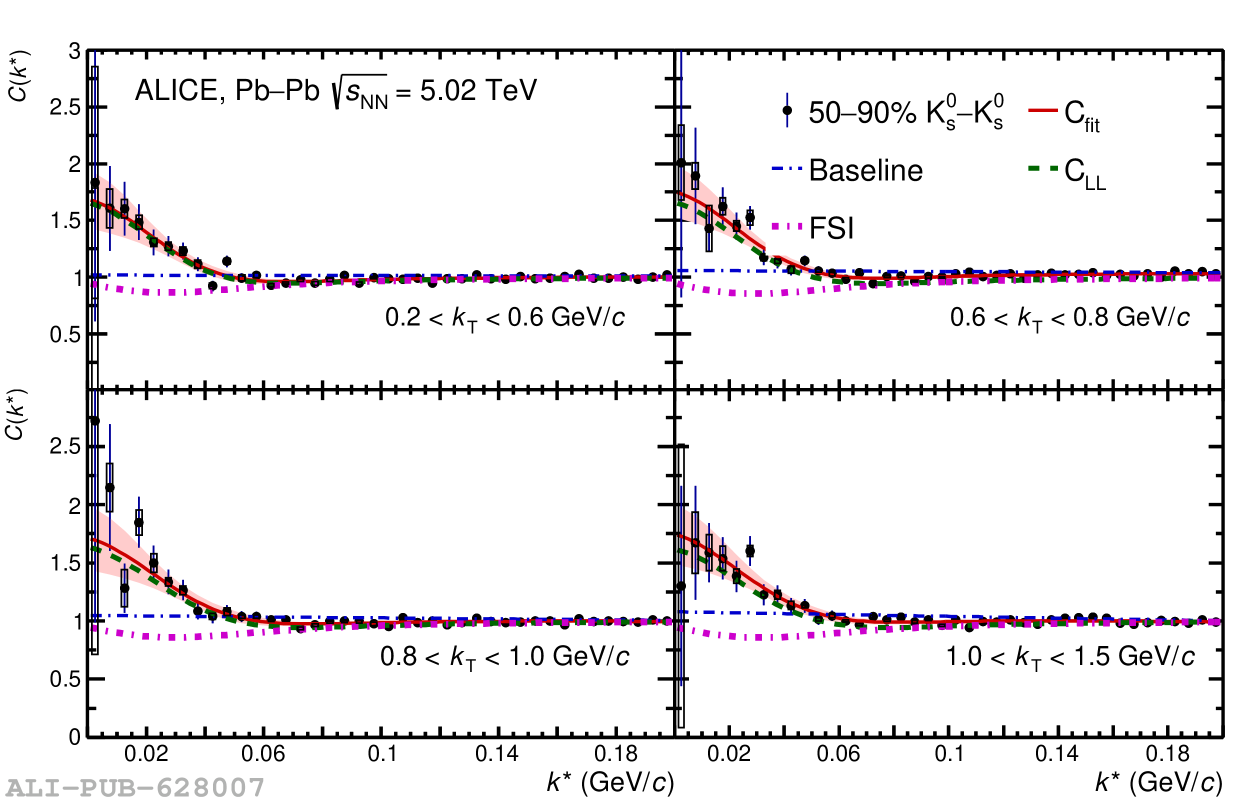 |