Extracted radii $R$ (left panel) and $\lambda$ (right panel) as a function of the average pair-transverse momentum \kt in the ranges 0.2--0.6, 0.6--0.8, 0.8--1.0, and 1.0--1.5 \GeVc for different centrality classes. Filled markers represent the results obtained for \PbPb at \fivenn, hollow markers refer to results obtained in \PbPb at \twosevensixnn with a horizontal offset applied for legibility. Vertical bars and boxes represent the statistical and systematic uncertainties, respectively. Predictions from HKM model calculations are reported with lines for different center-of-mass energies and centrality ranges. In the right panel, the star marker represents the data-driven calculation of the genuine $\lambda$ value (evaluated independently of \kt) from resonance-decay contributions. See text for details. | 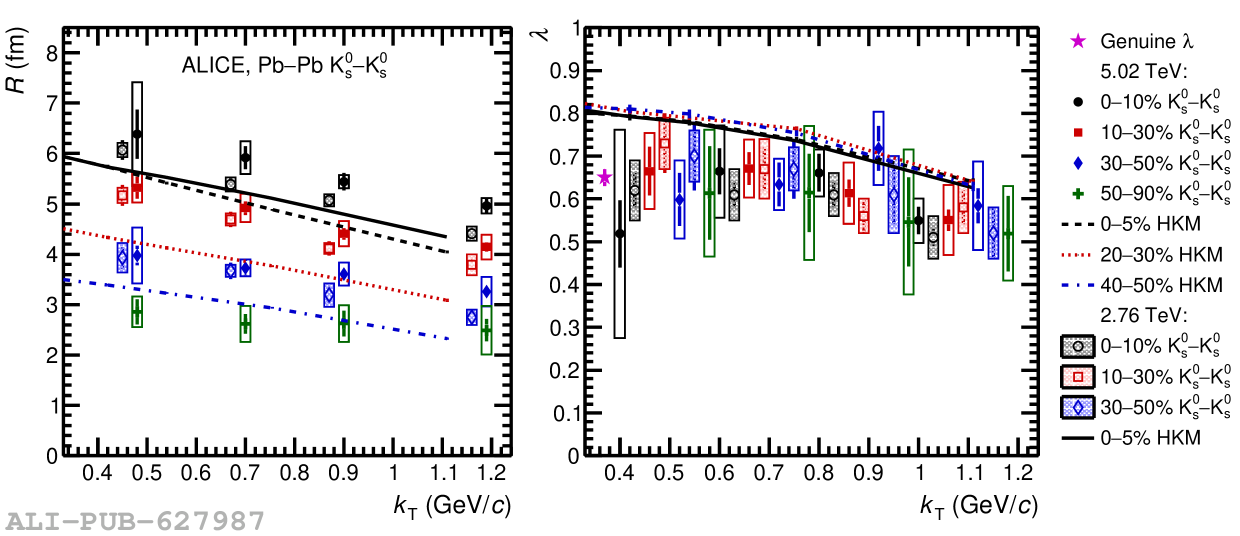 |