Correlation functions and their fits for the 50--90\% centrality range. Statistical errors are represented by bars and systematic errors by boxes. The individual contributions to the overall fit are shown as different lines with statistical uncertainty shown as the band around the fit. | 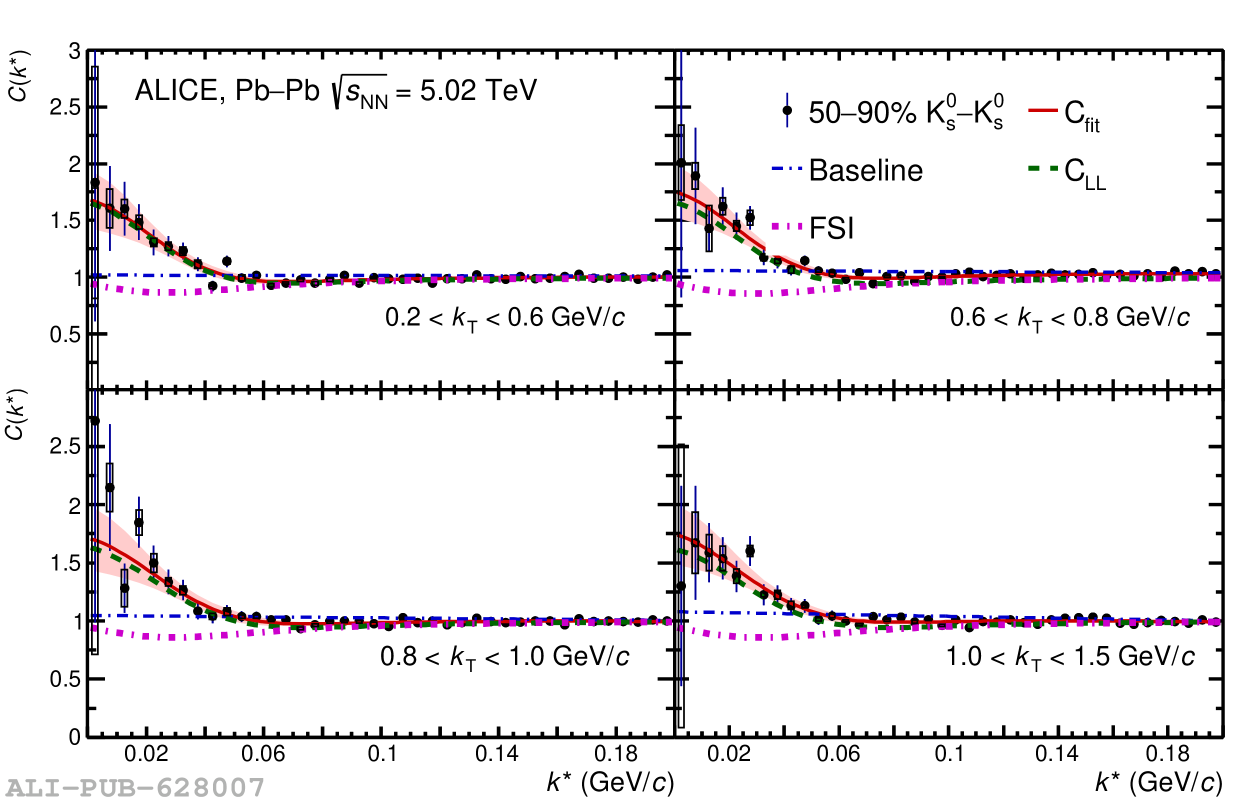 |