The ALICE Collaboration presents measurements of charged energy-energy correlators (charged EECs) within charged-particle jets at $\sqrt{s_{\rm NN}} = 5.02$ TeV in proton-proton and proton-lead collisions at the LHC. Charged EECs are a class of jet substructure observables that trace the flow of energy and electric charge within a jet, and provide a tool for disentangling the energy scales involved in the jet fragmentation process through the angular separation and charges of particle pairs. The interplay between energy distribution and charge conservation enables charged EECs to provide novel constraints on hadronization mechanisms. Measurements of charged EECs in proton--proton collisions in charged-particle jets with $20 <~ p_{\rm T,chjet} <~ 80$ GeV/$c$ are compared to event generators to investigate different hadronization mechanisms and parton shower models. These model comparisons show that the like-sign EECs are sensitive to changes in parton shower modeling, while unlike-sign EECs are sensitive to different hadronization schemes. Measurements in proton-lead collisions indicate that cold nuclear matter effects on charged EECs are consistent with charge-independent behavior.
Submitted to: PRC
e-Print: arXiv:2606.18093 | PDF | inSPIRE
CERN-EP-2026-172
Figure group
Figure 1
The inclusive (left panel), charge-selected (middle three panels), and charge-weighted EECs (right panel) in pp collisions are plotted as a function of $R_\mathrm{L}$ for 20–40 (red circles), 40–60 (blue squares), and 60–80 (purple diamonds) GeV/$c$ charged-particle jets. Statistical uncertainties are shown as vertical lines, and systematic uncertainties as shaded boxes. | 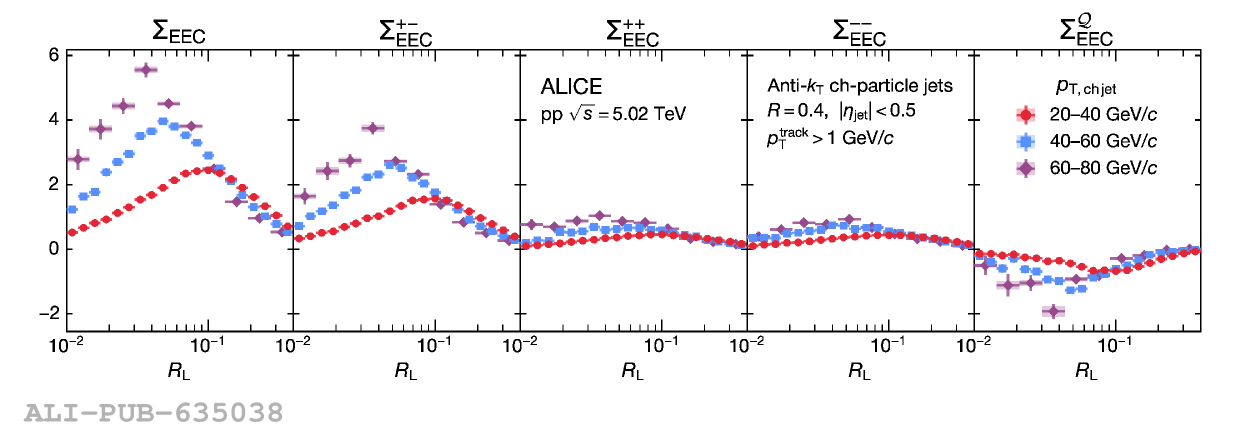 |
Figure 2
The ratio of $\Sigma^{++}_\mathrm{EEC}$ to $\Sigma^{--}_\mathrm{EEC}$ in pp collisions as a function of $R_\mathrm{L}$ for 20–40, 40–60, and 60–80 GeV/$c$ charged-particle jets, along with predictions from five MC event generators. Statistical uncertainties on the data are shown as vertical lines, and systematic uncertainties as shaded boxes. Ratios to the data are shown in the second row, and the relative combined statistical and systematic uncertainties on the data are shown as shaded gray boxes surrounding the dashed unity line. | 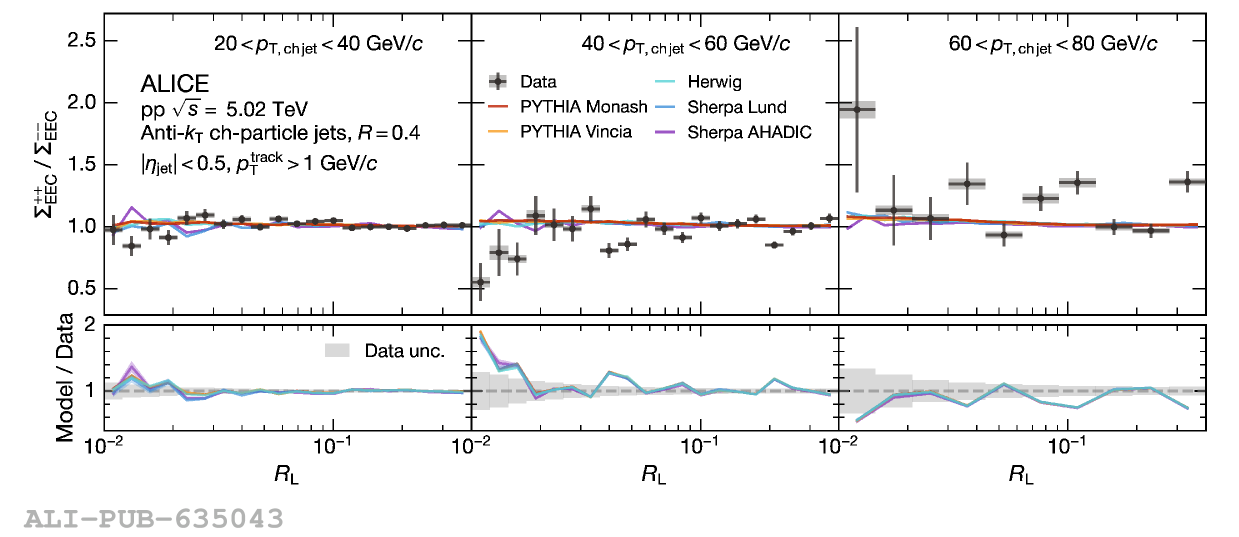 |
Figure 3
Comparison of the inclusive and charge-selected EECs in pp collisions for 20–40 GeV/$c$ jets with five different MC models. In the first row, statistical uncertainties on the data are shown as vertical lines, and systematic uncertainties are shown as shaded boxes. Statistical uncertainties on the five models are shown as shaded bands around the lines but are mostly too small to be seen. For the model-to-data ratios displayed in the bottom two rows, the relative combined statistical and systematic uncertainties on the data are shown as shaded gray boxes surrounding the dashed unity line. The relative statistical uncertainties from the models are shown as colored shaded bands around each line. | 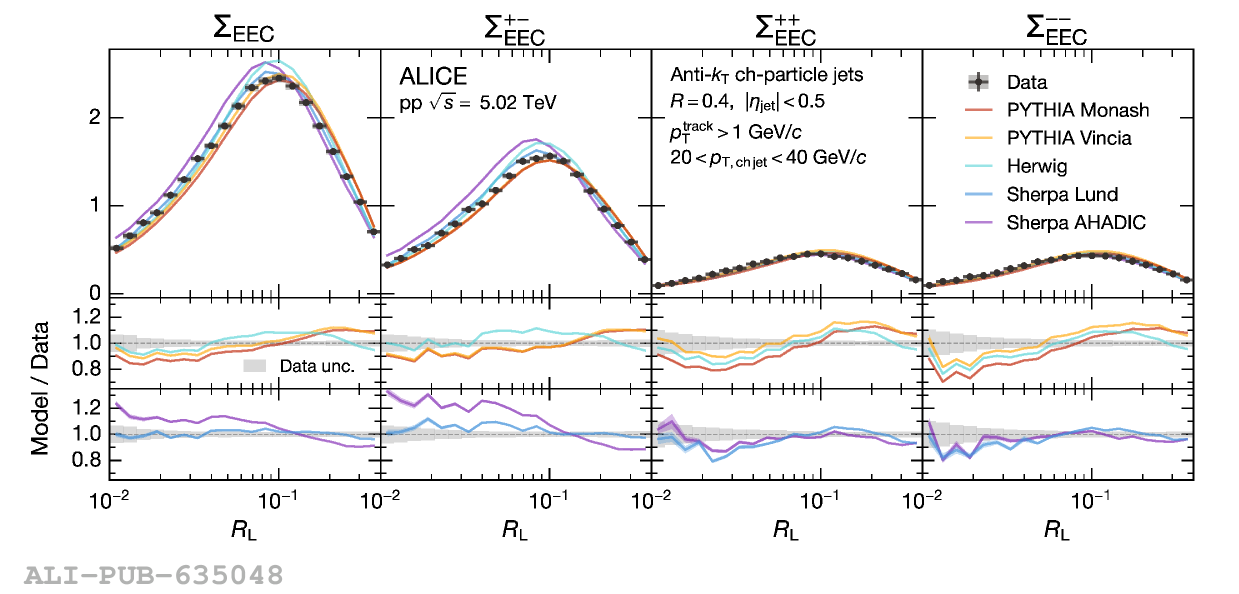 |
Figure 4
Comparison of the charge-weighted EEC in pp collisions with five different Monte Carlo models in each interval of $p_{\mathrm{T,ch\,jet}}$. In the first row, statistical uncertainties on the data are shown as vertical lines, and systematic uncertainties are shown as shaded boxes. Statistical uncertainties on the five models are shown as shaded bands around the lines but are mostly too small to be seen. For the model-to-data ratios displayed in the bottom two rows, the relative combined statistical and systematic uncertainties on the data are shown as shaded gray boxes surrounding the dashed unity line. The relative statistical uncertainties from the models are shown as colored shaded bands around each line. |  |
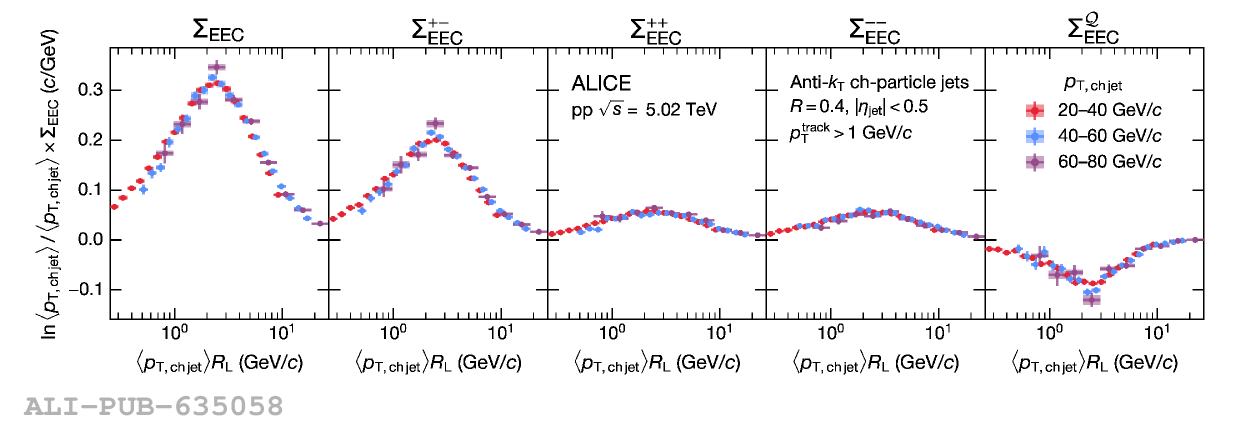
Figure 6
The transition scales (top row) and peak heights (bottom row) of the scaled charged and inclusive EECs in ALICE data, as a function of the average $p_{\mathrm{T,ch\,jet}}$ in each interval. The statistical uncertainties are shown as vertical lines, and the systematic uncertainties are shown as shaded boxes. The horizontal uncertainties are set to $\pm$5 GeV/$c$ and are purely for visibility. Constant (blue) and linear fits (orange) across $\langle p_{\mathrm{T,ch\,jet}} \rangle$ for each EEC are also shown as lines, with the surrounding shaded bands representing the 1$\sigma$ fit uncertainty. | 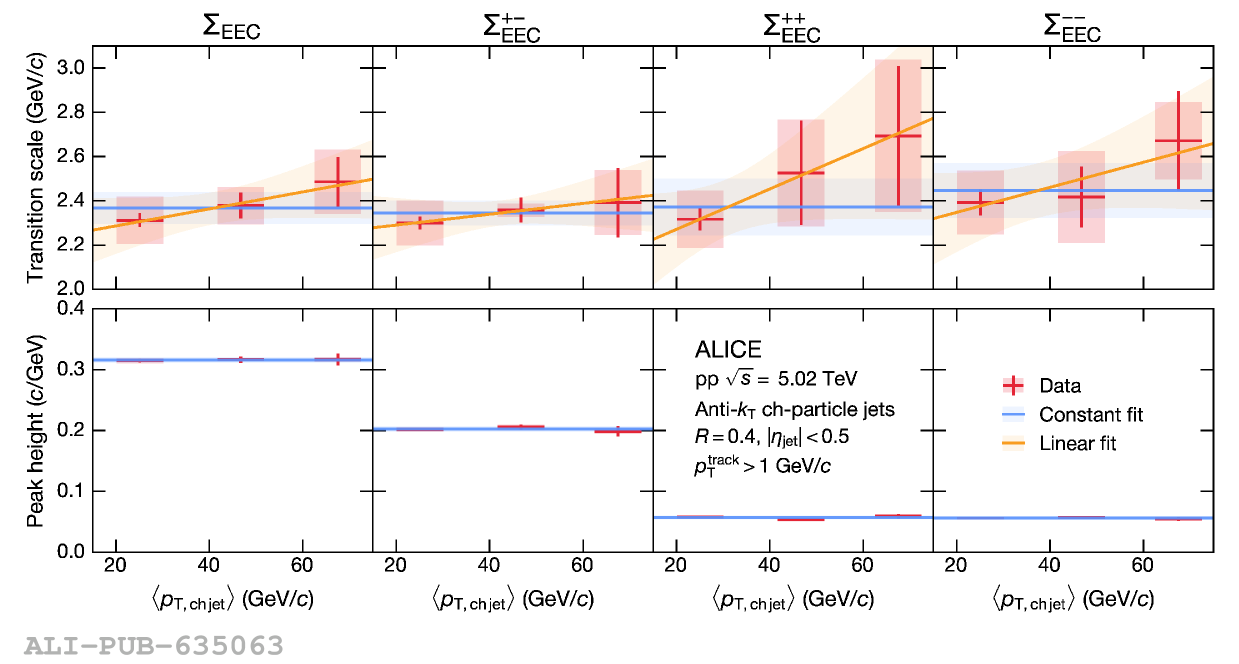 |
Figure 8
The charged EEC asymmetry, defined as the ratio of the charge-weighted EEC to the inclusive EEC, in pp collisions in the three $p_{\mathrm{T,ch\,jet}}$ intervals. The statistical uncertainties are shown as vertical lines, and the systematic uncertainties as shaded gray boxes. The transition angles, defined as the transition scale divided by $\langle p_{\mathrm{T,ch\,jet}} \rangle$ in the given interval, are extracted from Figure 5 and displayed as vertical tan lines in the top row, with combined statistical and systematic uncertainties displayed as shaded bands. The relative combined statistical and systematic uncertainties on the data are shown as shaded boxes around the dashed unity line in the bottom row. Statistical uncertainties from each model are shown as shaded bands around the ratio lines, but are mostly too small to be visible. | 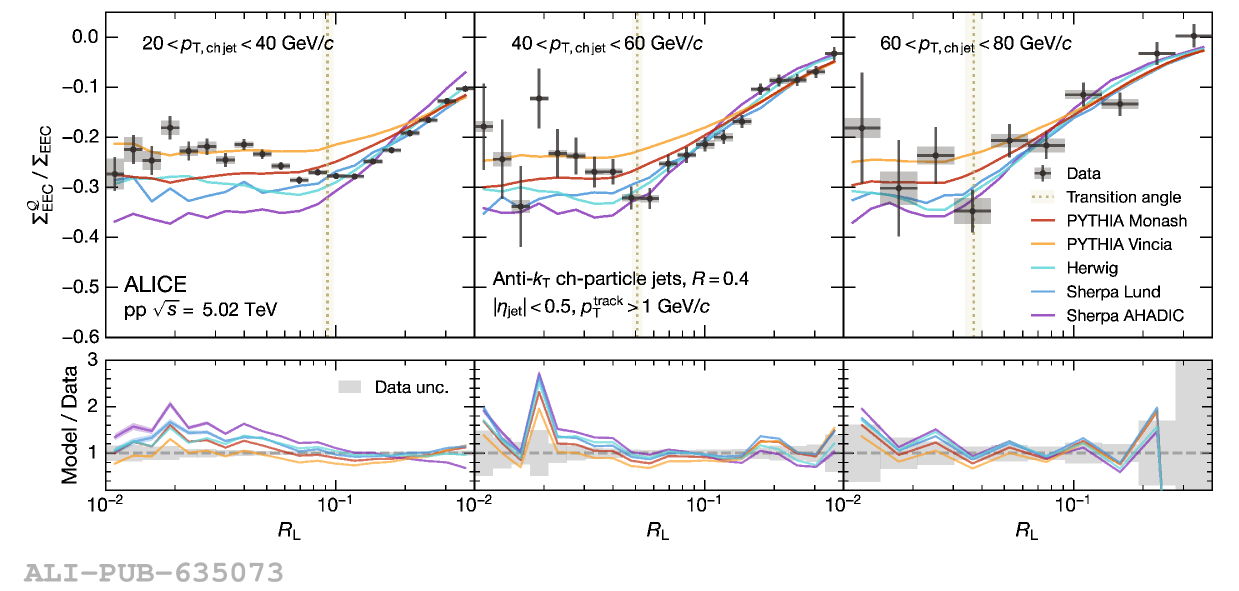 |