The transition scales (top row) and peak heights (bottom row) of the scaled charged and inclusive EECs in ALICE data, as a function of the average $p_{\mathrm{T,ch\,jet}}$ in each interval. The statistical uncertainties are shown as vertical lines, and the systematic uncertainties are shown as shaded boxes. The horizontal uncertainties are set to $\pm$5 GeV/$c$ and are purely for visibility. Constant (blue) and linear fits (orange) across $\langle p_{\mathrm{T,ch\,jet}} \rangle$ for each EEC are also shown as lines, with the surrounding shaded bands representing the 1$\sigma$ fit uncertainty. | 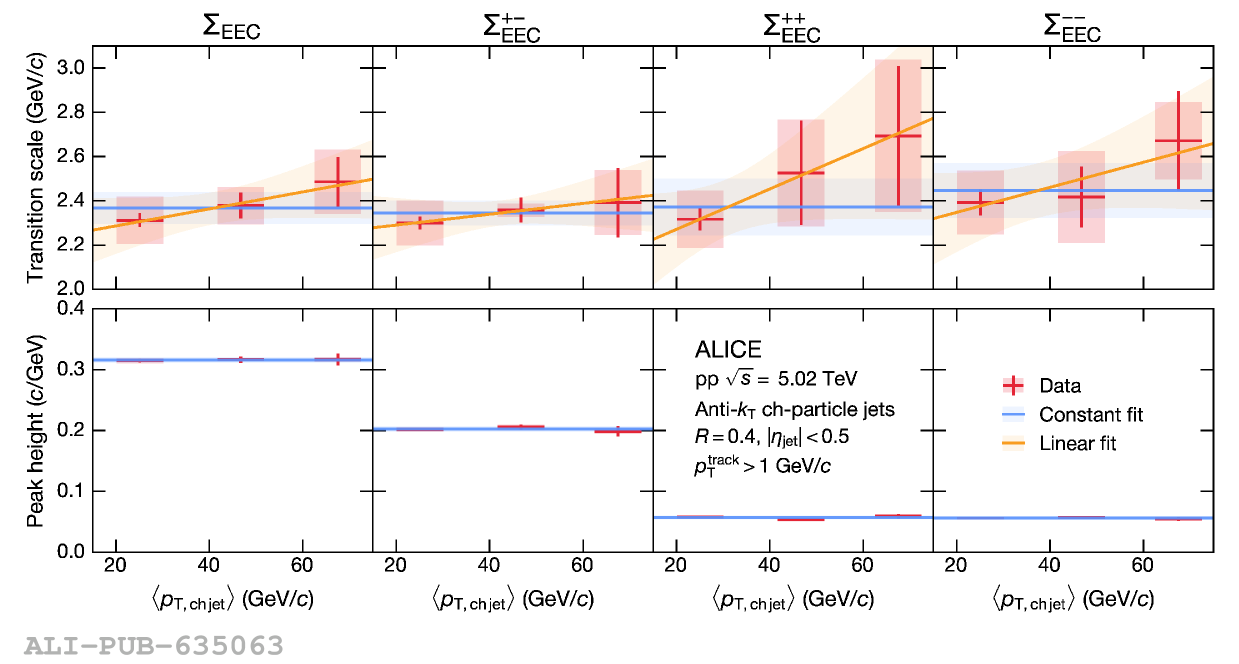 |