The charged EEC asymmetry, defined as the ratio of the charge-weighted EEC to the inclusive EEC, in pp collisions in the three $p_{\mathrm{T,ch\,jet}}$ intervals. The statistical uncertainties are shown as vertical lines, and the systematic uncertainties as shaded gray boxes. The transition angles, defined as the transition scale divided by $\langle p_{\mathrm{T,ch\,jet}} \rangle$ in the given interval, are extracted from Figure 5 and displayed as vertical tan lines in the top row, with combined statistical and systematic uncertainties displayed as shaded bands. The relative combined statistical and systematic uncertainties on the data are shown as shaded boxes around the dashed unity line in the bottom row. Statistical uncertainties from each model are shown as shaded bands around the ratio lines, but are mostly too small to be visible. | 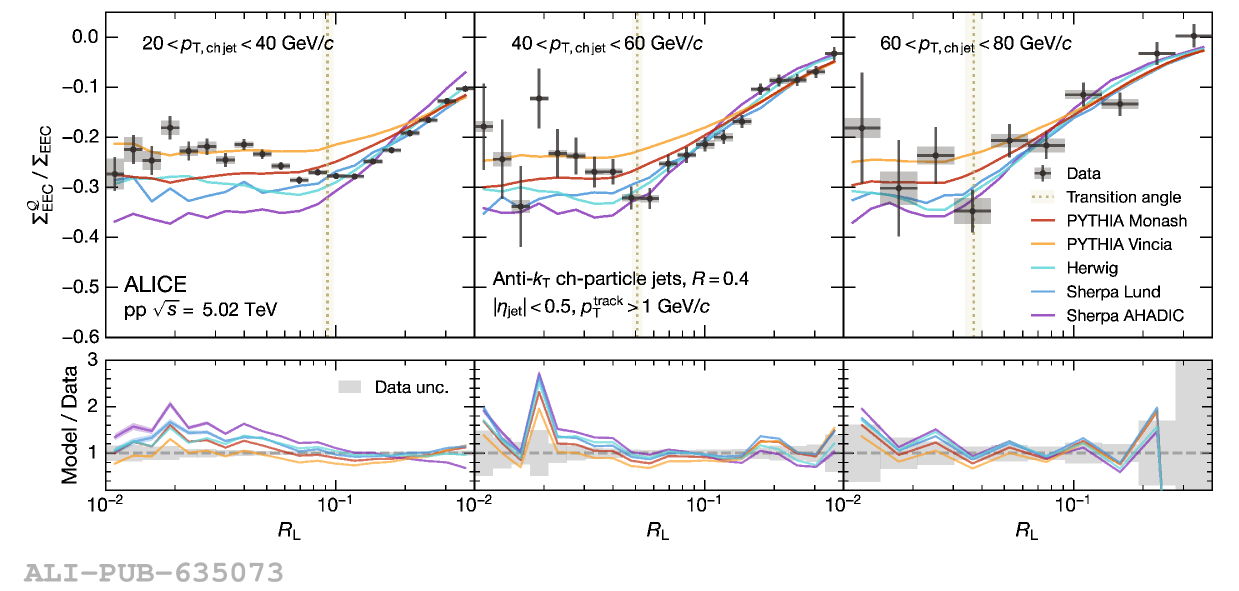 |