This work reports femtoscopic correlations of p$-$p ($\bar{\rm p}-\bar{\rm p}$) and p$-$d ($\bar{\rm p}-\bar{\rm d}$) pairs measured in Pb$-$Pb collisions at center-of-mass energy per nucleon $\sqrt{s_{\rm NN}}$ = 5.02 TeV in the ALICE Collaboration. A fit to the measured proton-proton correlation functions allows one to extract the dependence of the nucleon femtoscopic radius of the particle-emitting source on the pair transverse mass ($m_\text{T}$) and on the average charge particle multiplicity $\langle\text{dN}_\text{ch}/\text{d}η\rangle^{1/3}$ for three centrality intervals (0$-$10$\%$, 10$-$30$\%$, 30$-$50$\%$). In both cases, the expected power-law and linear scalings are observed, respectively. The measured p$-$d correlations can be described by both two- and three-body calculations, indicating that the femtoscopy observable is not sensitive to the short-distance features of the dynamics of the p$-$(p$-$n) system, due to the large inter-particle distances in Pb$-$Pb collisions at the LHC. Indeed, in this study, the minimum measured femtoscopic source sizes for protons and deuterons have a minimum value at $2.73^{+0.05}_{-0.05}$ and $3.10^{+1.04}_{-0.86}$ fm, respectively, for the 30$-$50$\%$ centrality collisions. Moreover, the $m_{\rm{T}}$-scaling obtained for the p$-$p and p$-$d systems is compatible within 1$σ$ of the uncertainties. These findings provide new input for fundamental studies on the production of light (anti)nuclei under extreme conditions.
Phys. Lett. B 871 (2025) 139921
HEP Data
e-Print: arXiv:2505.01061 | PDF | inSPIRE
CERN-EP-2025-096
Figure group
Figure 1
Top panels: raw p$-$p correlation functions as a function of $k^{*}$ in one exemplary $m_{\rm T}$ interval obtained from Pb$-$Pb collisions at $\sqrt{s_{\rm NN}} = $ 5.02 TeV in the 0--10$\%$ (a), 10--30$\%$ (b) and 30--50$\%$ (c) centrality intervals, respectively. The black open markers represent the data, while the vertical lines and the boxes indicate the statistical and systematic uncertainties, respectively. The red region represents the 1$\sigma$ uncertainty range of the fits performed using CATS. The non-femtoscopic background contributions are shown by the light cyan bands. Bottom panels: $n_{\sigma}$ calculated as data-to-fit difference, normalized by the total uncertainty of experimental data. | 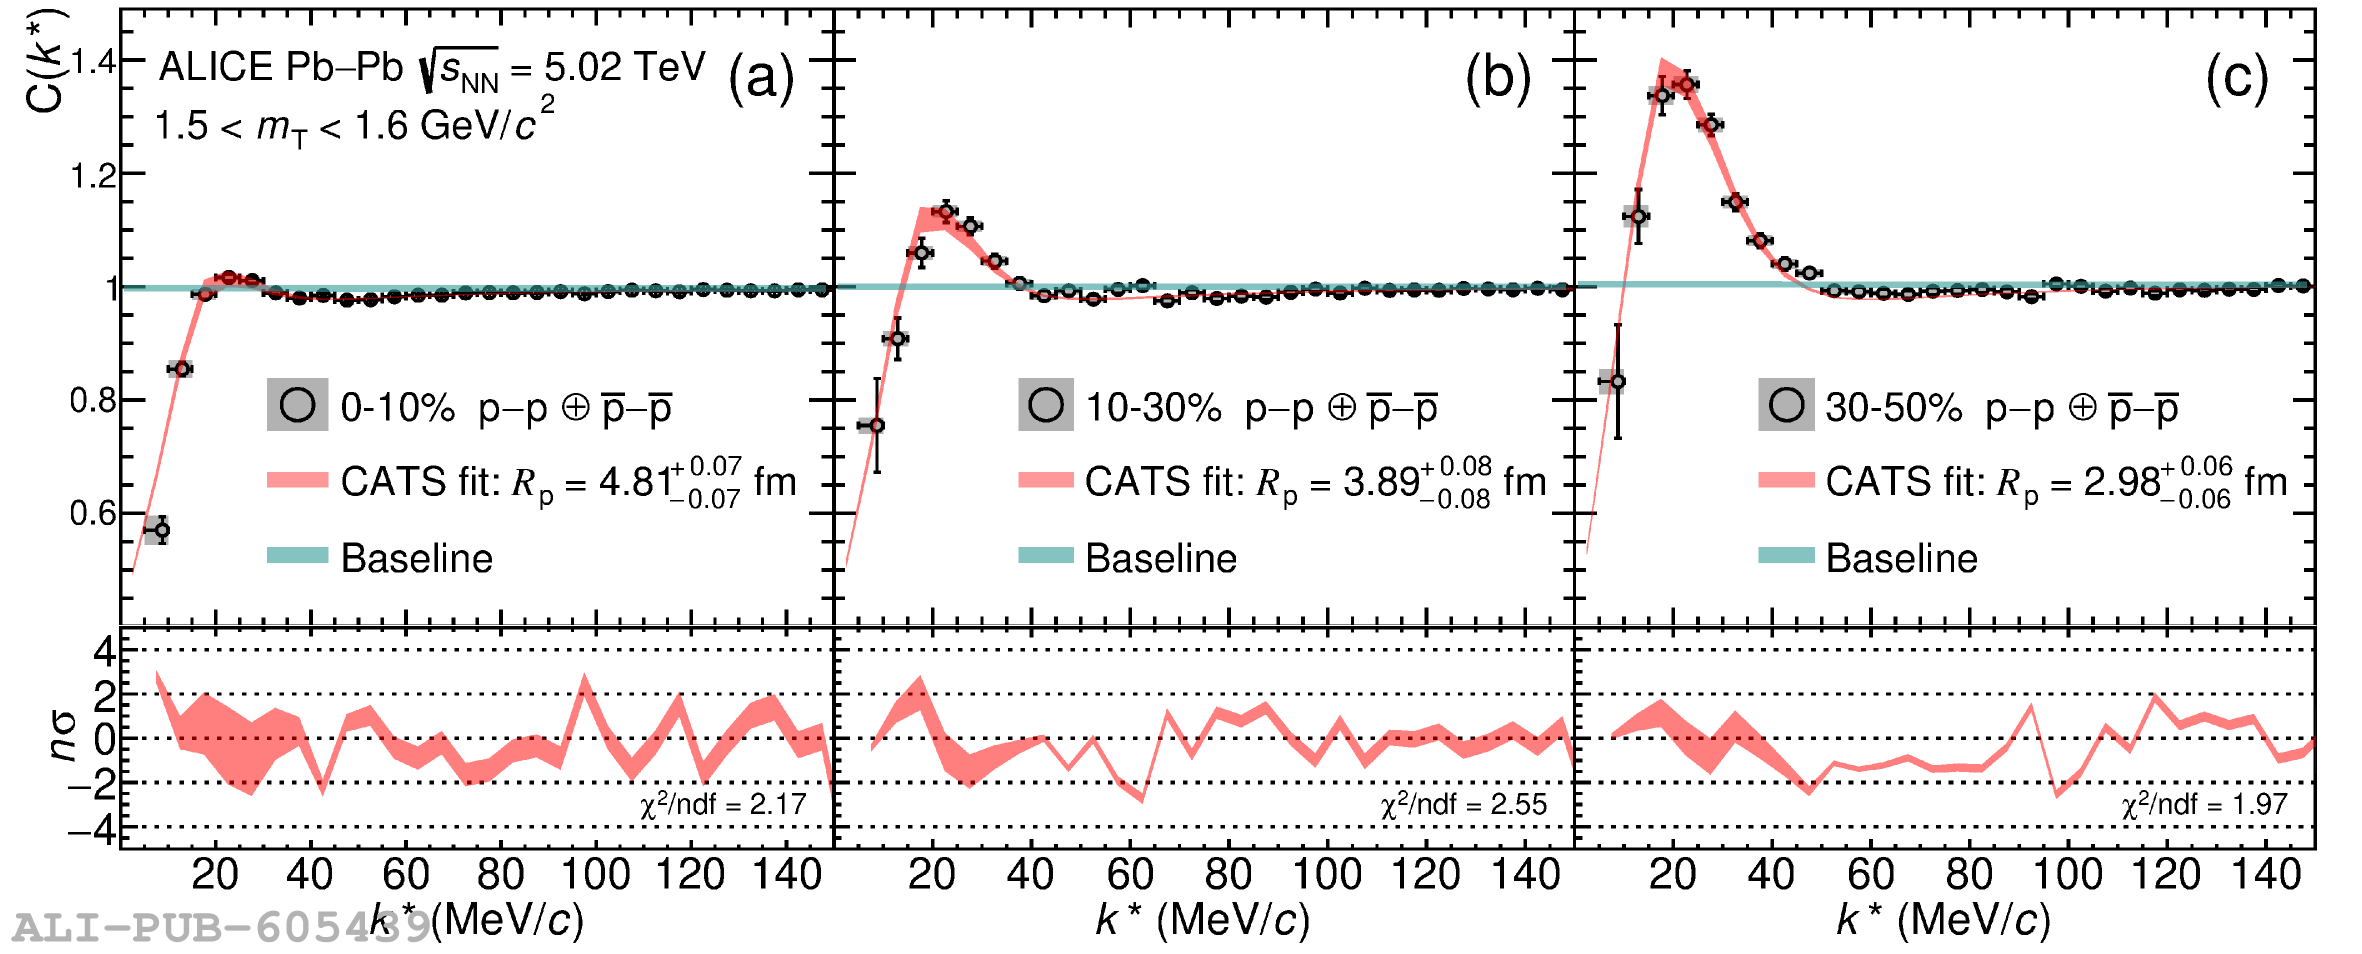 |
Figure 2
Left panel: The femtoscopic source size of protons ($R_\text{p}$) measured as a function of $m_\text{T}$ in Pb$-$Pb collisions at $\sqrt{s_{\rm NN}} = 5.02$TeV is represented by full red, blue, and green markers for the 0$-$10$\%$, 10$-$30$\%$, 30$-$50$\%$ centrality intervals, respectively. The open diamond and squared markers represent the values of femtoscopic source sizes of nucleons ($R_\text{N}$) and deuterons ($R_\text{d}$), obtained by fitting the measured p$-$d correlation function with the L--L and Pisa models, where in the later the AV18 +UIX potential is used. Right panel: $R_\text{p}$ as a function of $\langle \text{dN}_\text{ch}/\text{d}\eta\rangle^{1/3}$ for eight $m_\text{T}$ intervals. The shaded bands in the two panels depict the $m_{\rm T}$ and $\langle \text{dN}_\text{ch}/\text{d}\eta\rangle^{1/3}$ dependence of the measured radii fitted with power-law function, $R_\text{p} = \it{a} + \it{b}\cdot\langle m_\text{T}\rangle^{\it{c}}$, and linear function $R_\text{p}=A\cdot\langle \text{dN}_\text{ch}/\text{d}\eta\rangle^{1/3}+B$, respectively. The bandwidth reflects the 1$\sigma$ range of the fit solutions, obtained by bootstrapping the radii over their statistical and systematic uncertainties. | 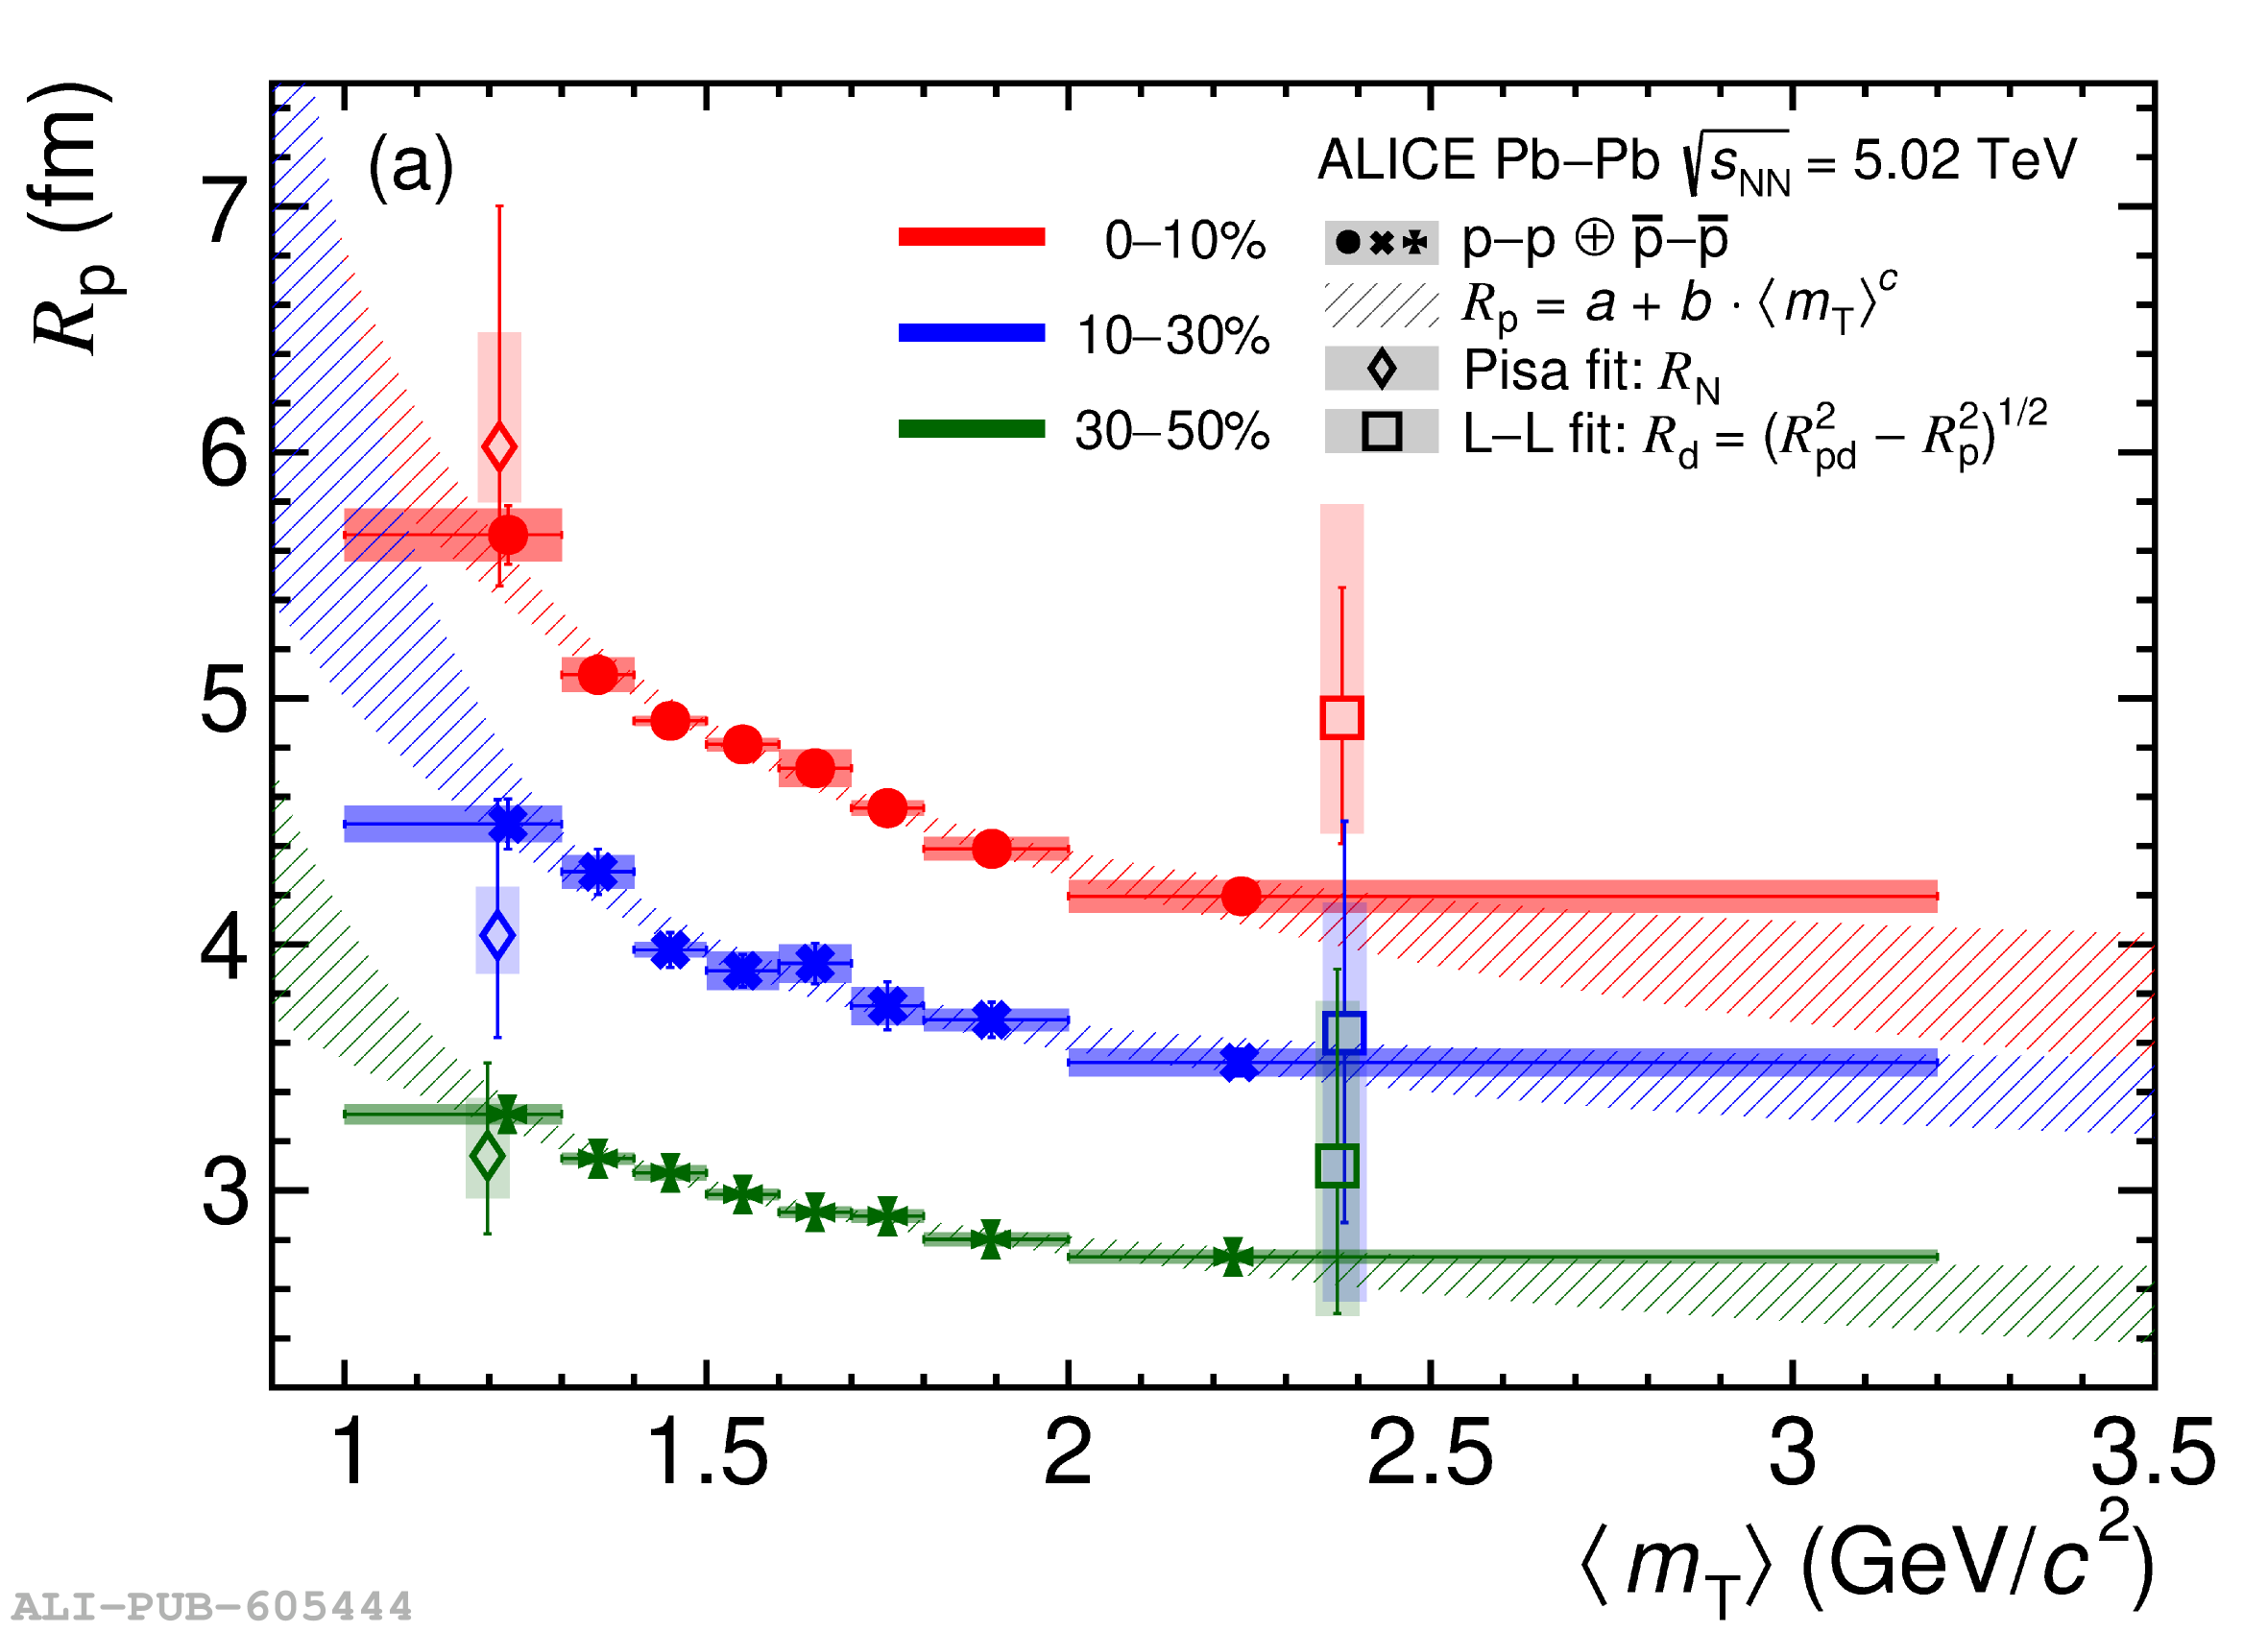 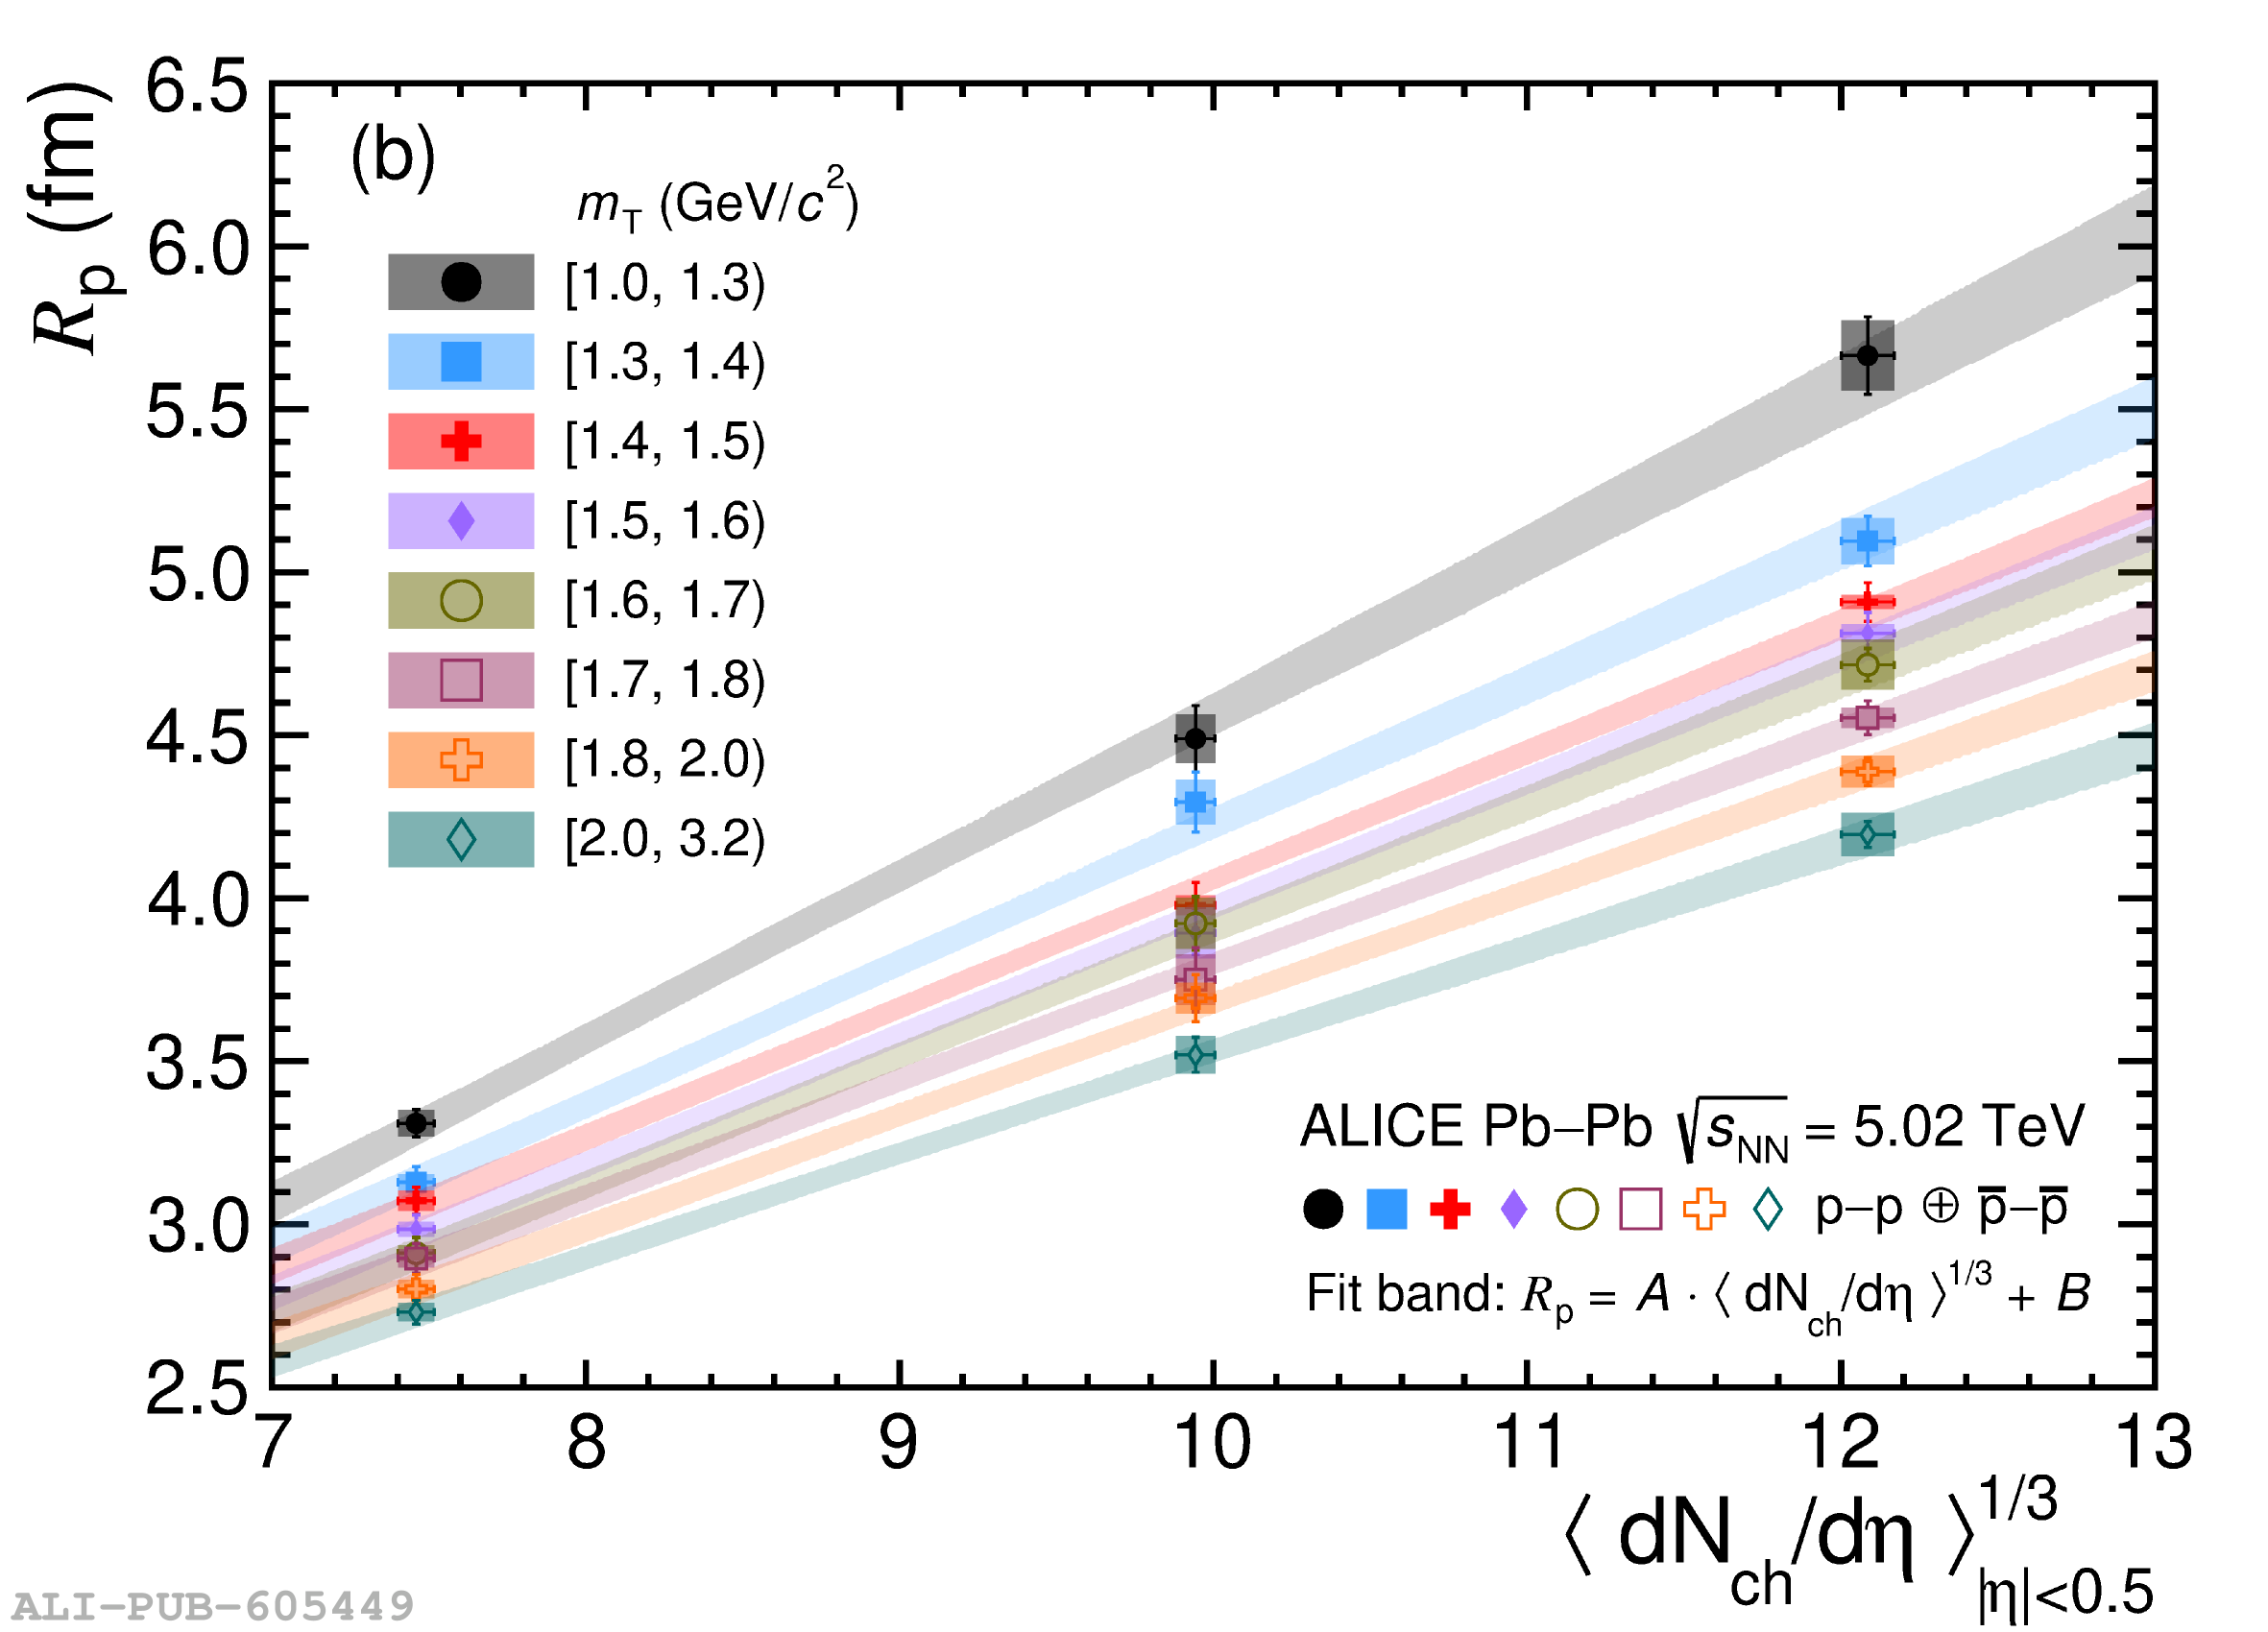 |
Figure 3
Top panels: genuine p$-$d correlation function as a function of $k^{*}$ obtained from Pb--Pb collisions at $\sqrt{s_{\rm NN}} = $ 5.02 TeV in the 0$-$10$\%$ (a), 10$-$30$\%$ (b) and 30$-$50$\%$ (c) centrality intervals, respectively. The measured data are shown as black open markers, while the vertical lines and the boxes represent the statistical and systematic uncertainties, respectively. The correlation functions are shown together with a fit band of 1$\sigma$ uncertainties performed using the three-body approach employing AV18+UIX potentials (Pisa fit, red bands) and using the Lednick\'y--Lyuboshitz approach (L--L fit, blue bands) The non-femtoscopic background contributions are represented by the light cyan band. Bottom panels: $n_{\sigma}$ calculated as data-to-fit difference, normalized by the total uncertainty of experimental data. | 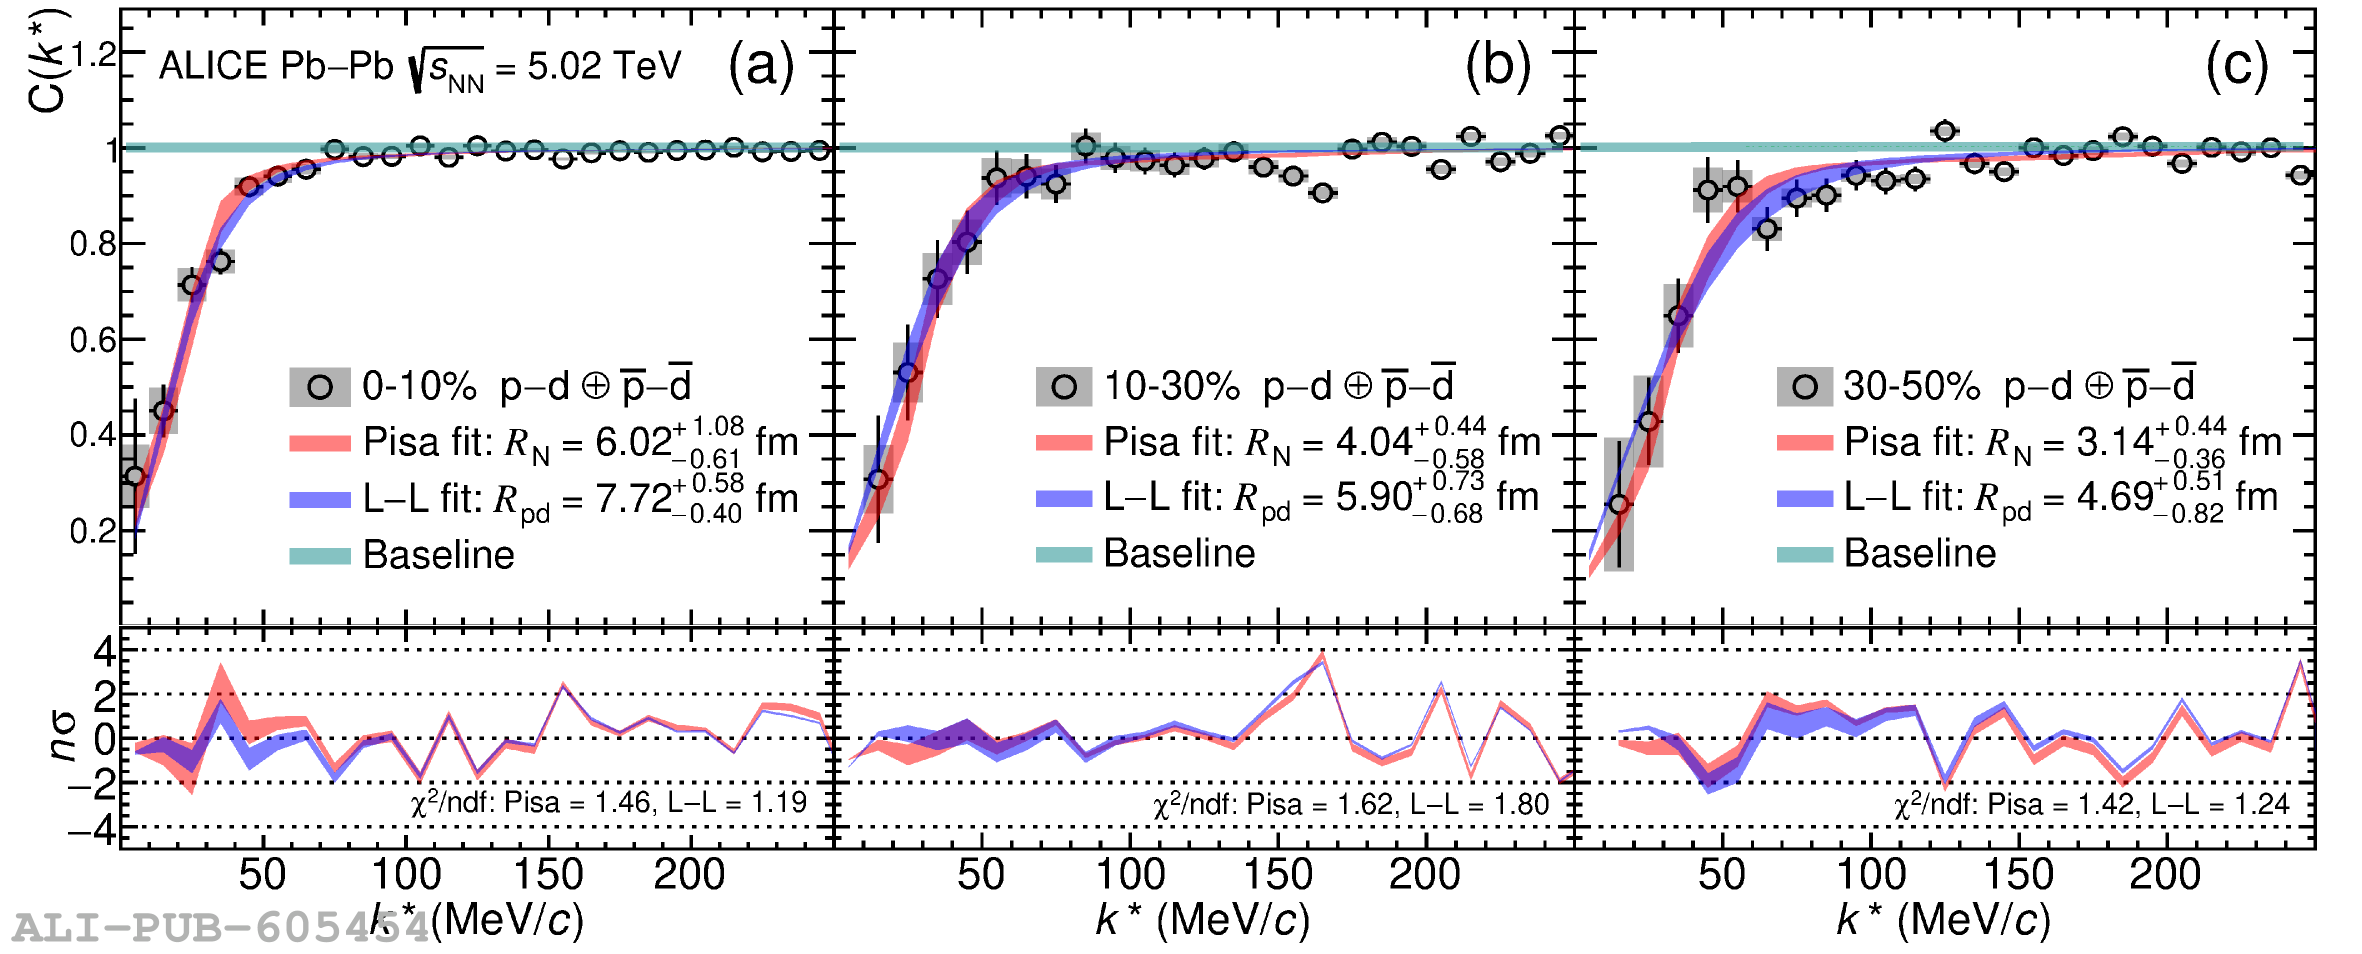 |