Left panel: The femtoscopic source size of protons ($R_\text{p}$) measured as a function of $m_\text{T}$ in Pb--Pb collisions at $\sqrt{s_{\rm NN}} = $ 5.02 TeV is represented by full red, blue, and green markers for the 0-10%, 10-30%, 30-50% centrality intervals, respectively. The open diamond and squared markers represent the values of femtoscopic source sizes of nucleons ($R_\text{N}$) and deuterons ($R_\text{d}$), obtained by fitting the measured p-d correlation function with the L--L and Pisa models, where in the later the AV18 +UIX potential is used. Right panel: $R_\text{p}$ as a function of $\langle \text{dN}_\text{ch}/\text{d}\eta\rangle^{1/3}$ for eight $m_{\rm T}$ intervals. The shaded bands in the two panels depict the $m_{\rm T}$ and $\langle \text{dN}_\text{ch}/\text{d}\eta\rangle^{1/3}$ dependence of the measured radii fitted with power-law function, $R_\text{p} = \it{a} + \it{b}\cdot\langle m_\text{T}\rangle^{\it{c}}$, and linear function $R_\text{p}=A\cdot\langle \text{dN}_\text{ch}/\text{d}\eta\rangle^{1/3}+B$, respectively. The bandwidth reflects the 1$\sigma$ range of the fit solutions, obtained by bootstrapping the radii over their statistical and systematic uncertainties. | 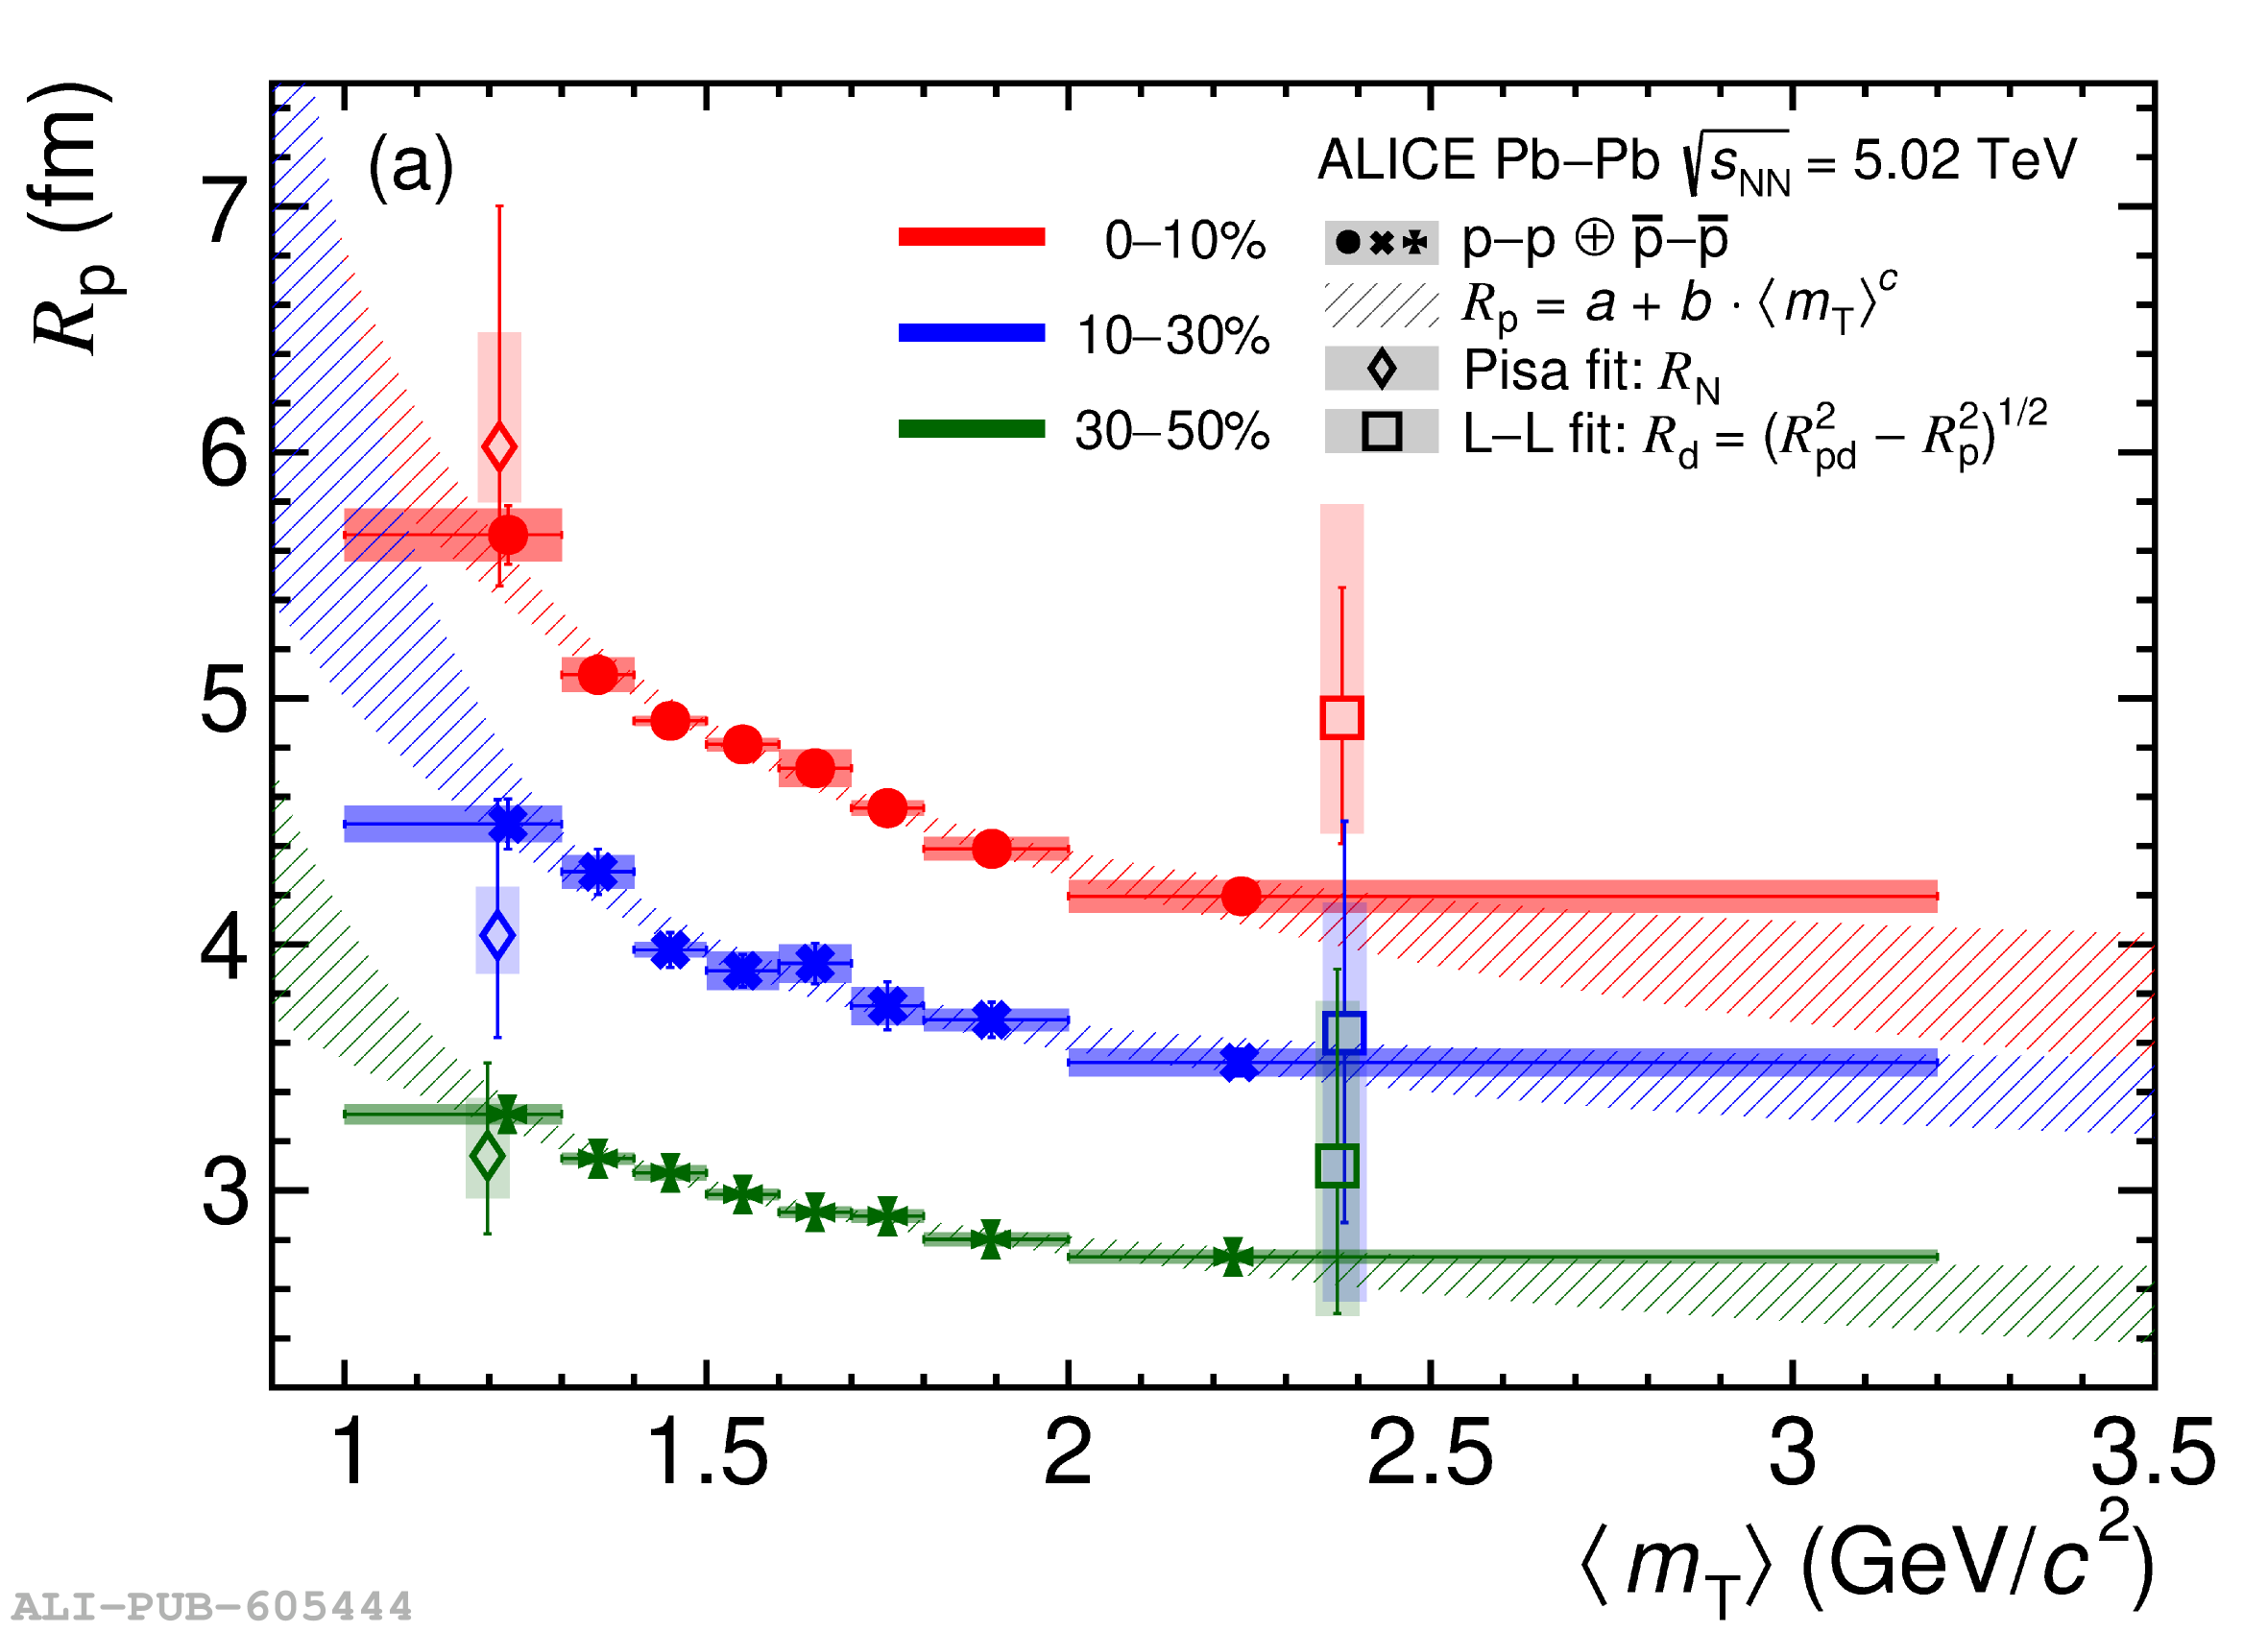 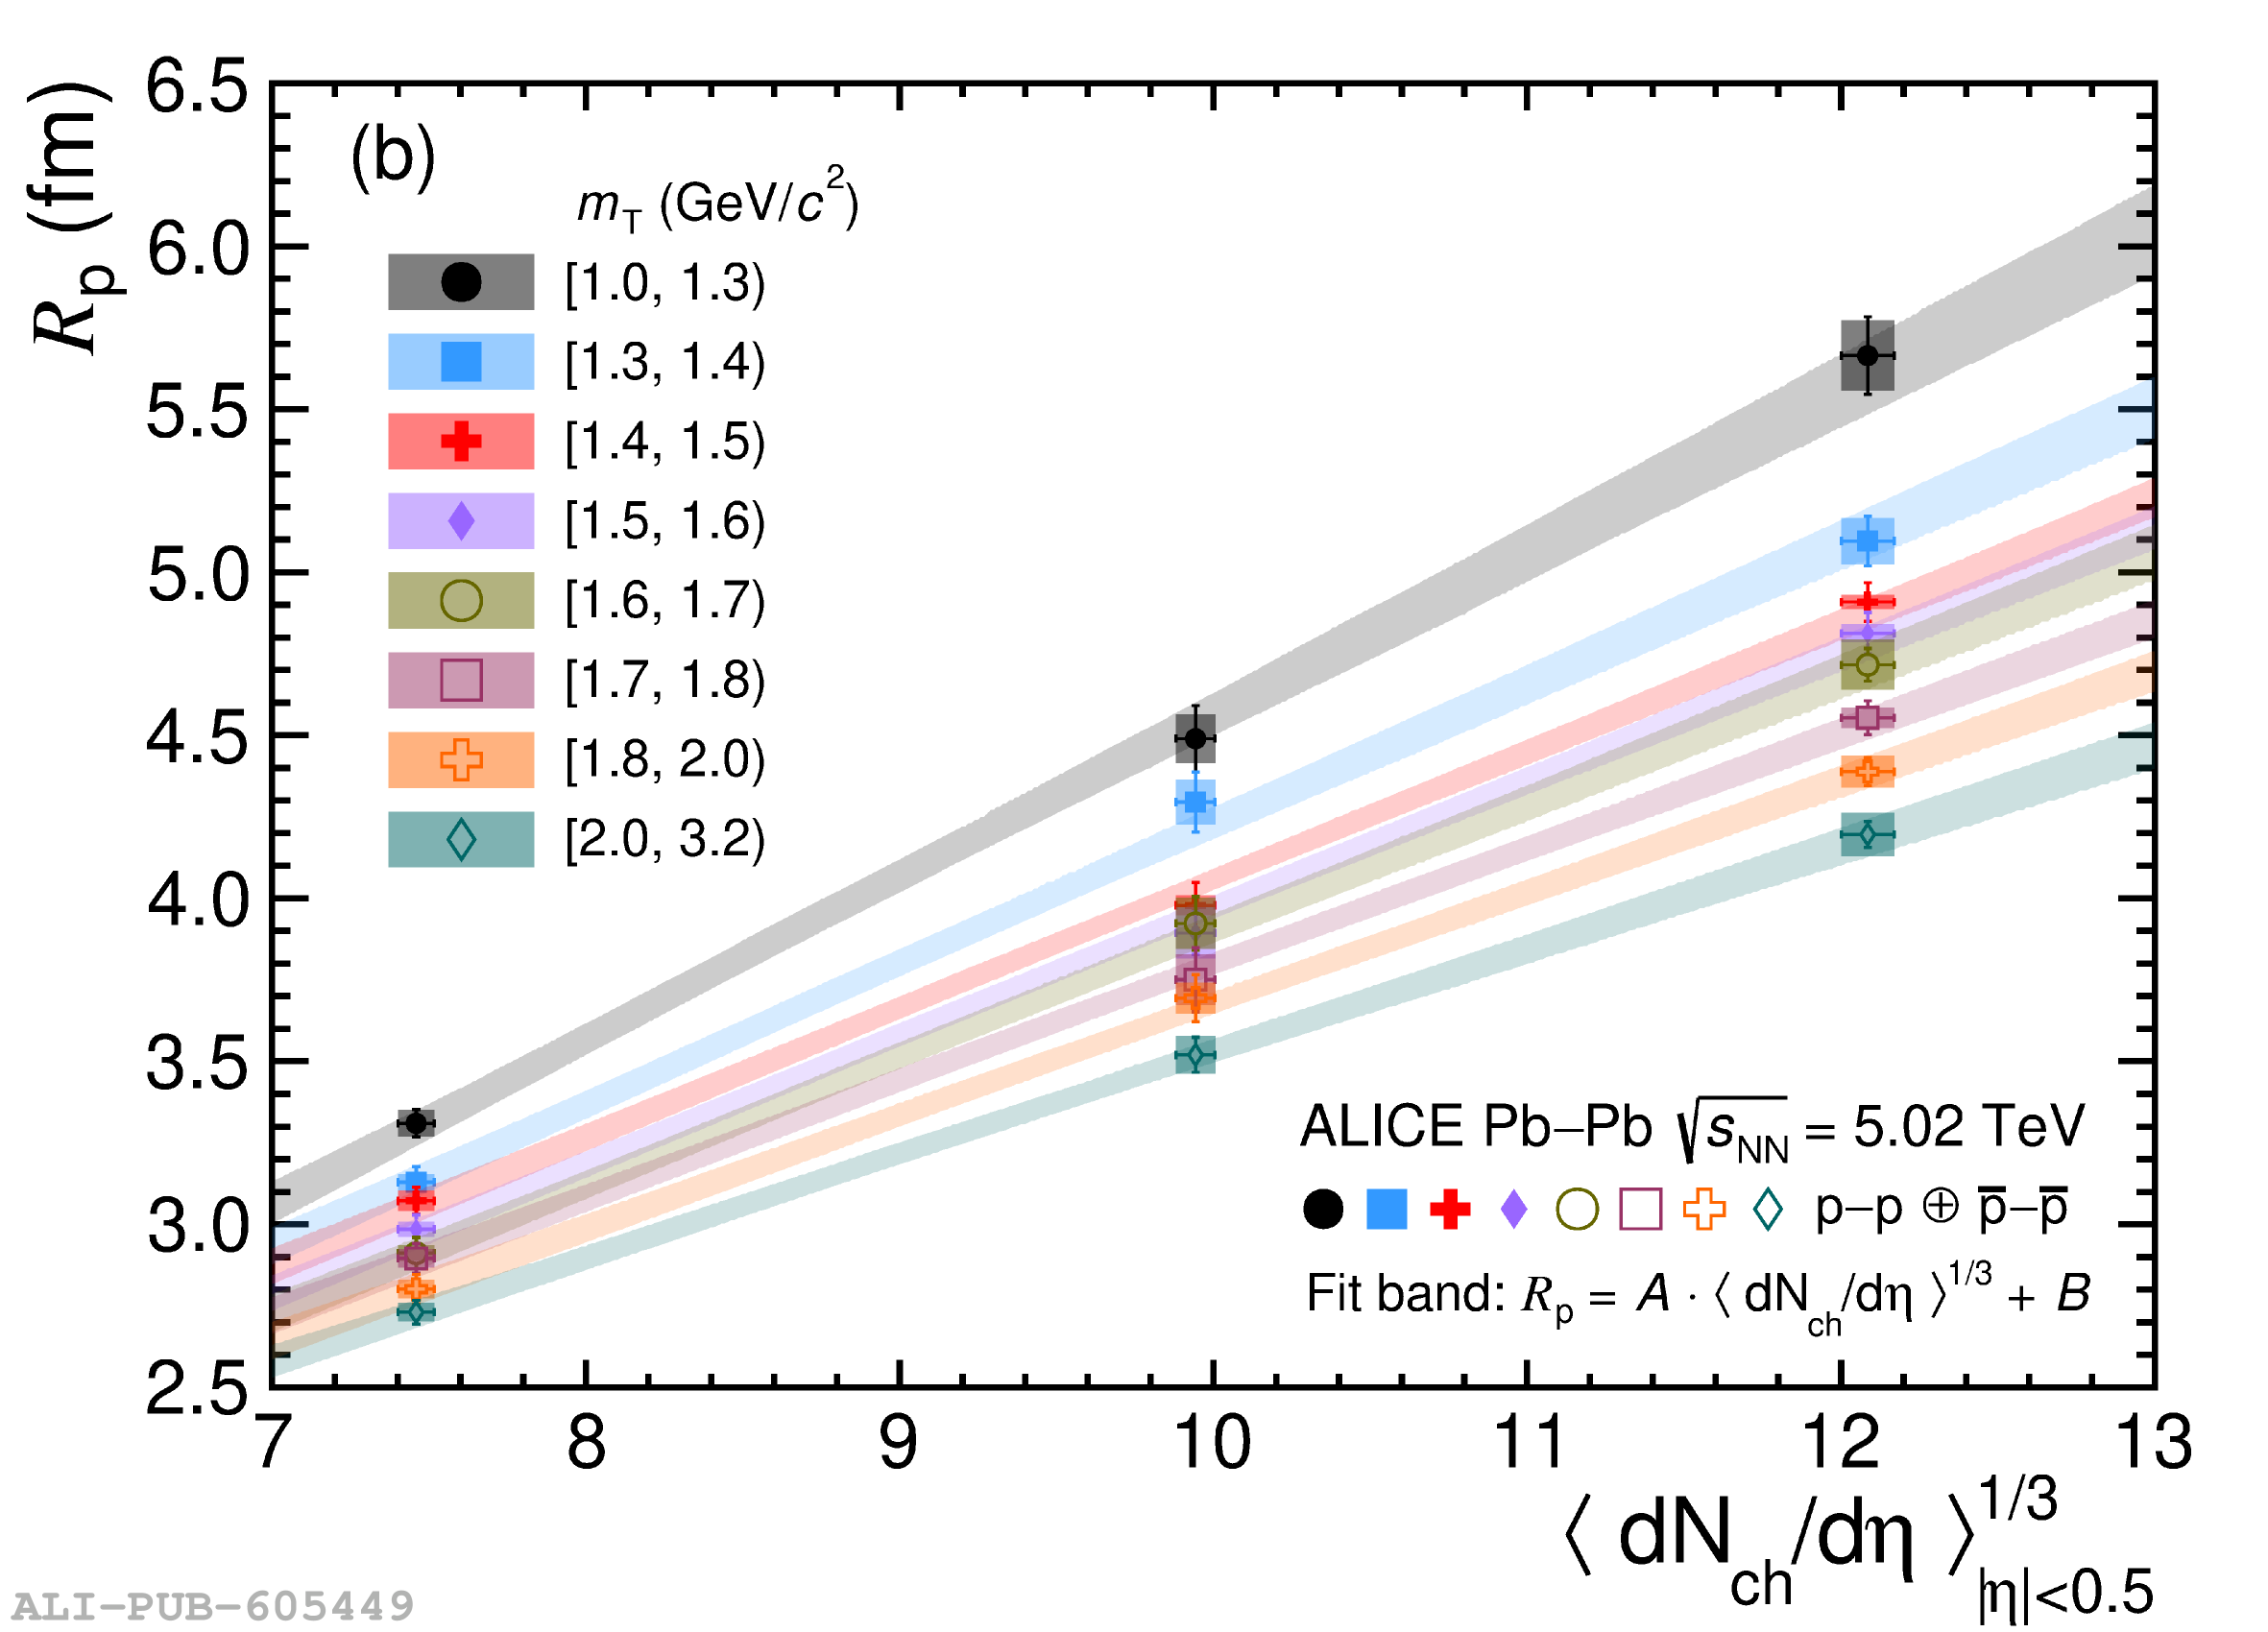 |