Top panels: raw p-p correlation functions as a function of $k^{*}$ in one exemplary $m_{\rm T}$ interval obtained from Pb--Pb collisions at $\sqrt{s_{\rm NN}} = $ 5.02 TeV in the 0--10$\%$ (a), 10--30$\%$ (b) and 30--50$\%$ (c) centrality intervals, respectively. The black open markers represent the data, while the vertical lines and the boxes indicate the statistical and systematic uncertainties, respectively. The red region represents the 1$\sigma$ uncertainty range of the fits performed using CATS. The non-femtoscopic background contributions are shown by the light cyan bands. Bottom panels: $n_{\sigma}$ calculated as data-to-fit difference, normalized by the total uncertainty of experimental data. | 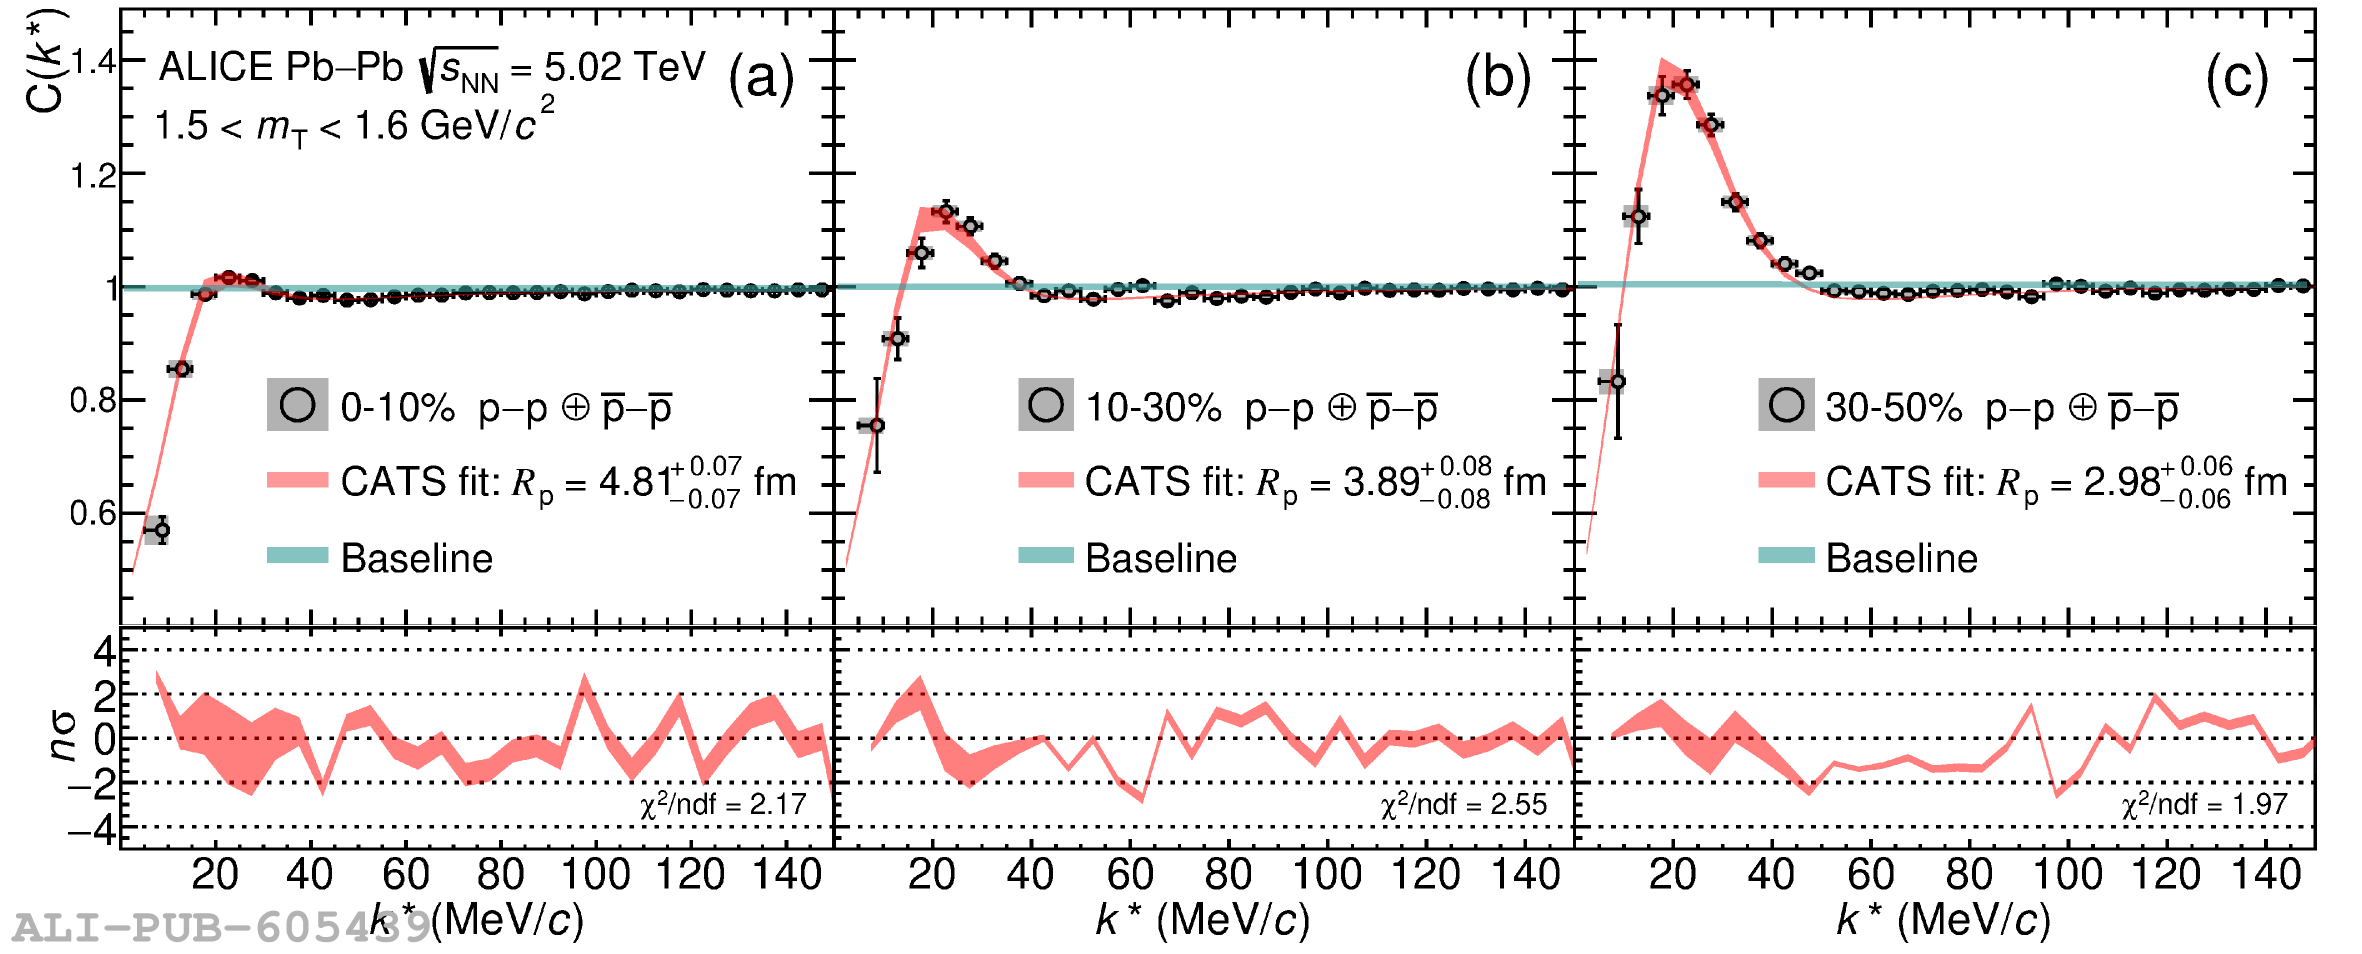 |