The interaction between pions and nucleons plays a crucial role in hadron physics. It represents a fundamental building block of the low-energy QCD dynamics and is subject to several resonance excitations. This work studies the p-$π^{\pm}$ dynamics using femtoscopic correlations in high-multiplicity pp collisions at $\sqrt{s} = 13$ TeV measured by ALICE at the LHC. As the final-state interaction between protons and pions is well constrained by scattering experiments and the study of pionic hydrogen, the results give access to information on the particle-emitting source in pp collisions using the femtoscopy methods. The scaling of the source size of primordial protons and pions against their pair transverse mass is extracted. The results are compared with the source sizes studied with p$-$p, $\text{p--K}^+$, and $π^{\pm}$-$π^{\pm}$ pairs by ALICE in the same collision system and are found to be in agreement for the different particle pairs. This reinforces recent findings by ALICE of a common emission source for all hadron-pairs in pp collisions at LHC energies. Furthermore, the p-p-$π^{\pm}$ systems are studied using three-particle femtoscopy in pp collisions at $\sqrt{s} = 13$ TeV. The presence of three-body effects is analyzed utilizing the cumulant expansion method. In this formalism, the known two-body interactions are subtracted in order to isolate the three-body effects. For both, p-p-$π^{+}$ and p-p-$π^{-}$, a non-zero cumulant is found, indicating effects beyond pairwise interactions. These results give information on the coupling of the pion to multiple nucleons.
Eur. Phys. J. A 61, 194 (2025)
HEP Data
e-Print: arXiv:2502.20200 | PDF | inSPIRE
CERN-EP-2025-034
Figure group
Figure 1
Upper panel: The experimental correlation function of p$\pi^+$ pairs (black) as a function of the pair relative momentum $k^*$ in several intervals of the pair $m_{\rm T}$: (a) $[0.54, 0.75)$ GeV/$c^2$, (b) $[0.75, 0.95)$ GeV/$c^2$, (c) $[0.95, 1.2)$ GeV/$c^2$, (d) $[1.2, 1.5)$ GeV/$c^2$, (e) $[1.5, 2.0)$ GeV/$c^2$, and (f) $[2.0, 2.5)$ GeV/$c^2$. The lines (boxes) show the statistical (systematic) uncertainties of the experimental data. The red bands show the fit result according to Eq.6. The single contributions of correlated background (green), final-state interaction (blue), and $\Delta^{++}(1232)$ (yellow) are presented by the respective colored bands. The width of the bands represents the uncertainty from the fitting procedure. Lower panel: point-by-point $n_\sigma$ between the overall fit and the experimental data. | 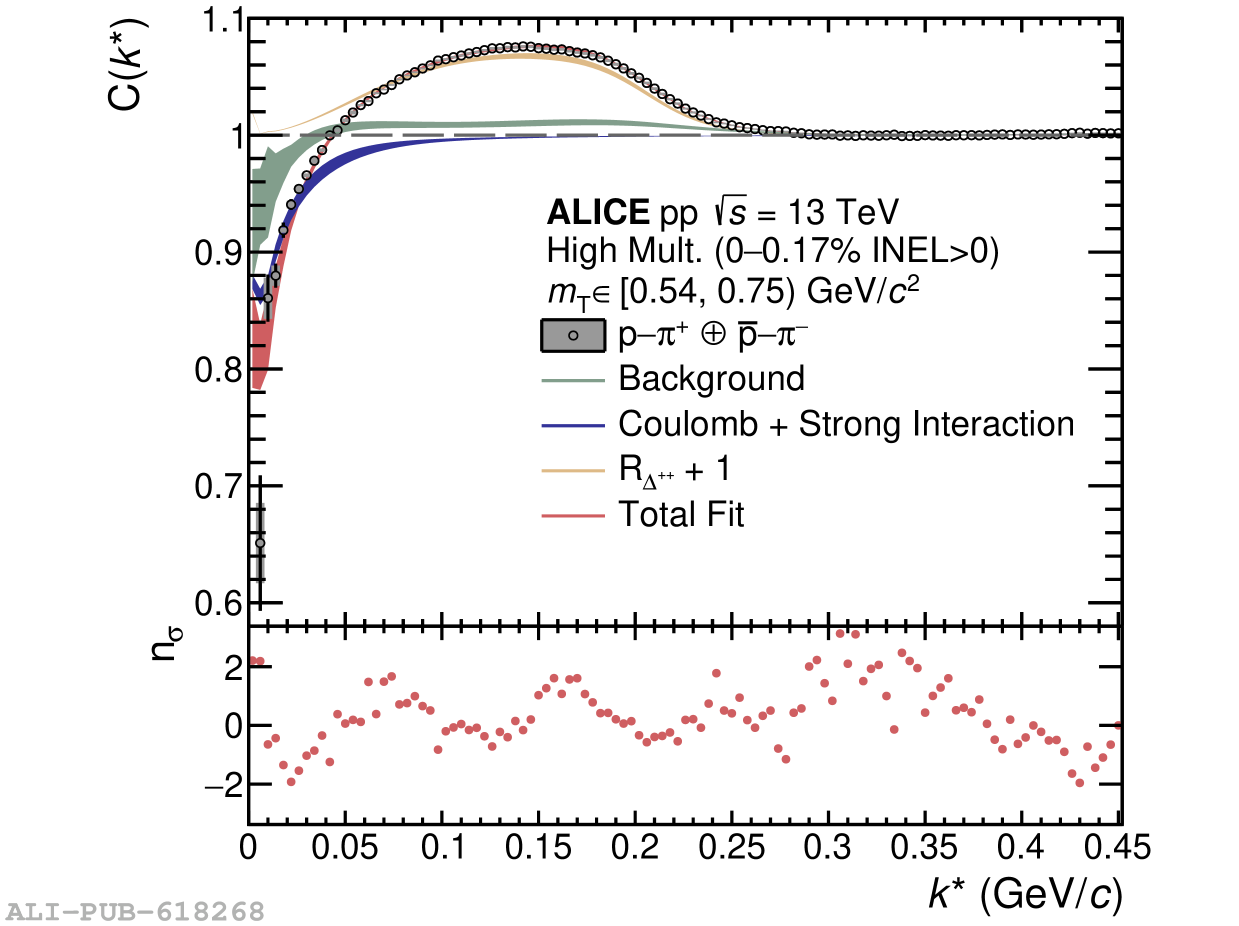 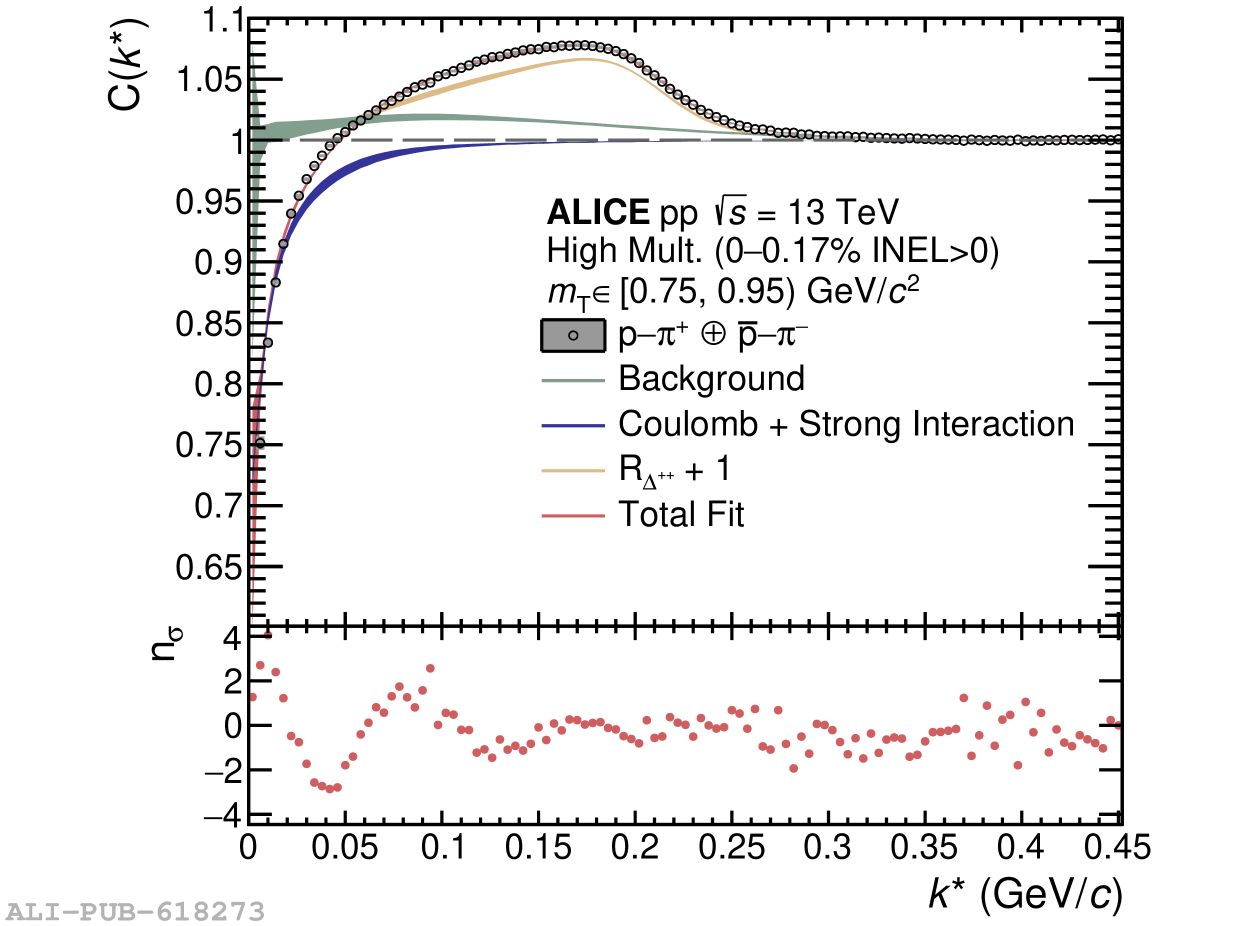 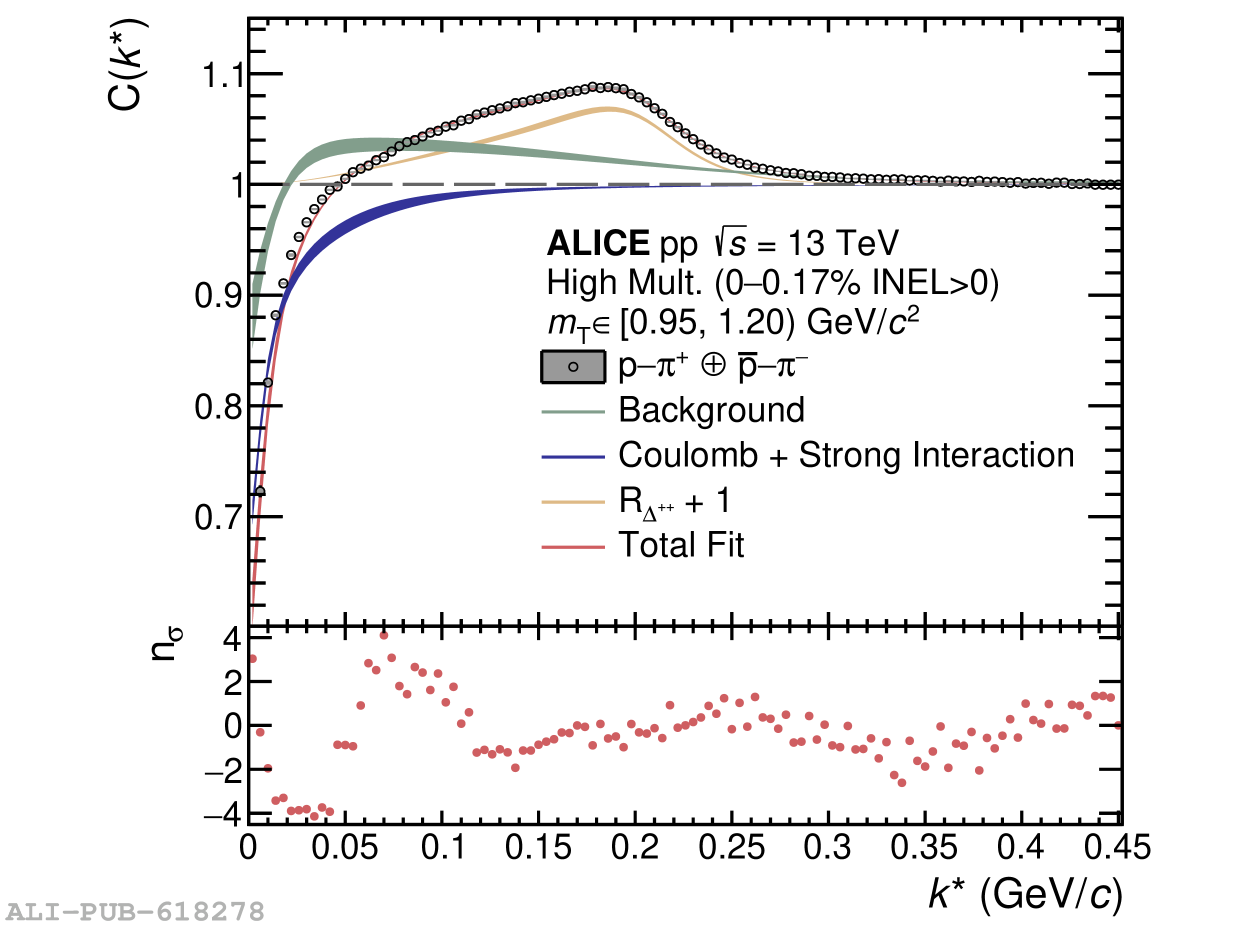 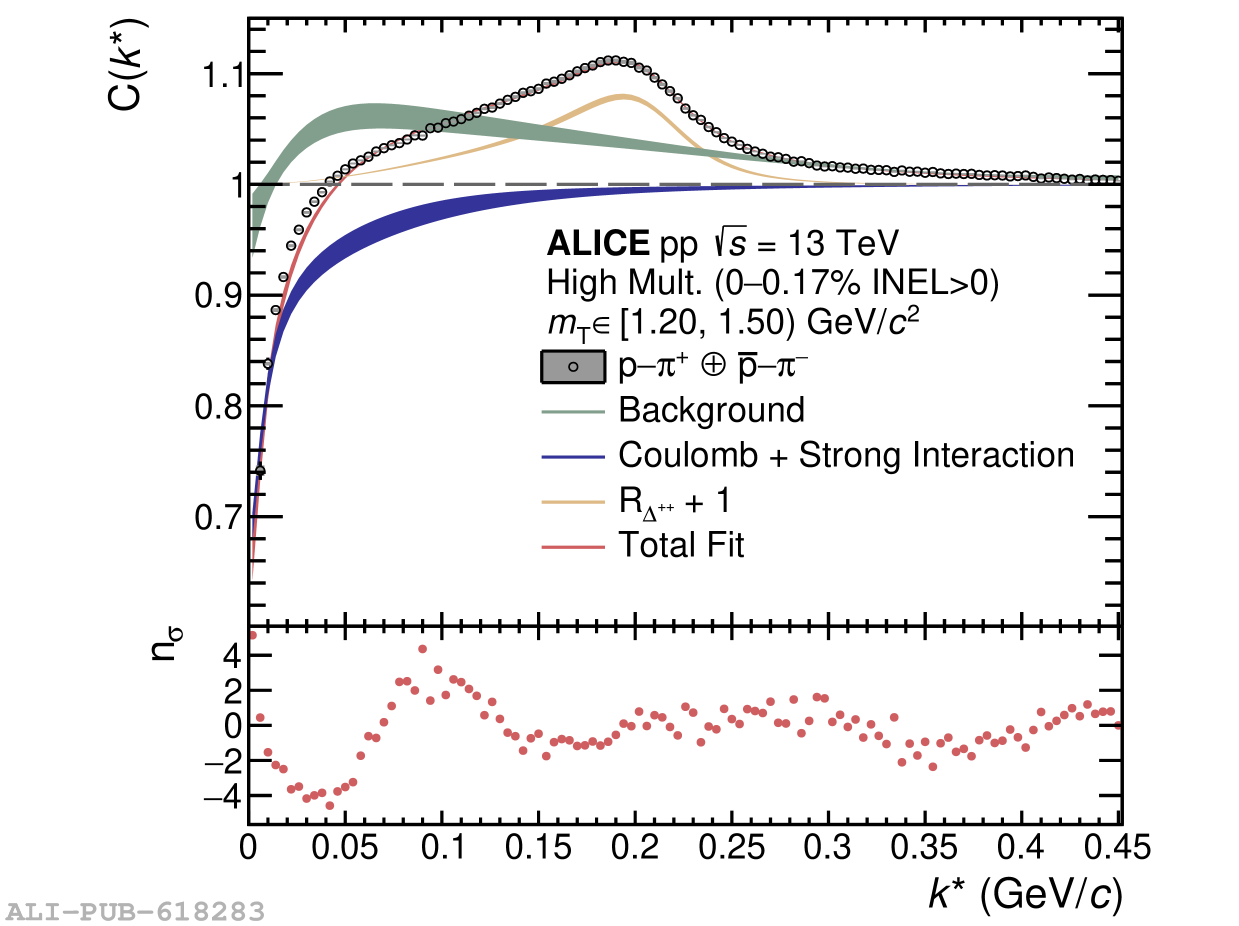 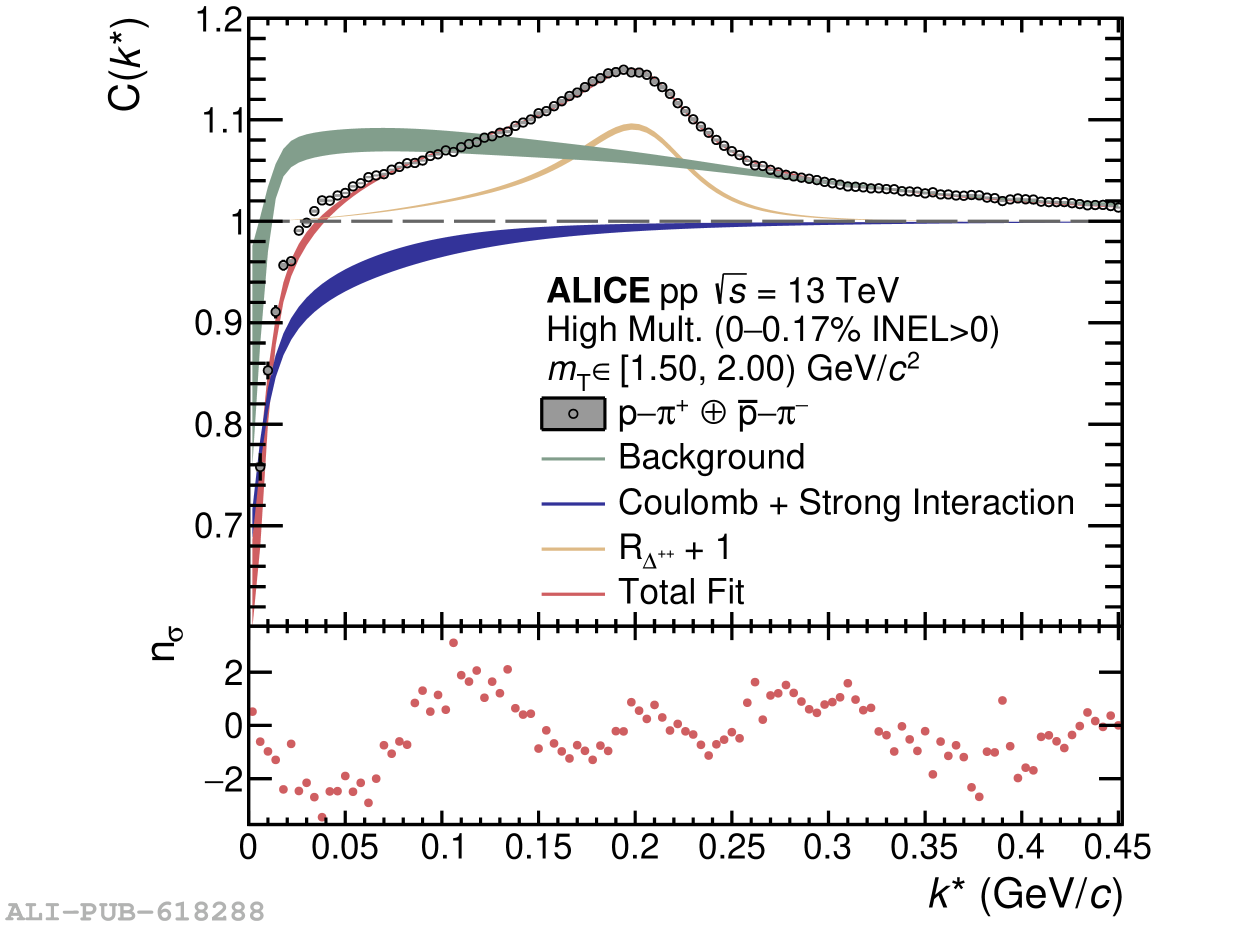 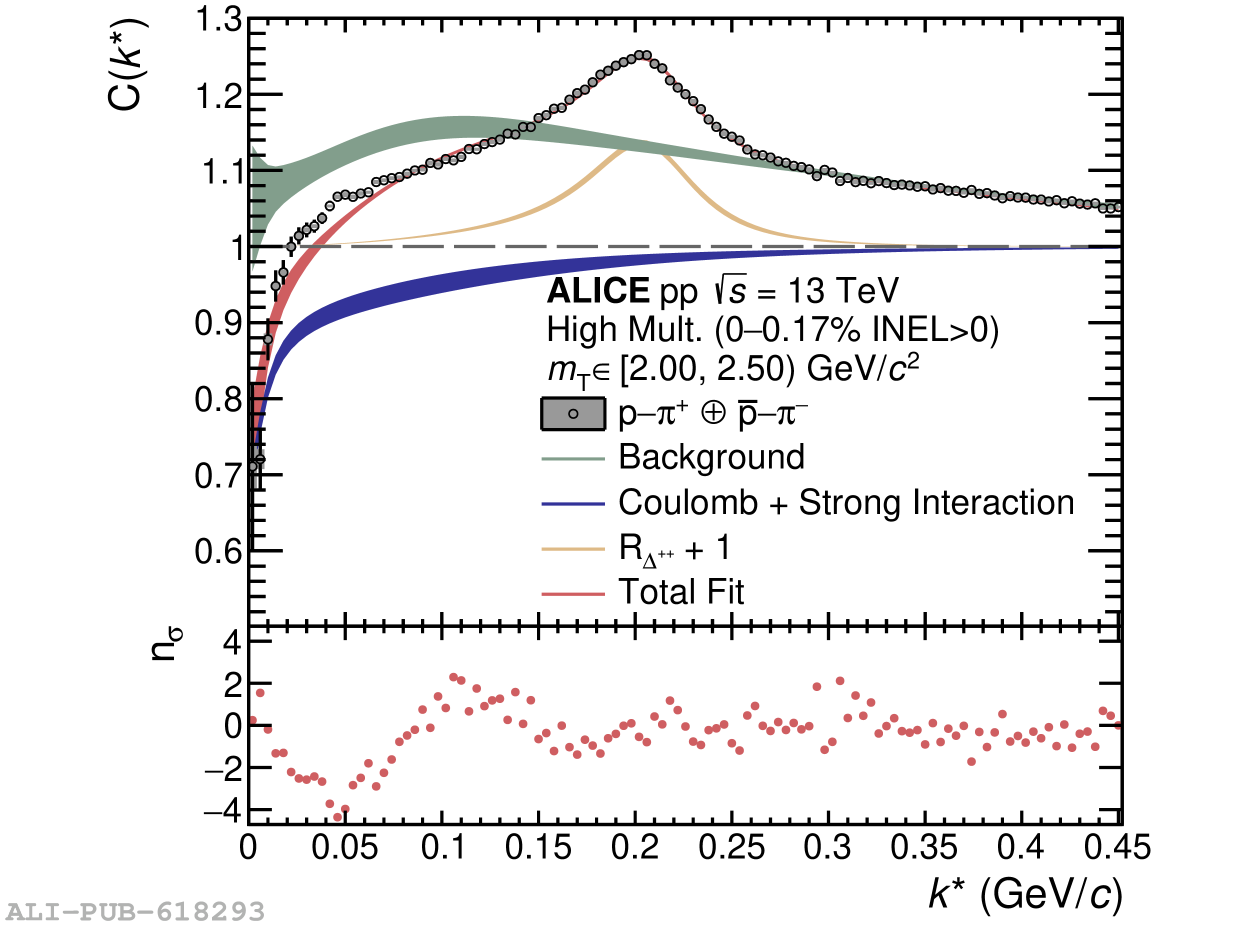 |


Figure 3
Extracted source size $r_\text{core}$ of primordial p$-\pi^+$ pairs as a function of the pair transverse mass. The results are compared with the $r_\text{core}$ extracted from p$-$p pairs as well as $\pi^\pm-\pi^\pm$ and $\text{p--}\text{K}^+$ pairs in HM pp collisions at $\sqrt{s}=13$TeV by ALICE. The lines (boxes) show the statistical (systematic) uncertainties. The gray band represents the extrapolated scaling of p$-$p pairs. |  |
Figure 4
Upper panel: The p$-\pi^-$ experimental correlation function is shown in black as a function of the pair relative momentum $k^*$ for several intervals of the pair $m_{\rm T}$: (a) $[0.54, 0.75)$ GeV/$c^2$, (b) $[0.75, 0.95)$ GeV/$c^2$, (c) $[0.95, 1.2)$ GeV/$c^2$, (d) $[1.2, 1.5)$ GeV/$c^2$, (e) $[1.5, 2.0)$ GeV/$c^2$, and (f) $[2.0, 2.5)$ GeV$/c^2$. The lines and boxes show the statistical and systematic uncertainties of the experimental data, respectively. The fit results according to Eq.9 are depicted by the red bands. Contributions of correlated background, final-state interaction, and $\Delta^{0}(1232)$ are shown as the green, blue, and yellow bands, respectively. The width of the bands represents the uncertainty from the fitting procedure. Lower panel: point-by-point $n_\sigma$ between the overall fit and the experimental data. | 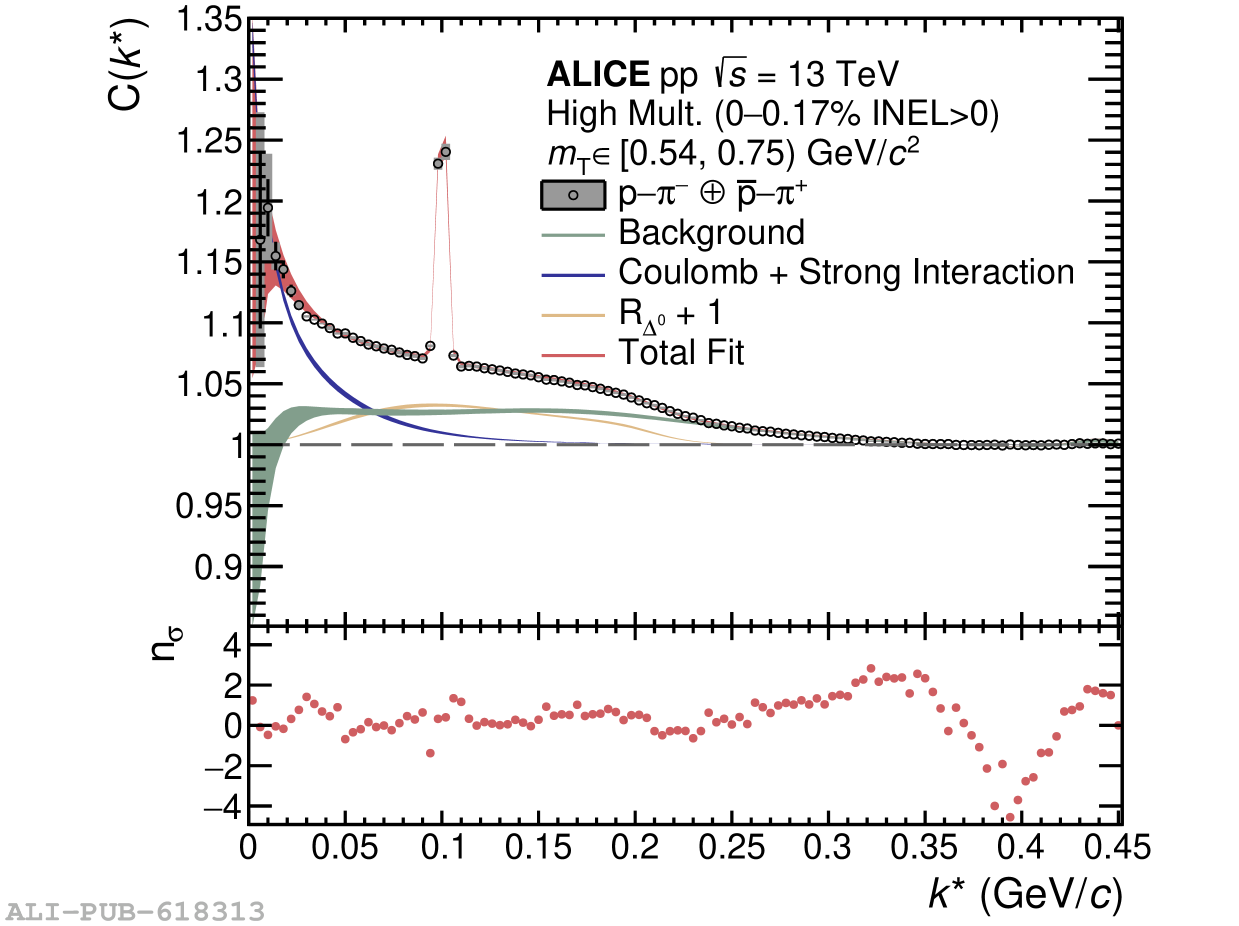 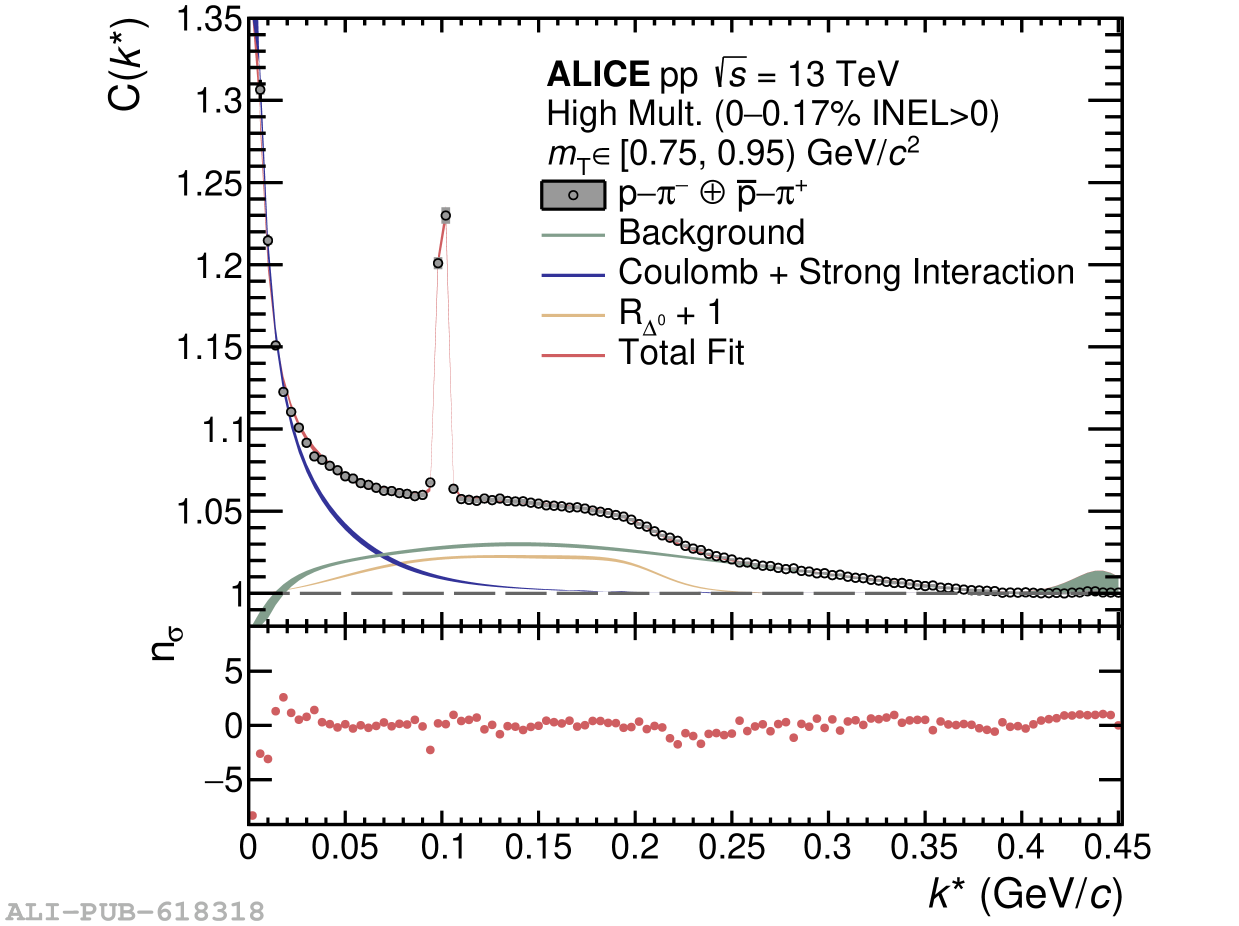 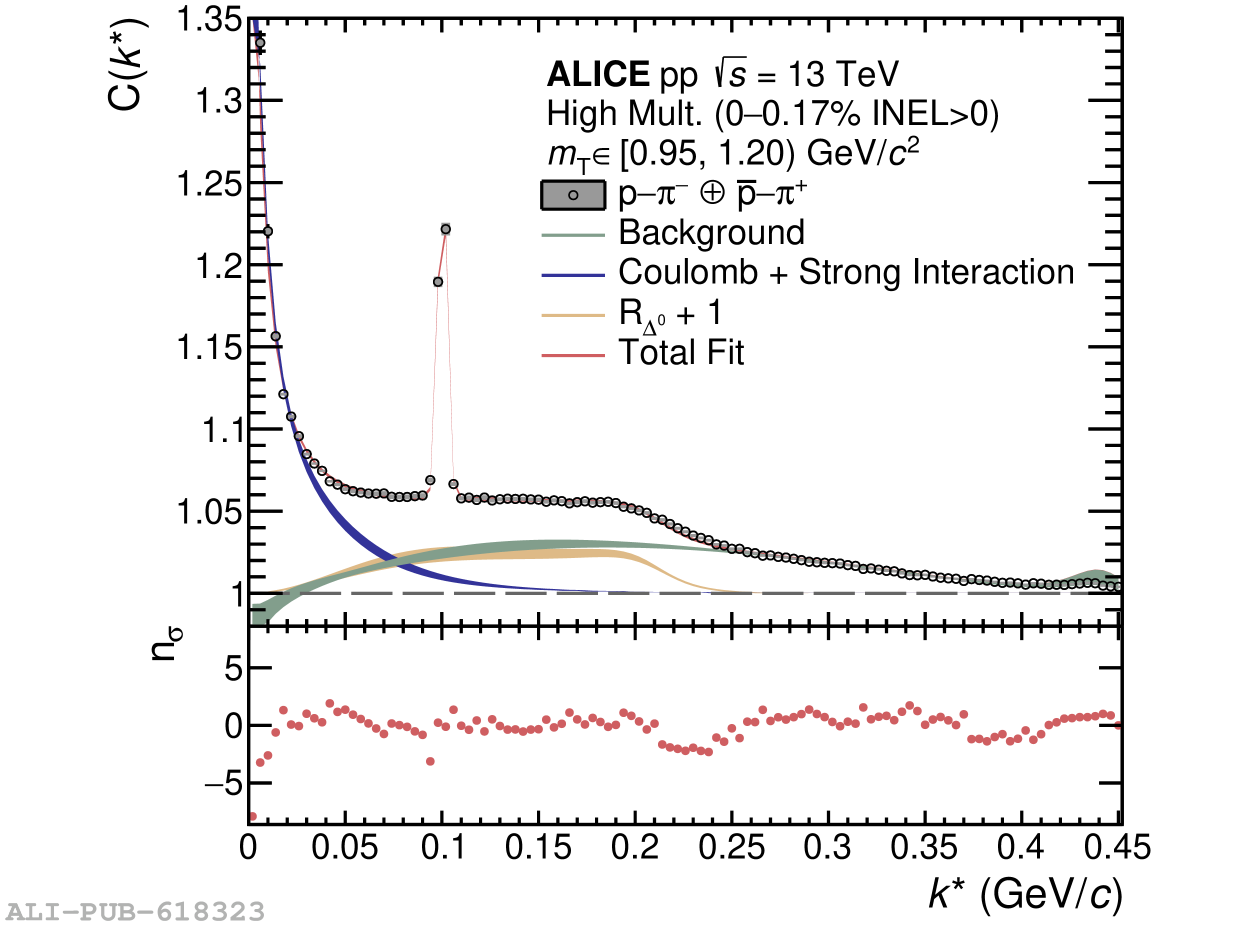 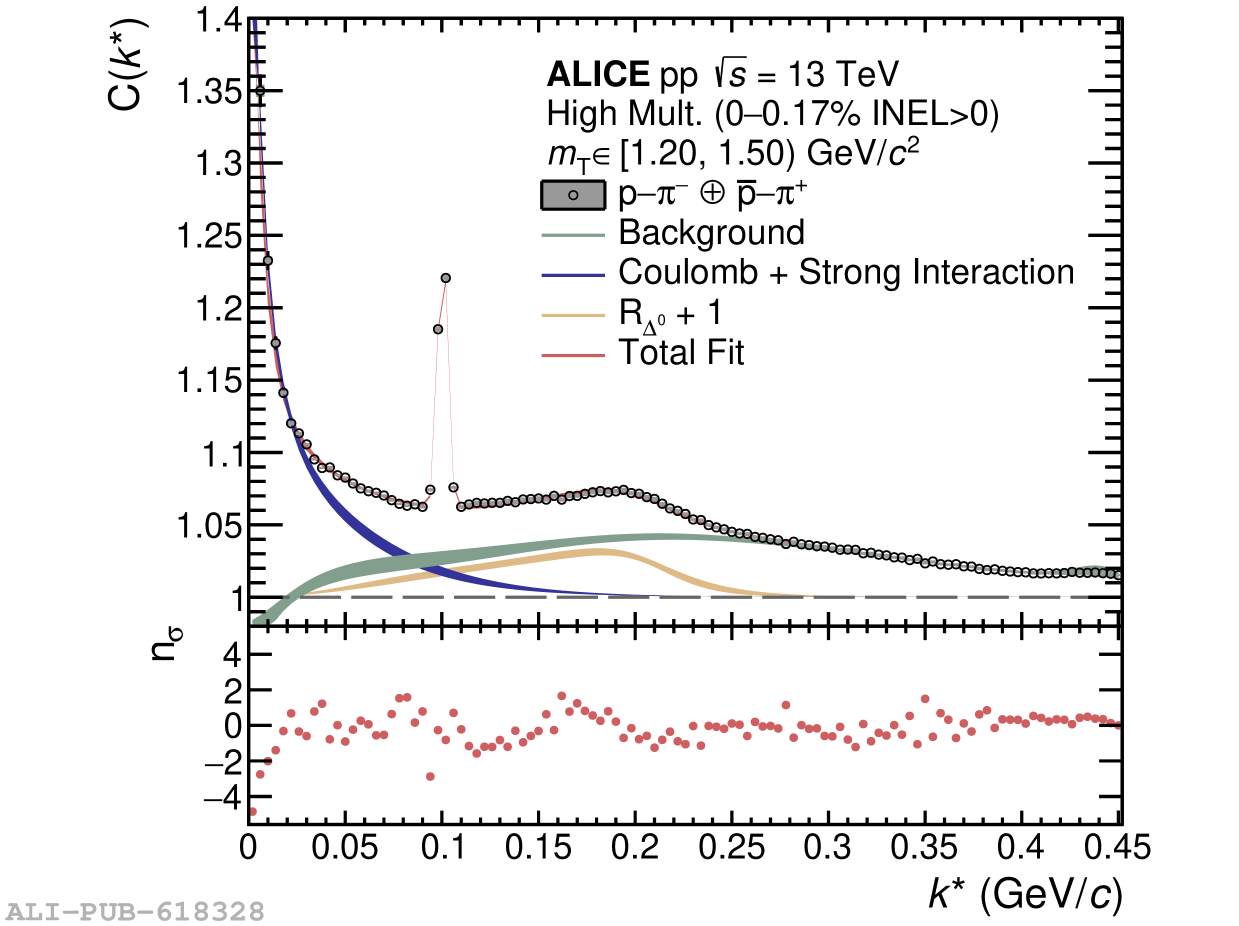 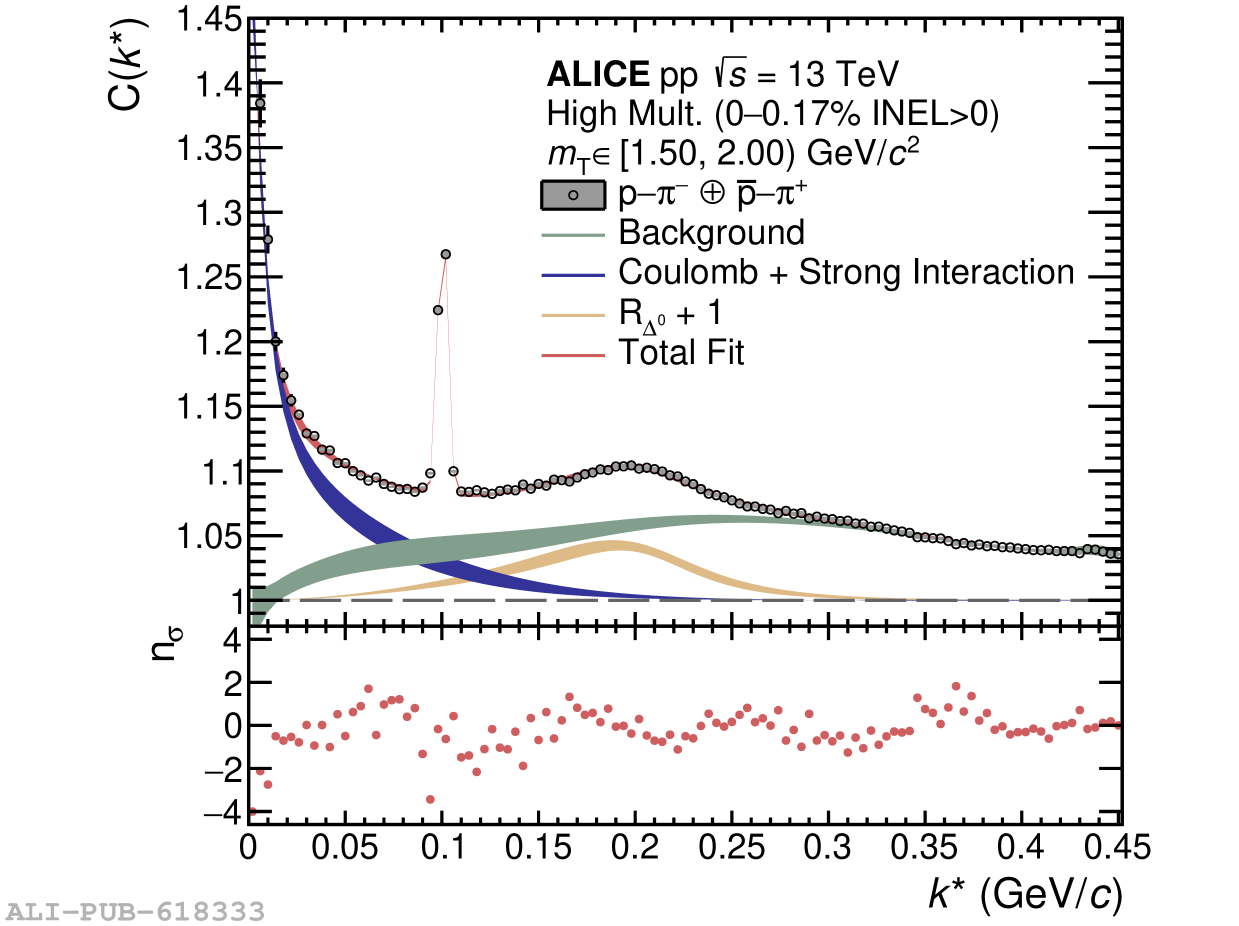 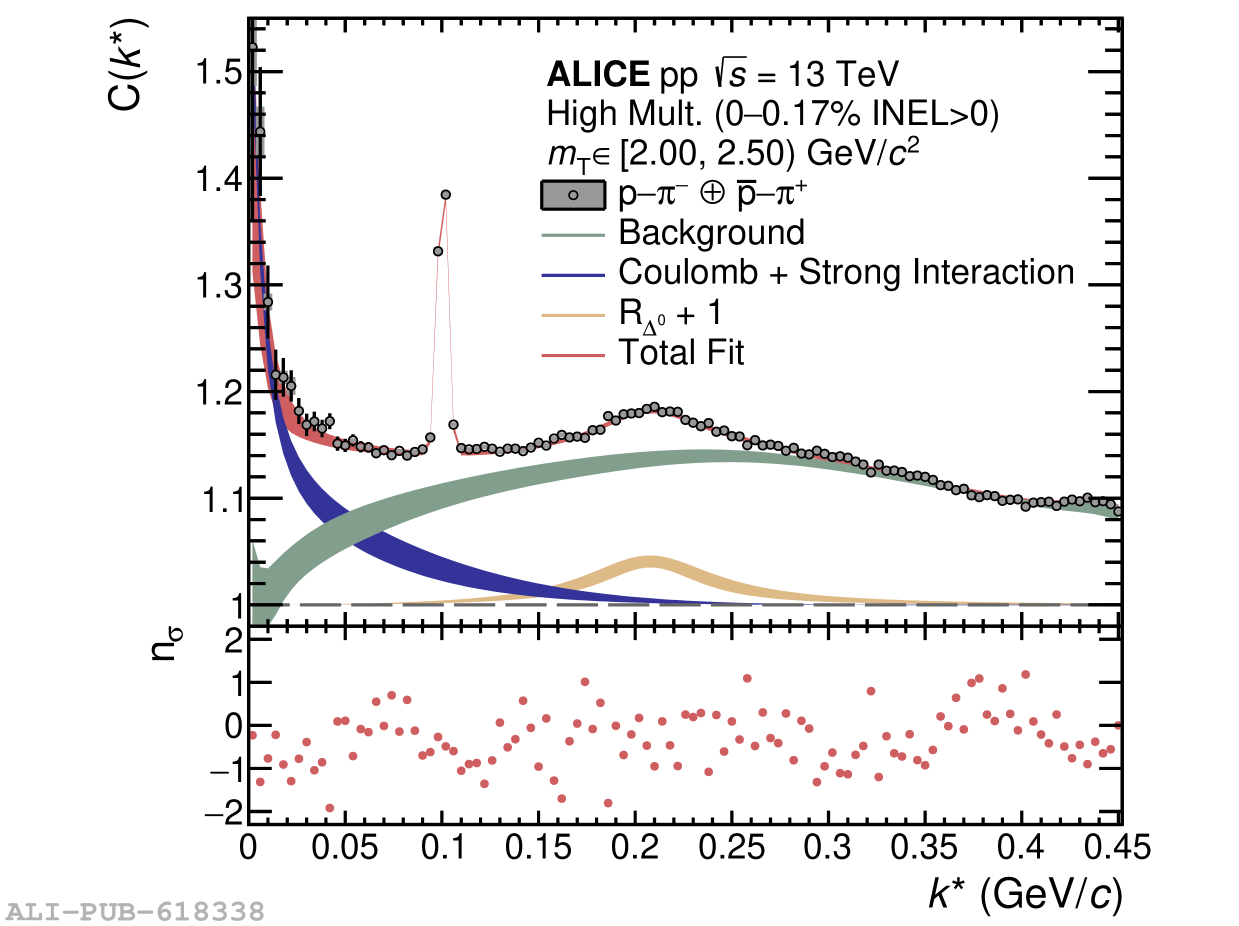 |
Figure 6
Extracted core source size $r_\text{core}$ for primordial p$-\pi^-$ pairs for several $m_{\rm T}$ ranges. The obtained result is compared with the results from p$-$p pairs, $\pi^\pm-\pi^\pm$ and $\text{p--}\text{K}^+$ pairs. The statistical (systematic) uncertainties are shown as lines (boxes). The extrapolated scaling of p--p pairs is shown as the gray band. | 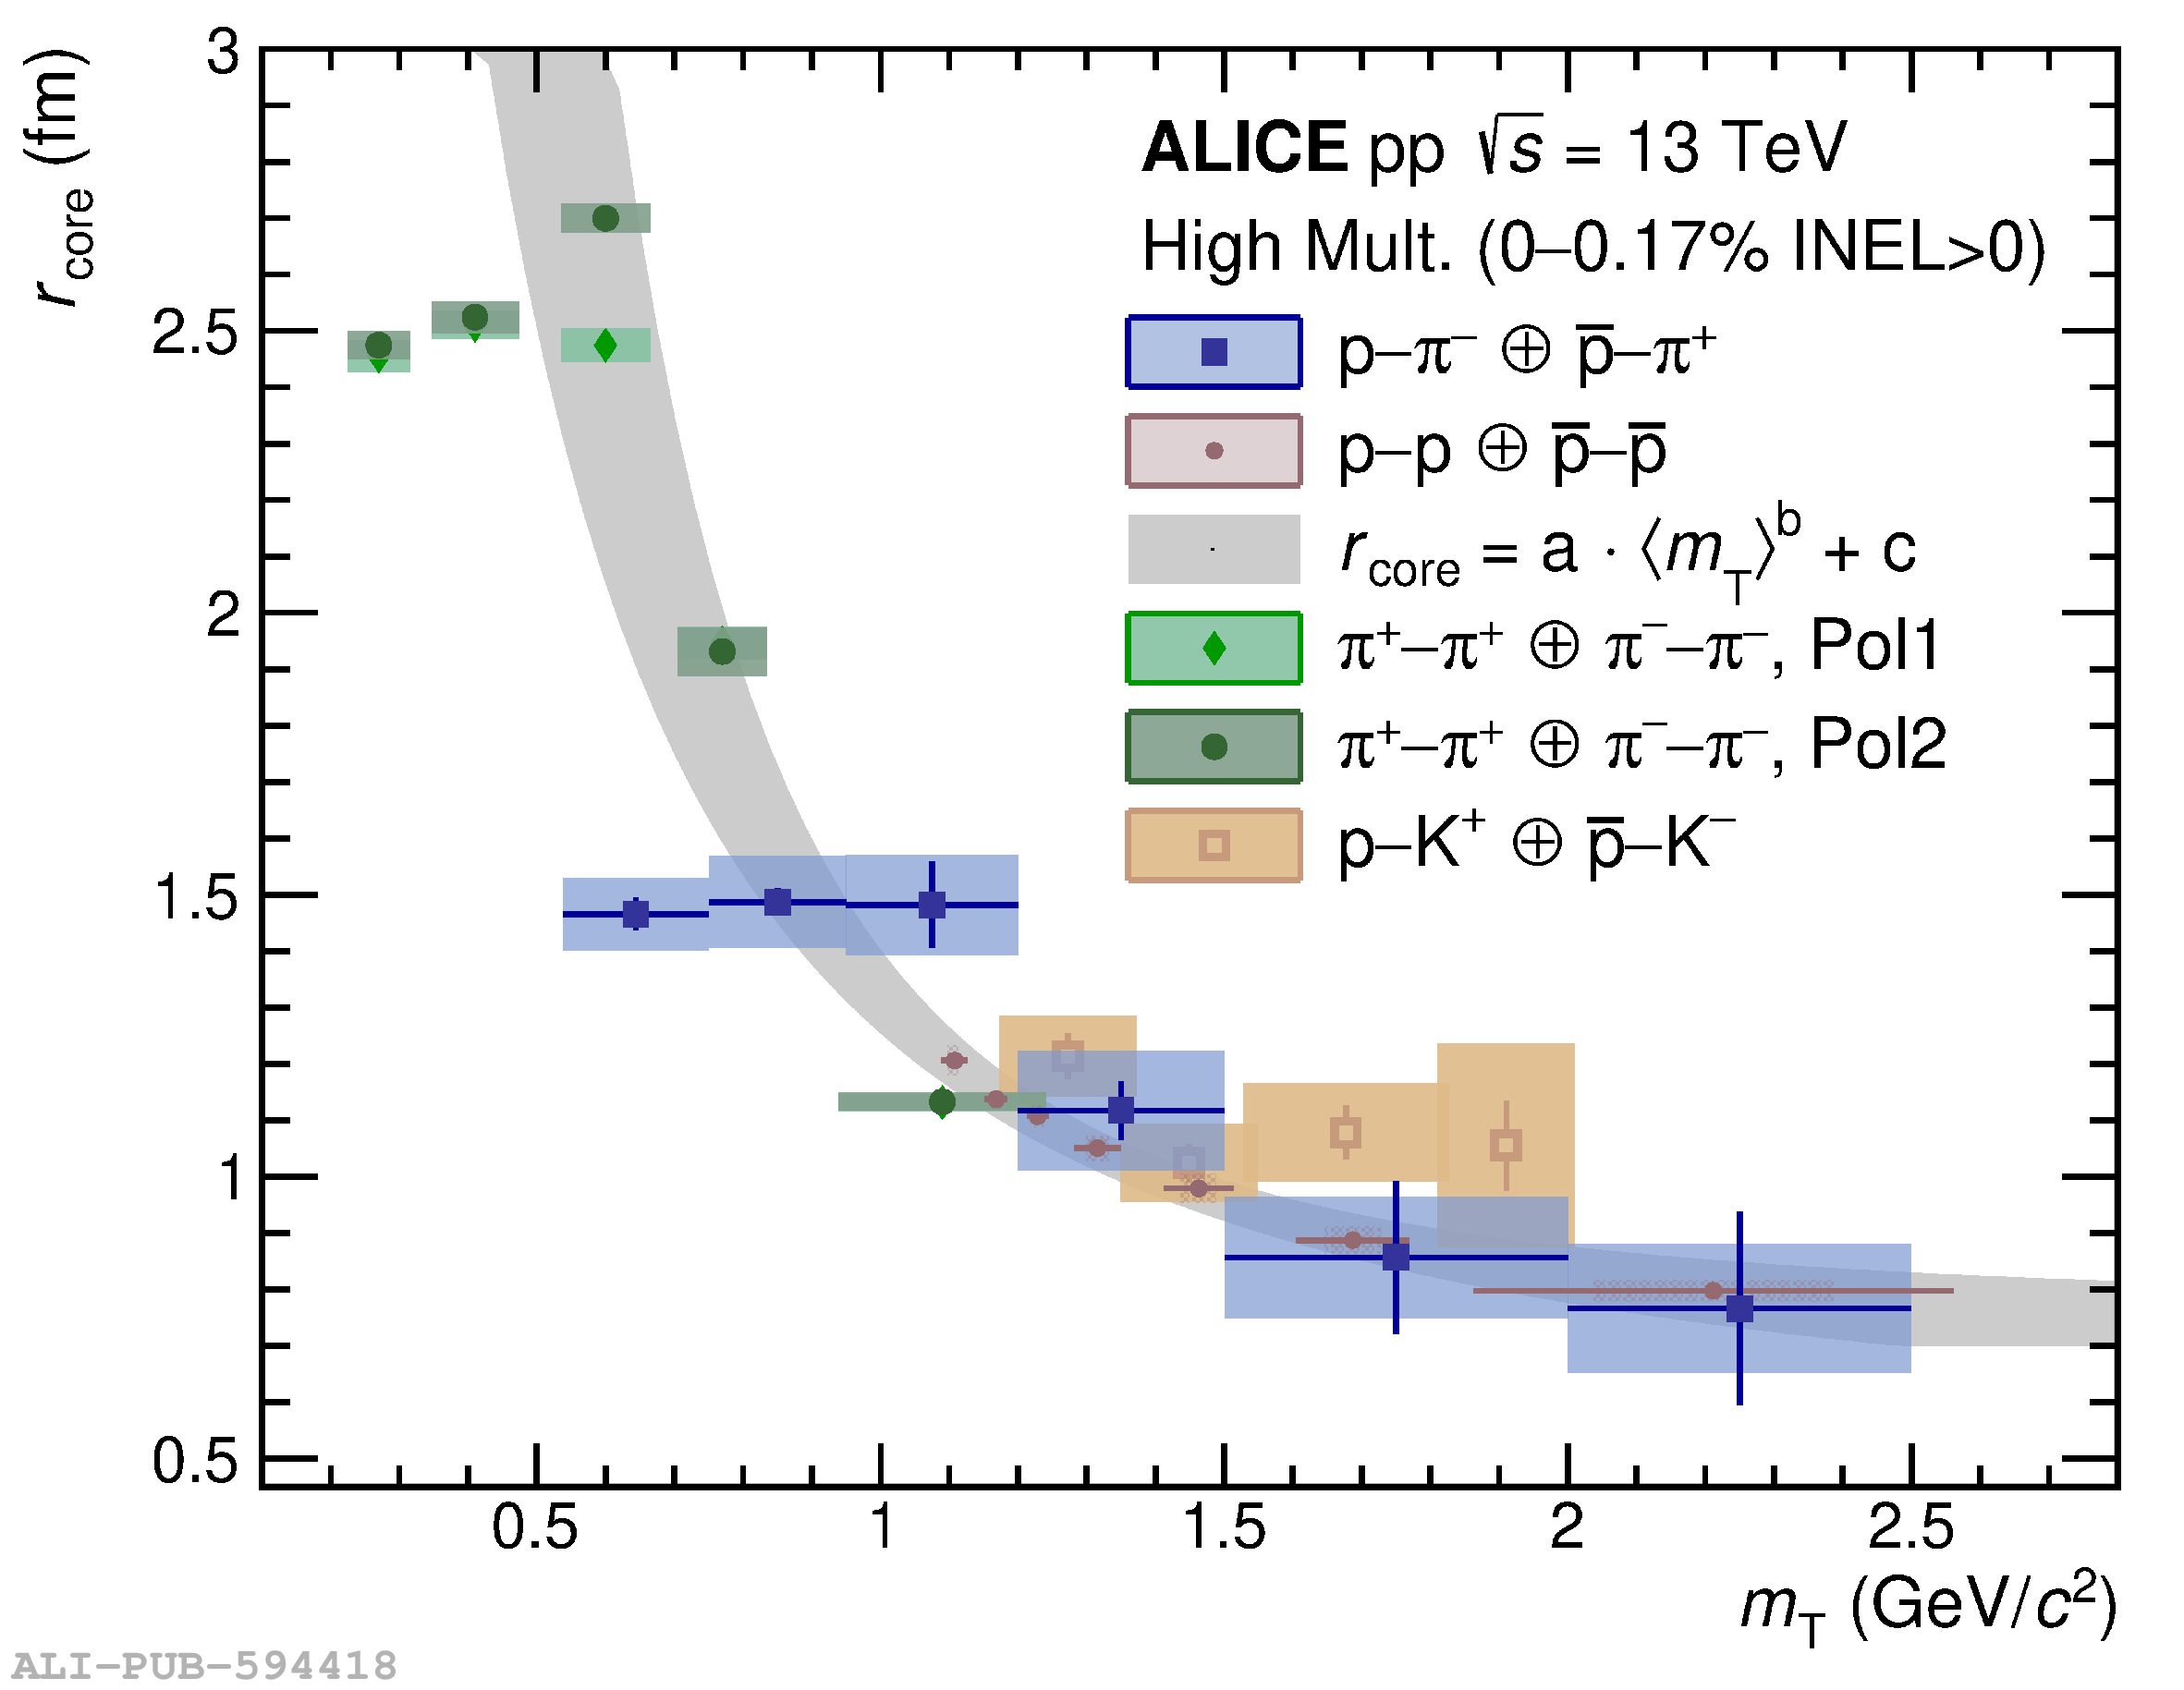 |
Figure 7
Lower-order contributions present in the p$-$p$-\pi^+$ systems. The contributions of (a) $(\text{p--p})\text{--}\pi^+$ and (b) $(\text{p--p})\text{--}\pi^-$, as well as (c) $(\text{p--}\pi^+)\text{--}\text{p}$ and (d) $(\text{p--}\pi^-)\text{--}\text{p}$ are shown. The statistical (systematic) uncertainties are represented by the lines (boxes). The horizontal lines show the overall bin width, while the respective position of the marker presents the average $Q_3$ within this bin obtained from the mixed event distribution $N_{\text{mixed}}(Q_3)$. |     |
Figure 8
Comparison of the three-particle correlation functions of (a) p$-\pi^+$ and (b) p$-\pi^-$ to their respective total lower-order contributions (grey). The statistical and systematic uncertainties are shown by the lines and boxes, respectively. The lower-order contribution is given by Eq.17. The horizontal lines represent the overall bin width, while the respective position of the marker show the average $Q_3$ within this bin. The latter is obtained from the mixed event distribution $N_{\text{mixed}}(Q_3)$. | 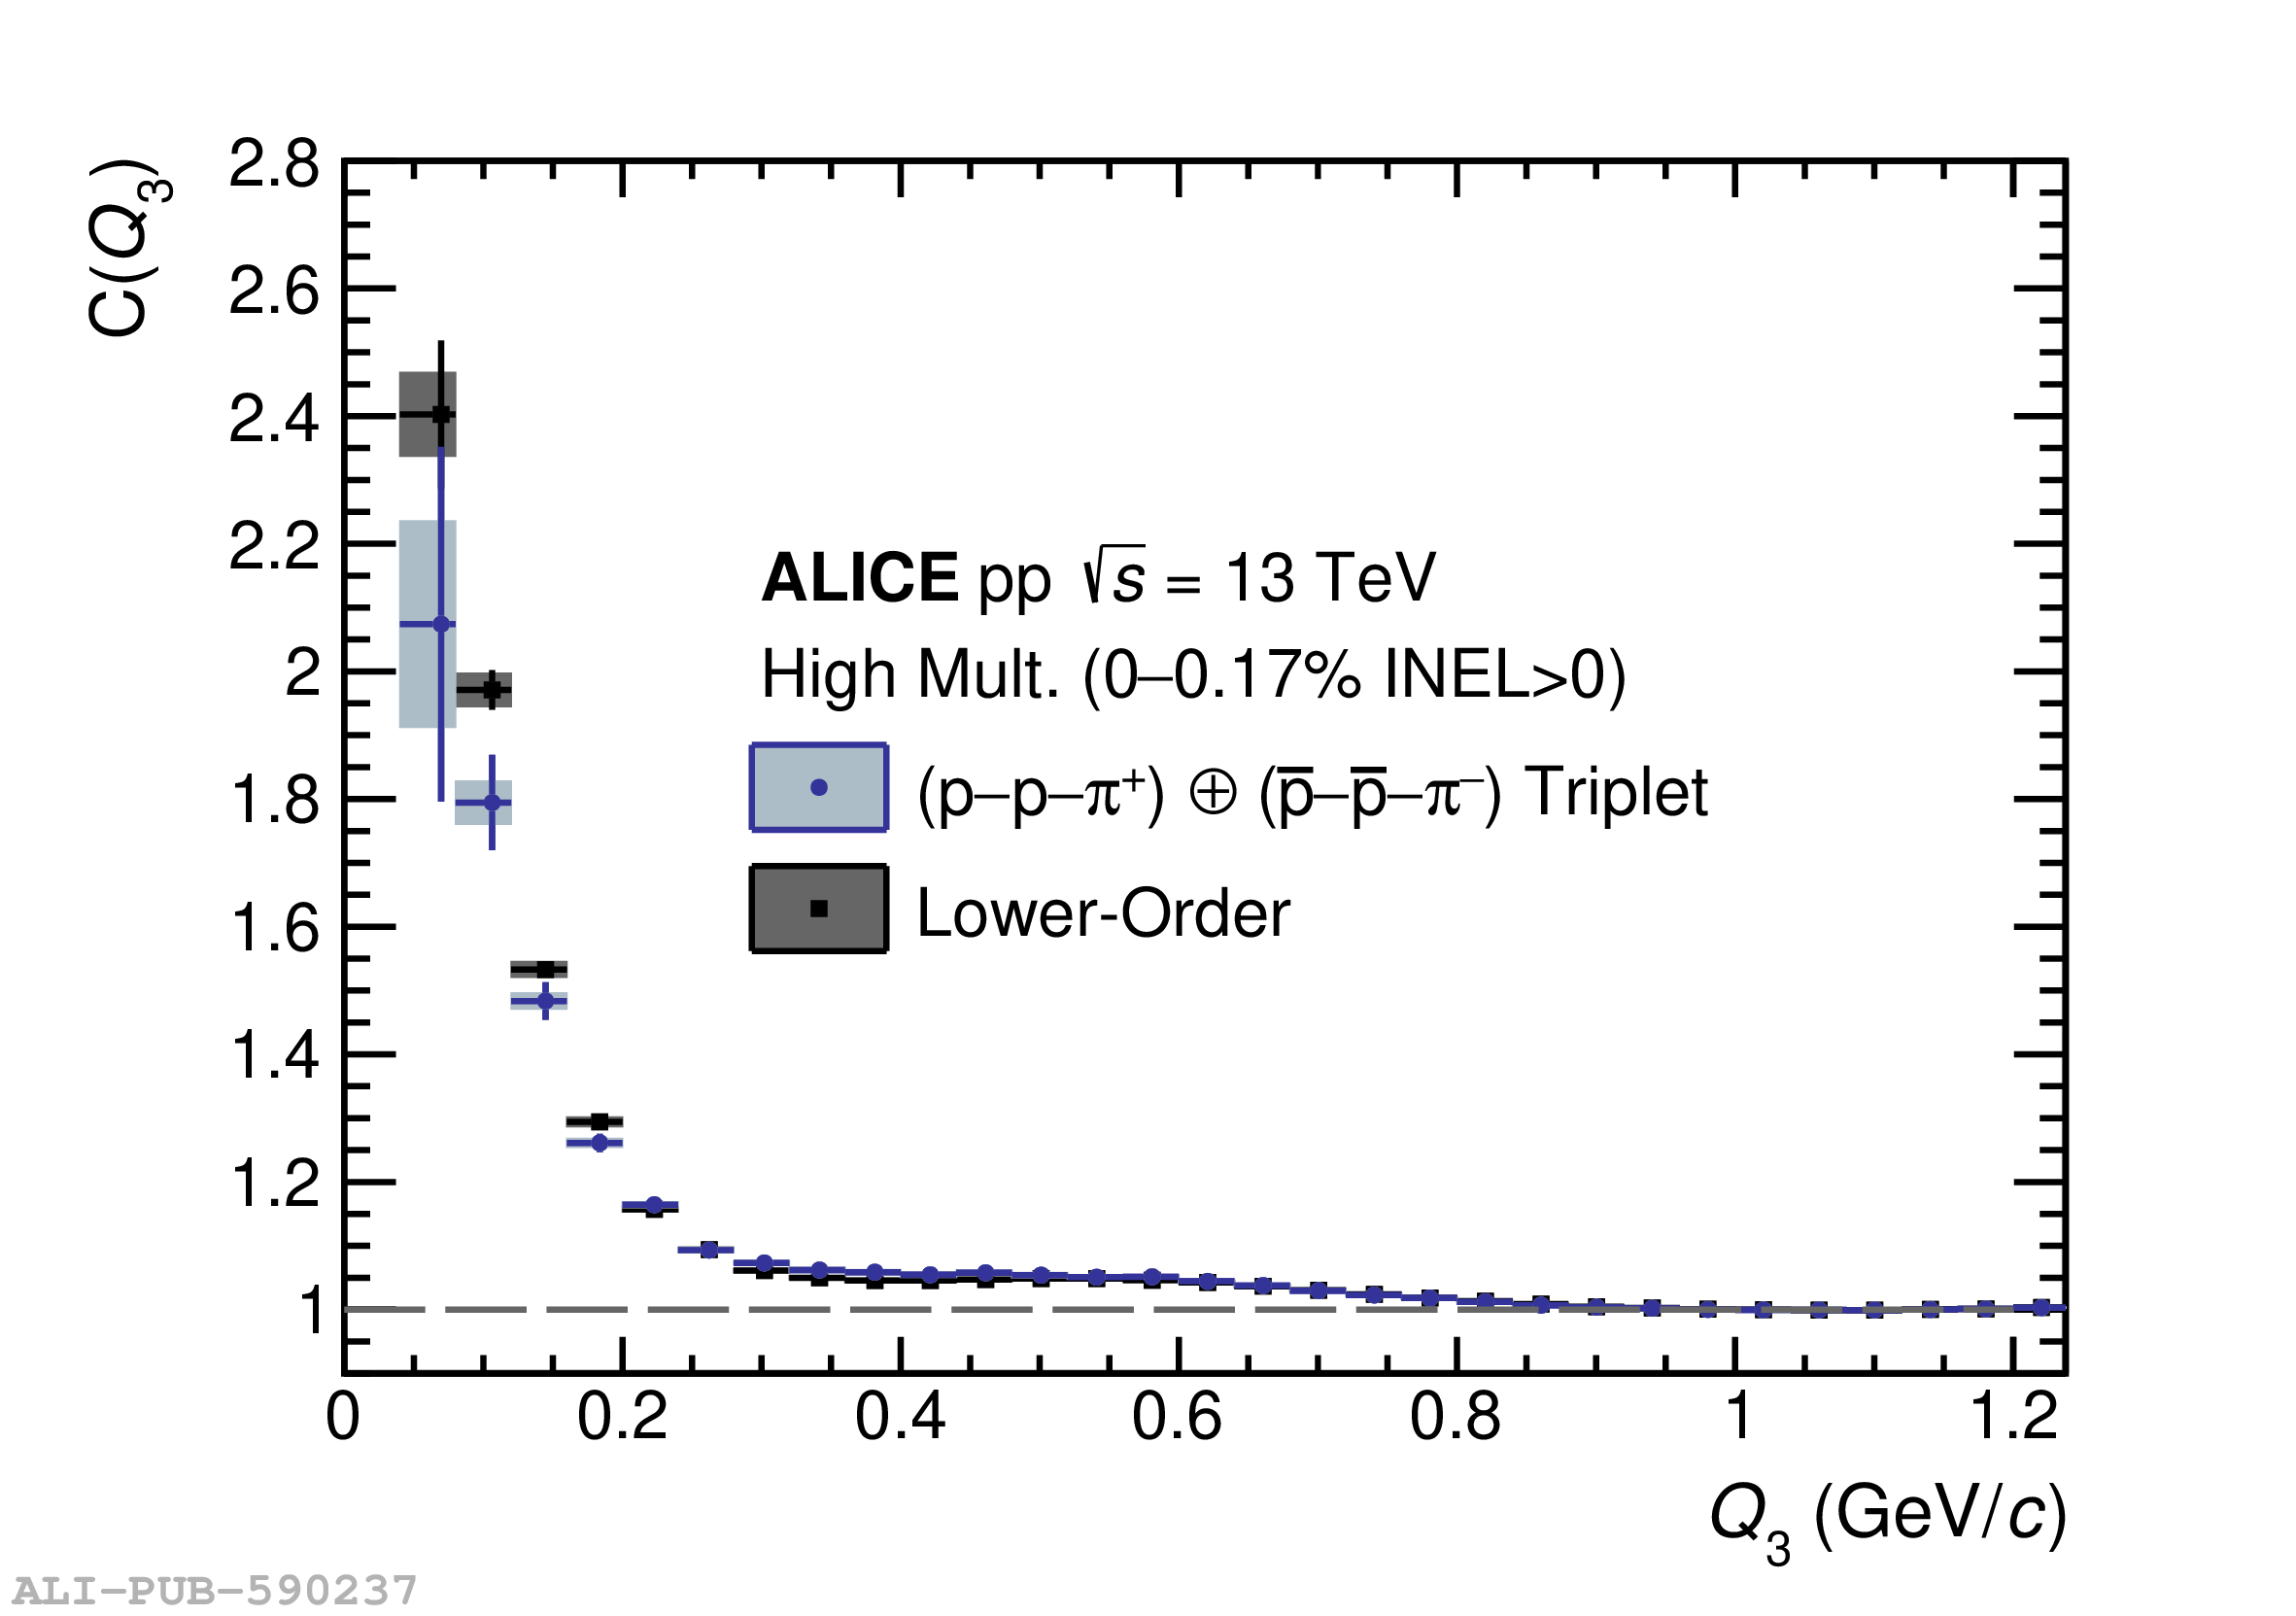  |

Figure A.1
The experimental correlation function of p$-\pi^+$ pairs as a function of the pair relative momentum $k^*$ in several intervals of the pair $m_{\rm T}$: (a) $[0.54, 0.75)$ GeV/$c^2$, (b) $[0.75, 0.95)$ GeV/$c^2$, (c) $[0.95, 1.2)$ GeV/$c^2$, (d) $[1.2, 1.5)$ GeV/$c^2$, (e) $[1.5, 2.0)$ GeV/$c^2$, and (f) $[2.0, 2.5)$ GeV/$c^2$. The lines and boxes show the statistical and systematic uncertainties of the experimental data, respectively. | 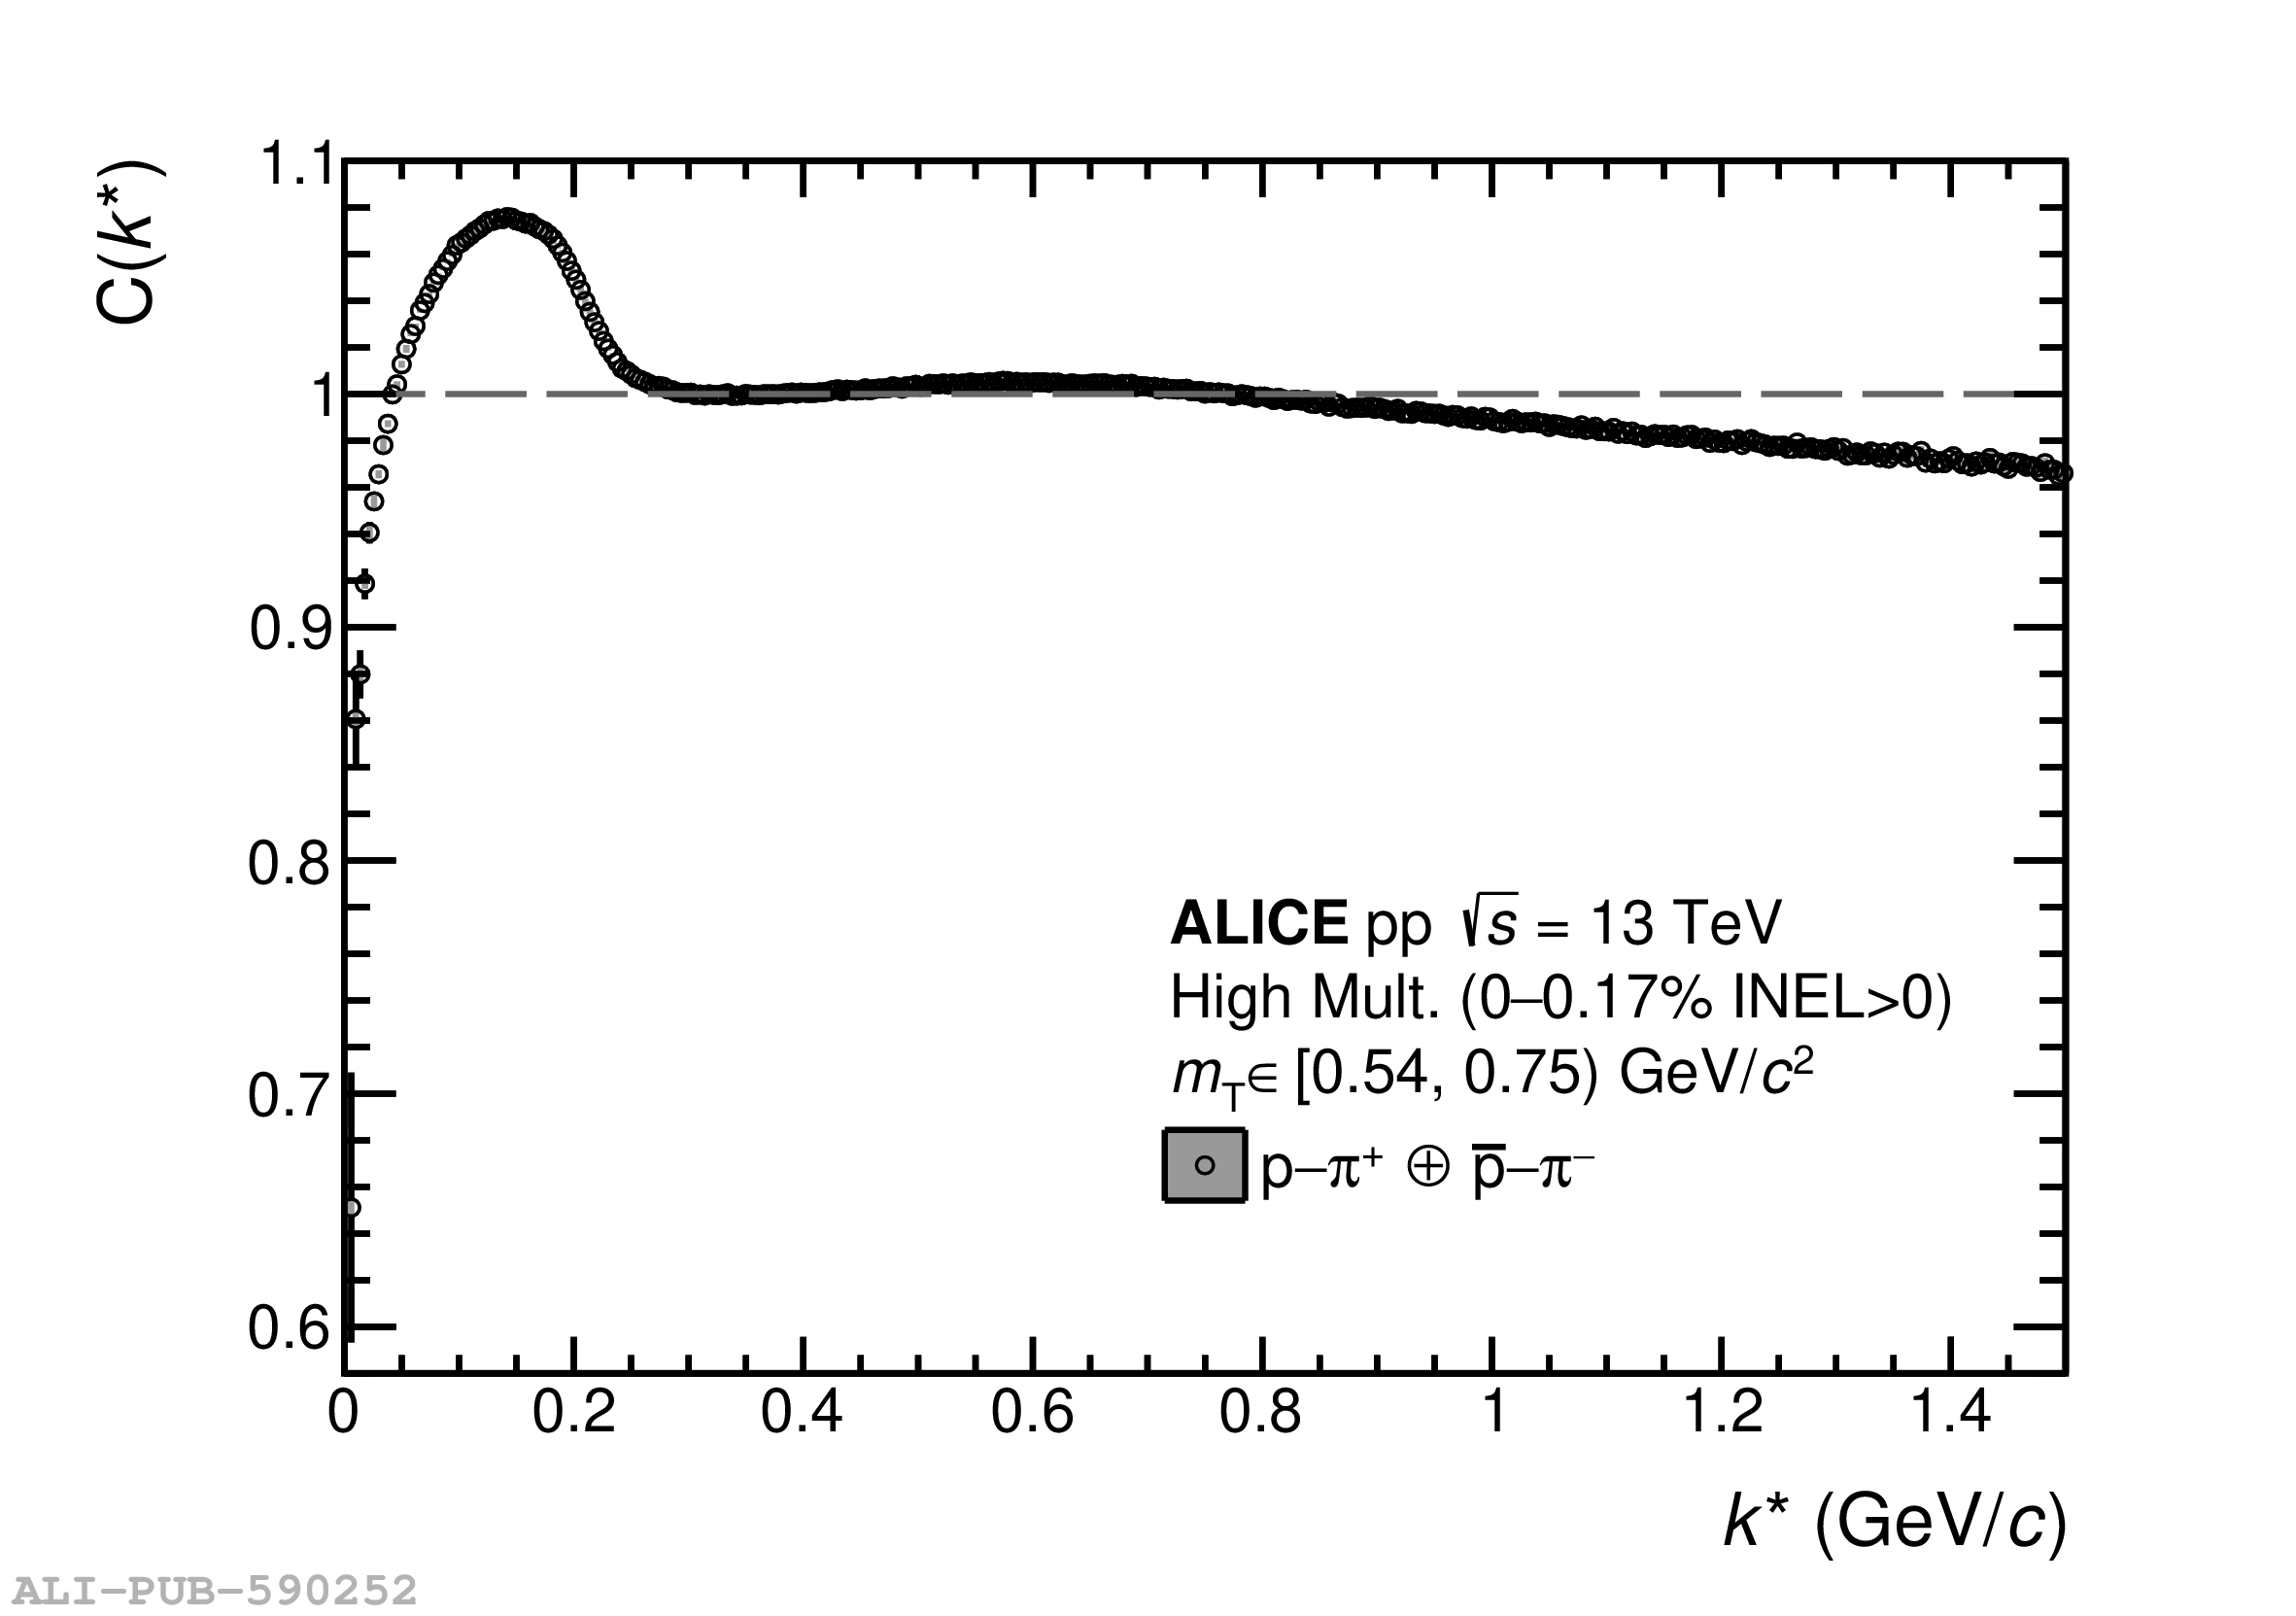 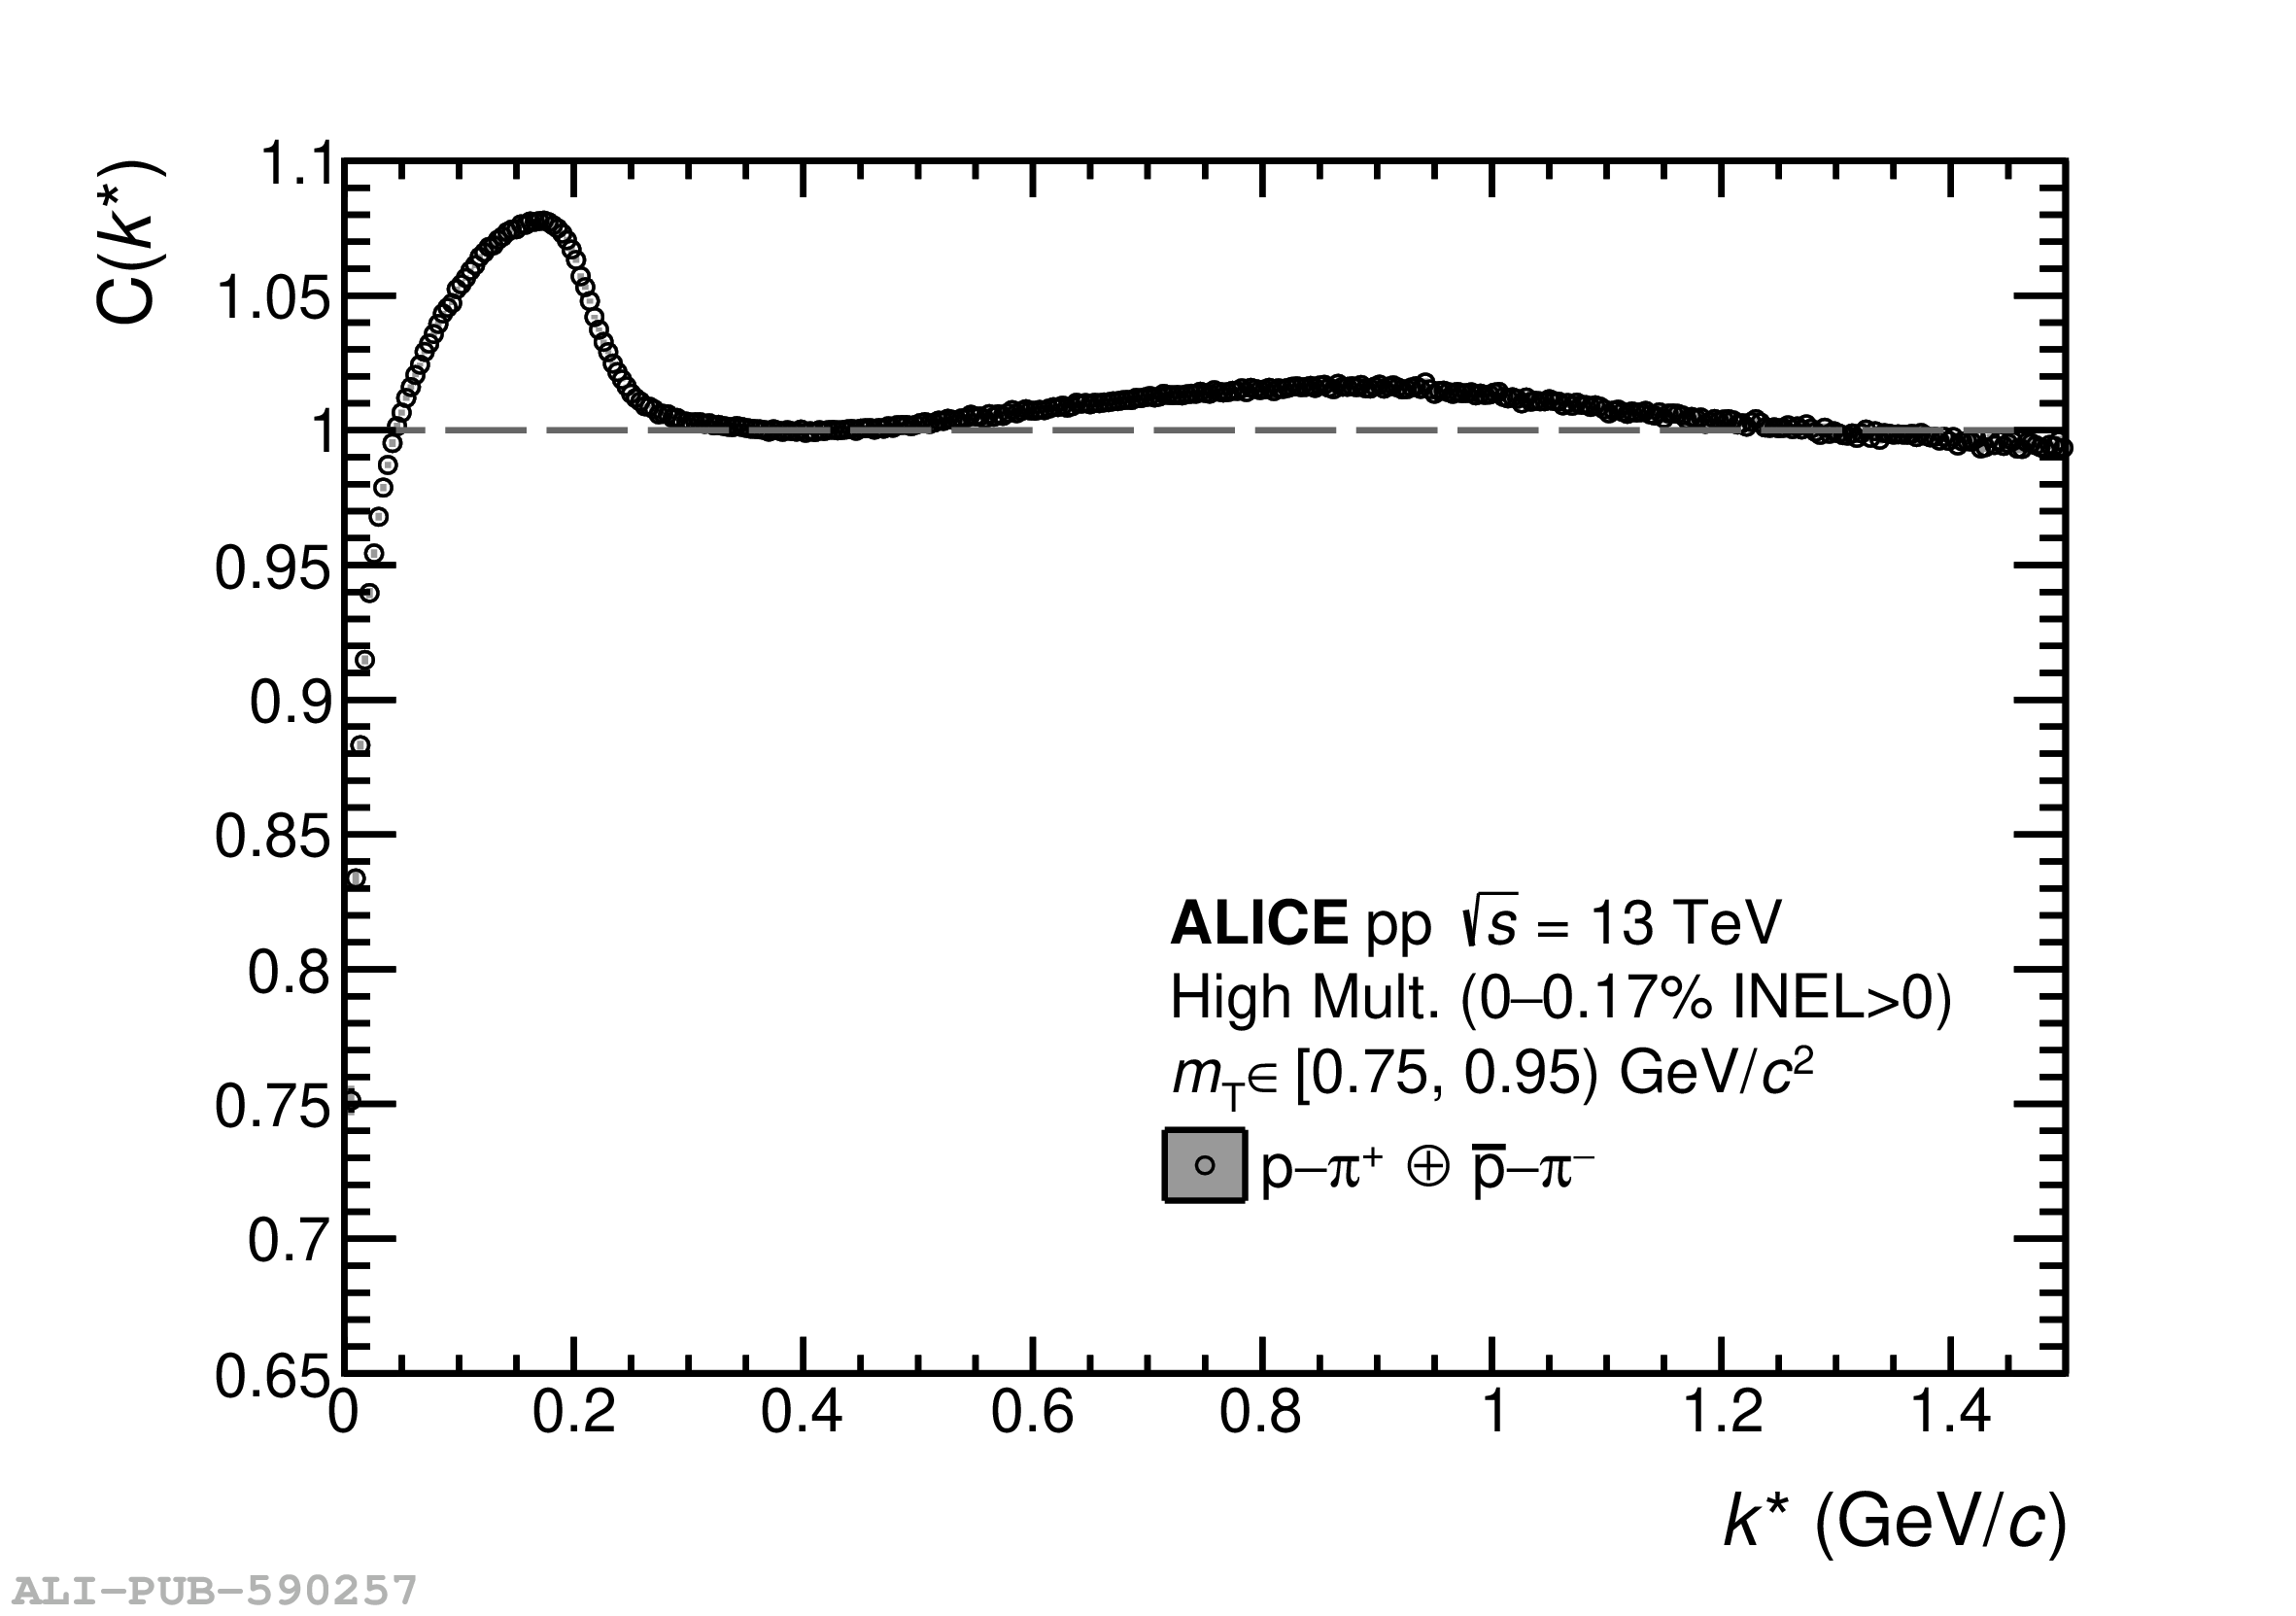 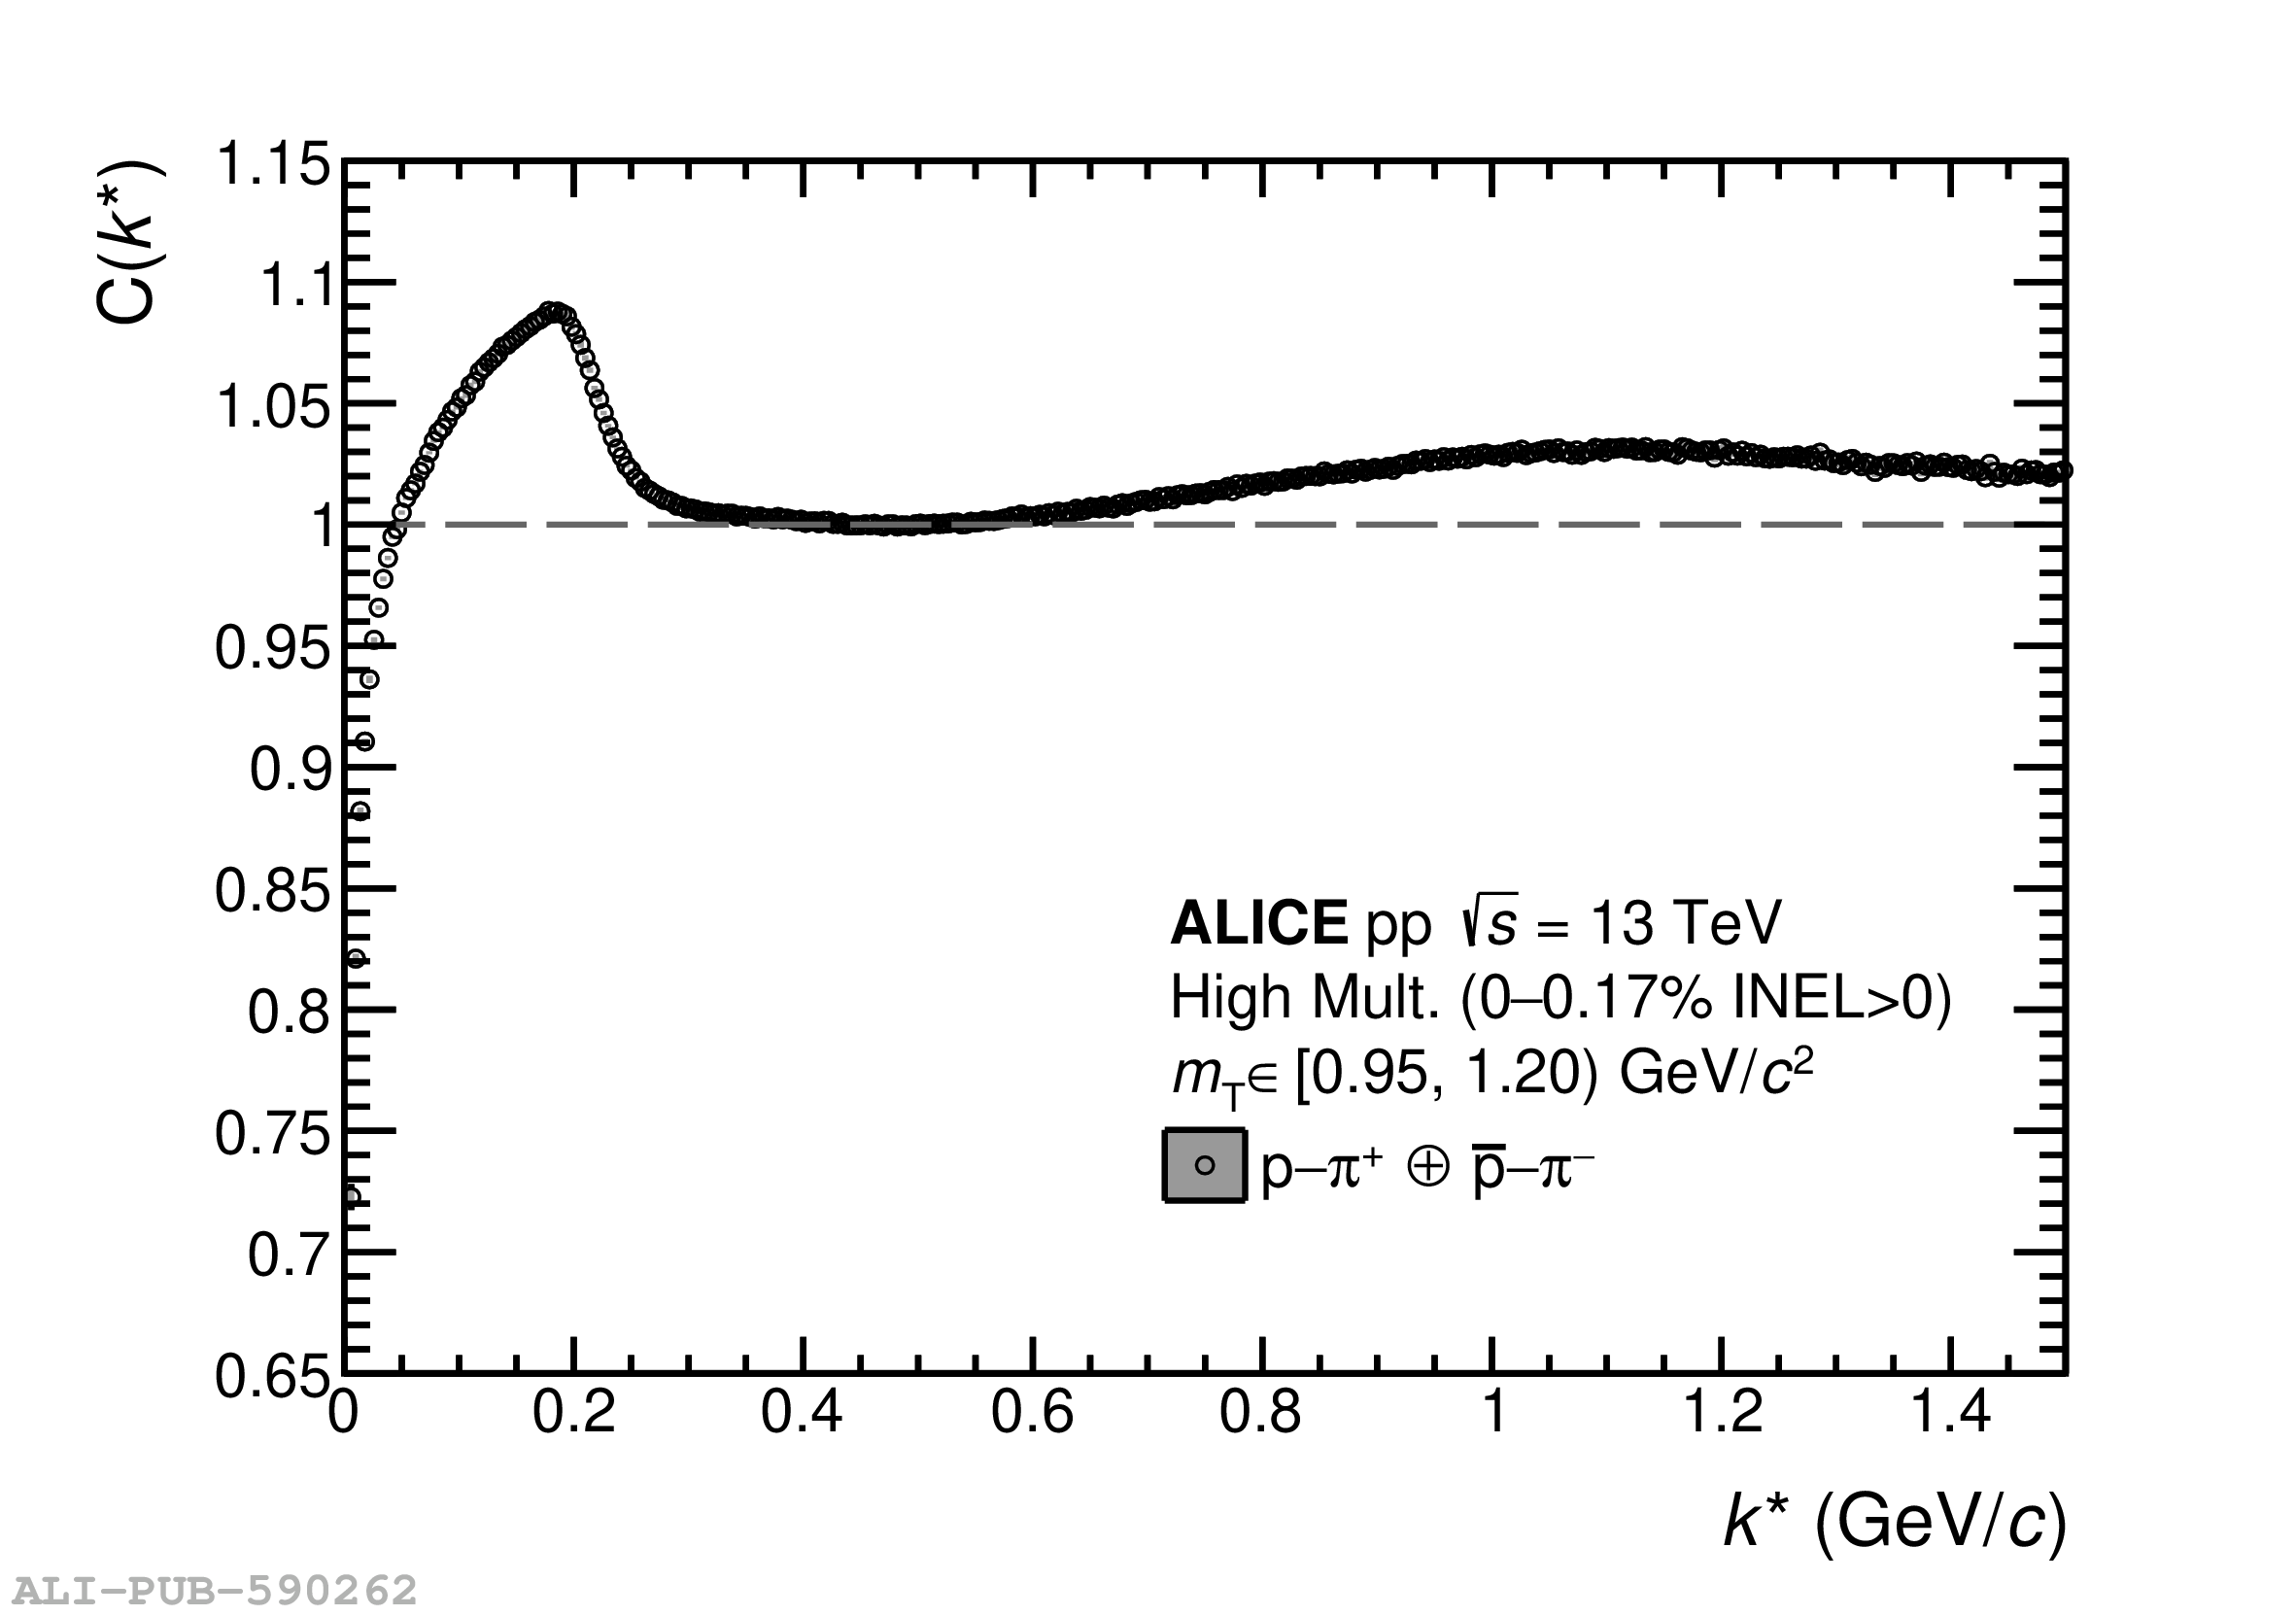    |
Figure A.2
The experimental correlation function of p$-\pi^-$ pairs as a function of the pair relative momentum $k^*$ in several intervals of the pair $m_{\rm T}$: (a) $[0.54, 0.75)$ GeV/$c^2$, (b) $[0.75, 0.95)$ GeV/$c^2$, (c) $[0.95, 1.2)$ GeV/$c^2$, (d) $[1.2, 1.5)$ GeV/$c^2$, (e) $[1.5, 2.0)$ GeV/$c^2$, and (f) $[2.0, 2.5)$ GeV/$c^2$. The lines show the statistical uncertainties of the experimental data, while the respective systematic uncertainties are represented by the boxes. |    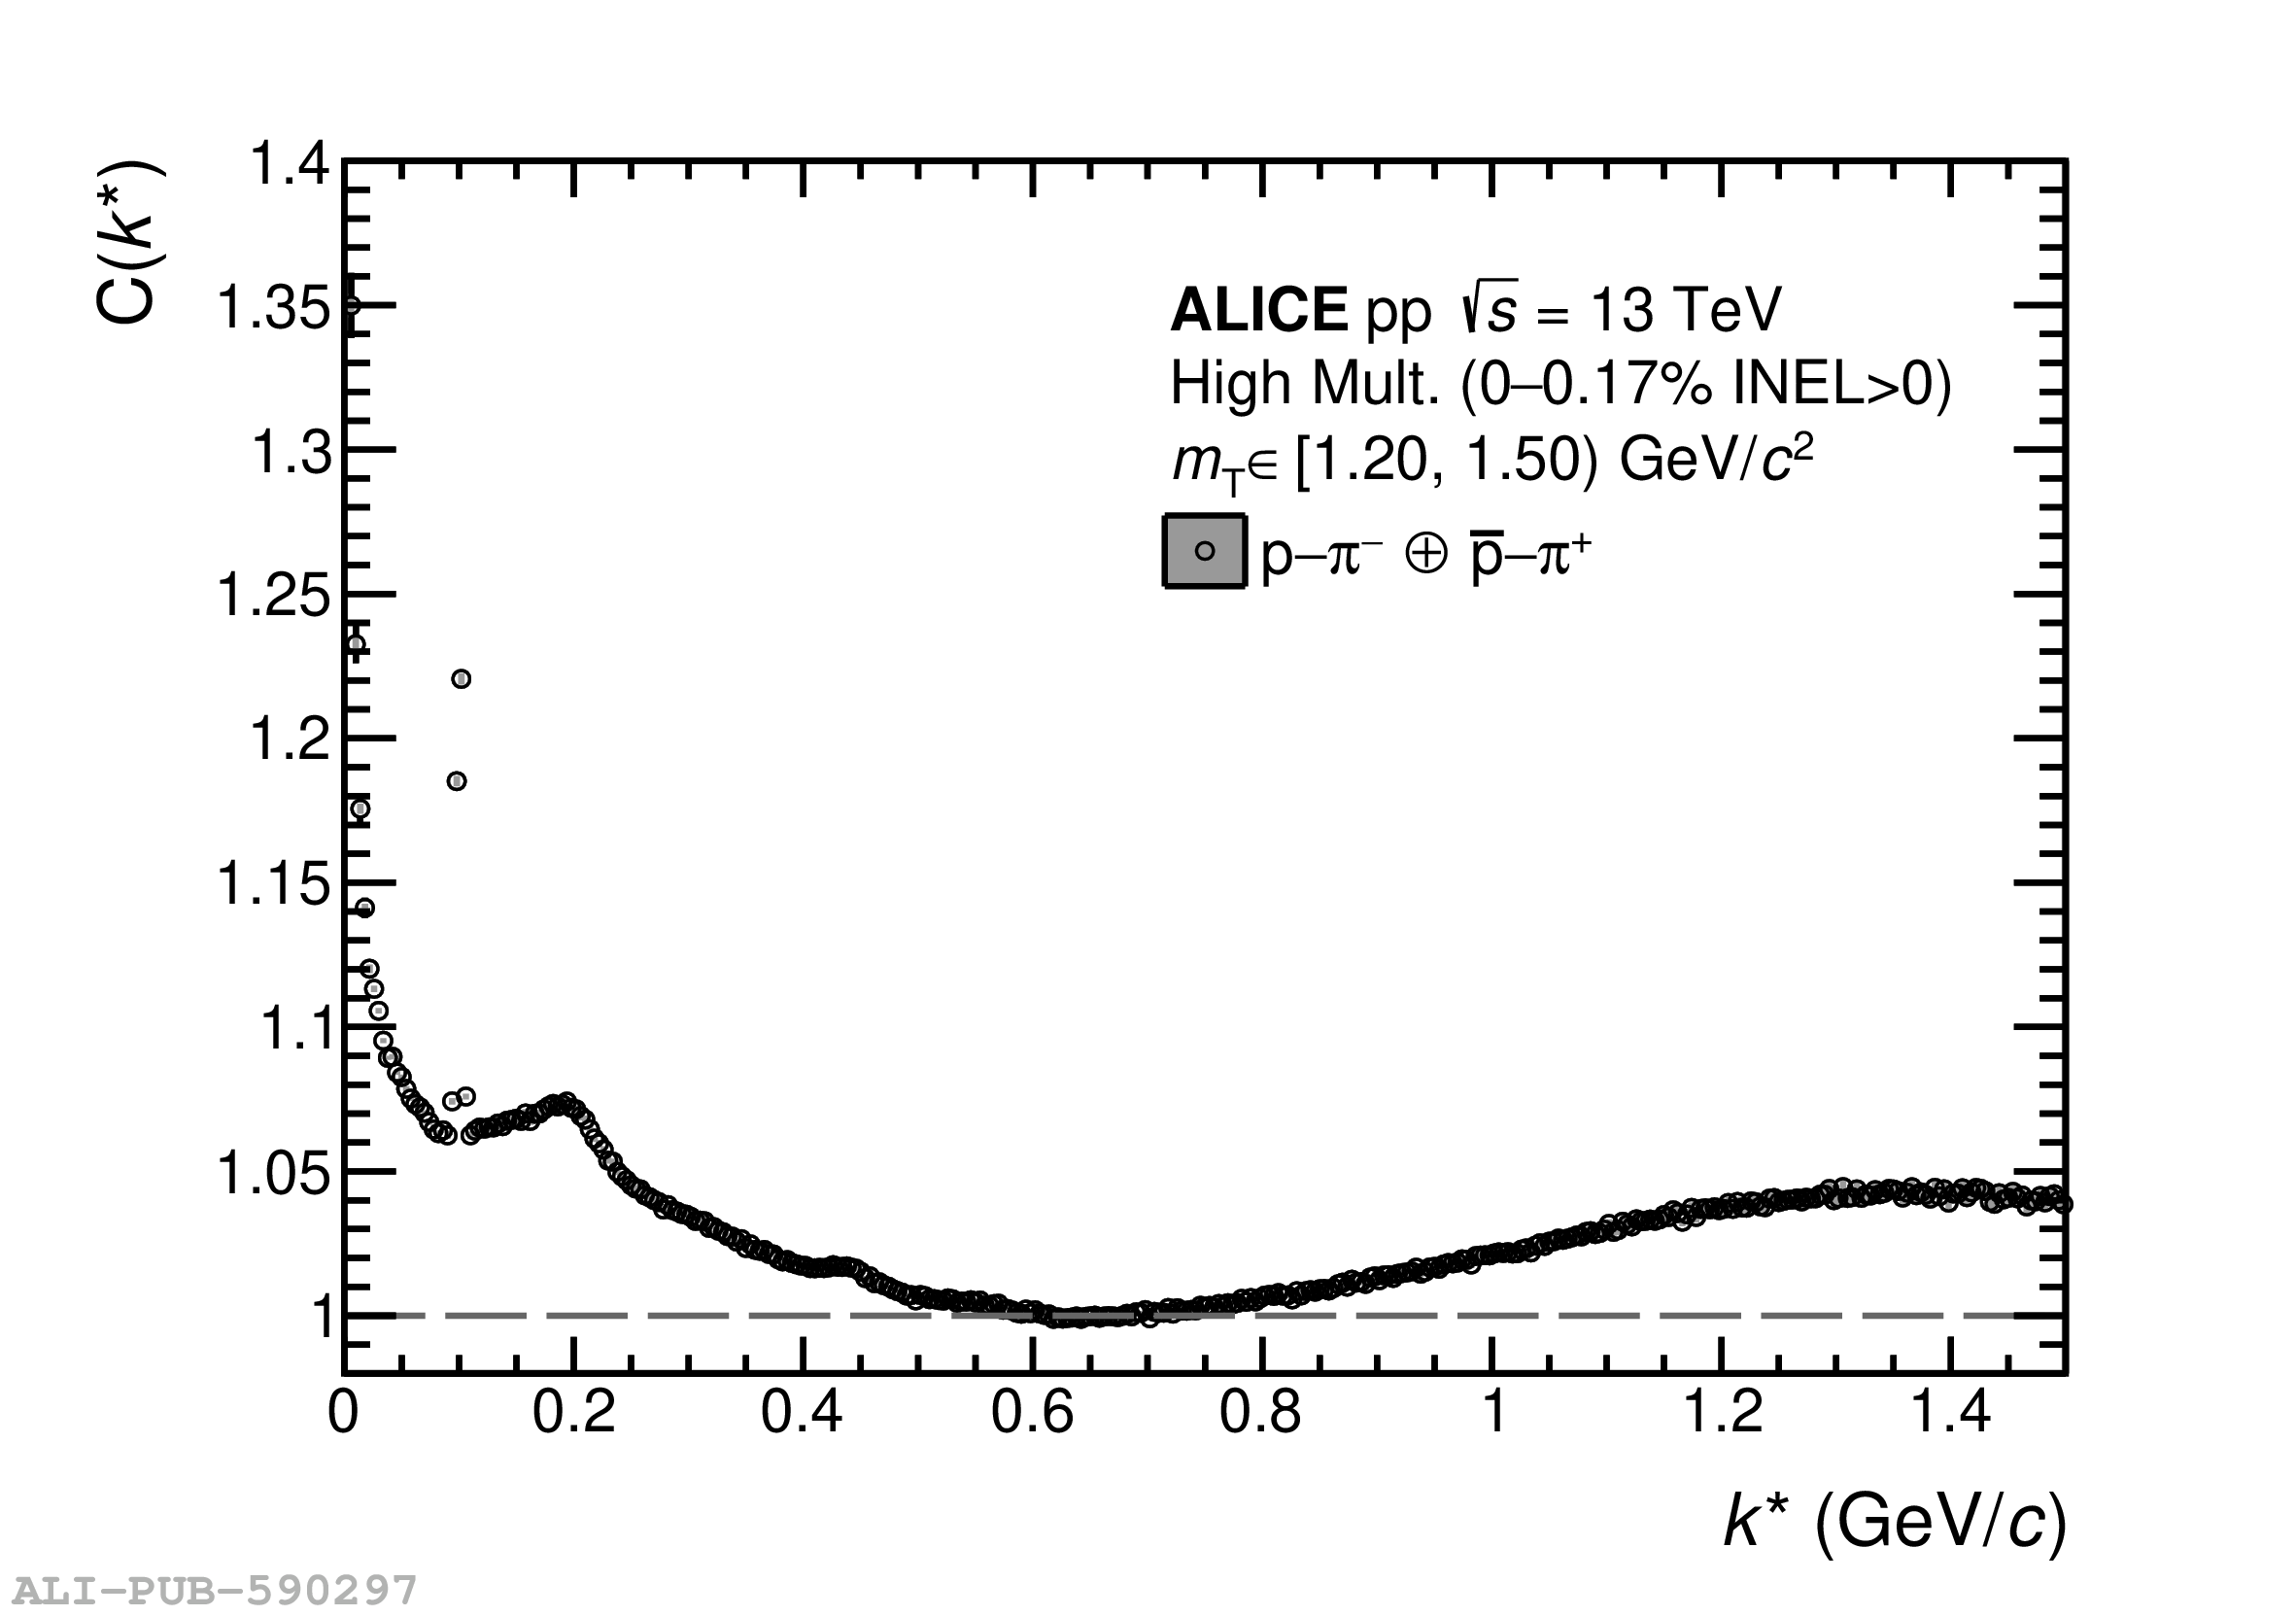   |
Figure A.3
The correlation function of p$-\pi^+$ pairs for common and non-common ancestor obtained with PYTHIA 8.2 (Monash 2013 Tune) together with GEANT3 as a function of the pair relative momentum $k^*$ in several intervals of the pair $m_{\rm T}$: (a) $[0.54, 0.75)$ GeV/$c^2$, (b) $[0.75, 0.95)$ GeV/$c^2$, (c) $[0.95, 1.2)$ GeV/$c^2$, (d) $[1.2, 1.5)$ GeV/$c^2$, (e) $[1.5, 2.0)$ GeV/$c^2$, and (f) $[2.0, 2.5)$ GeV/$c^2$. The lines represent the statistical uncertainties. Resonance contributions such as the $\Delta^{++}$ have been explicitly removed in the common ancestor correlation functions as these contributions are modeled separately. |  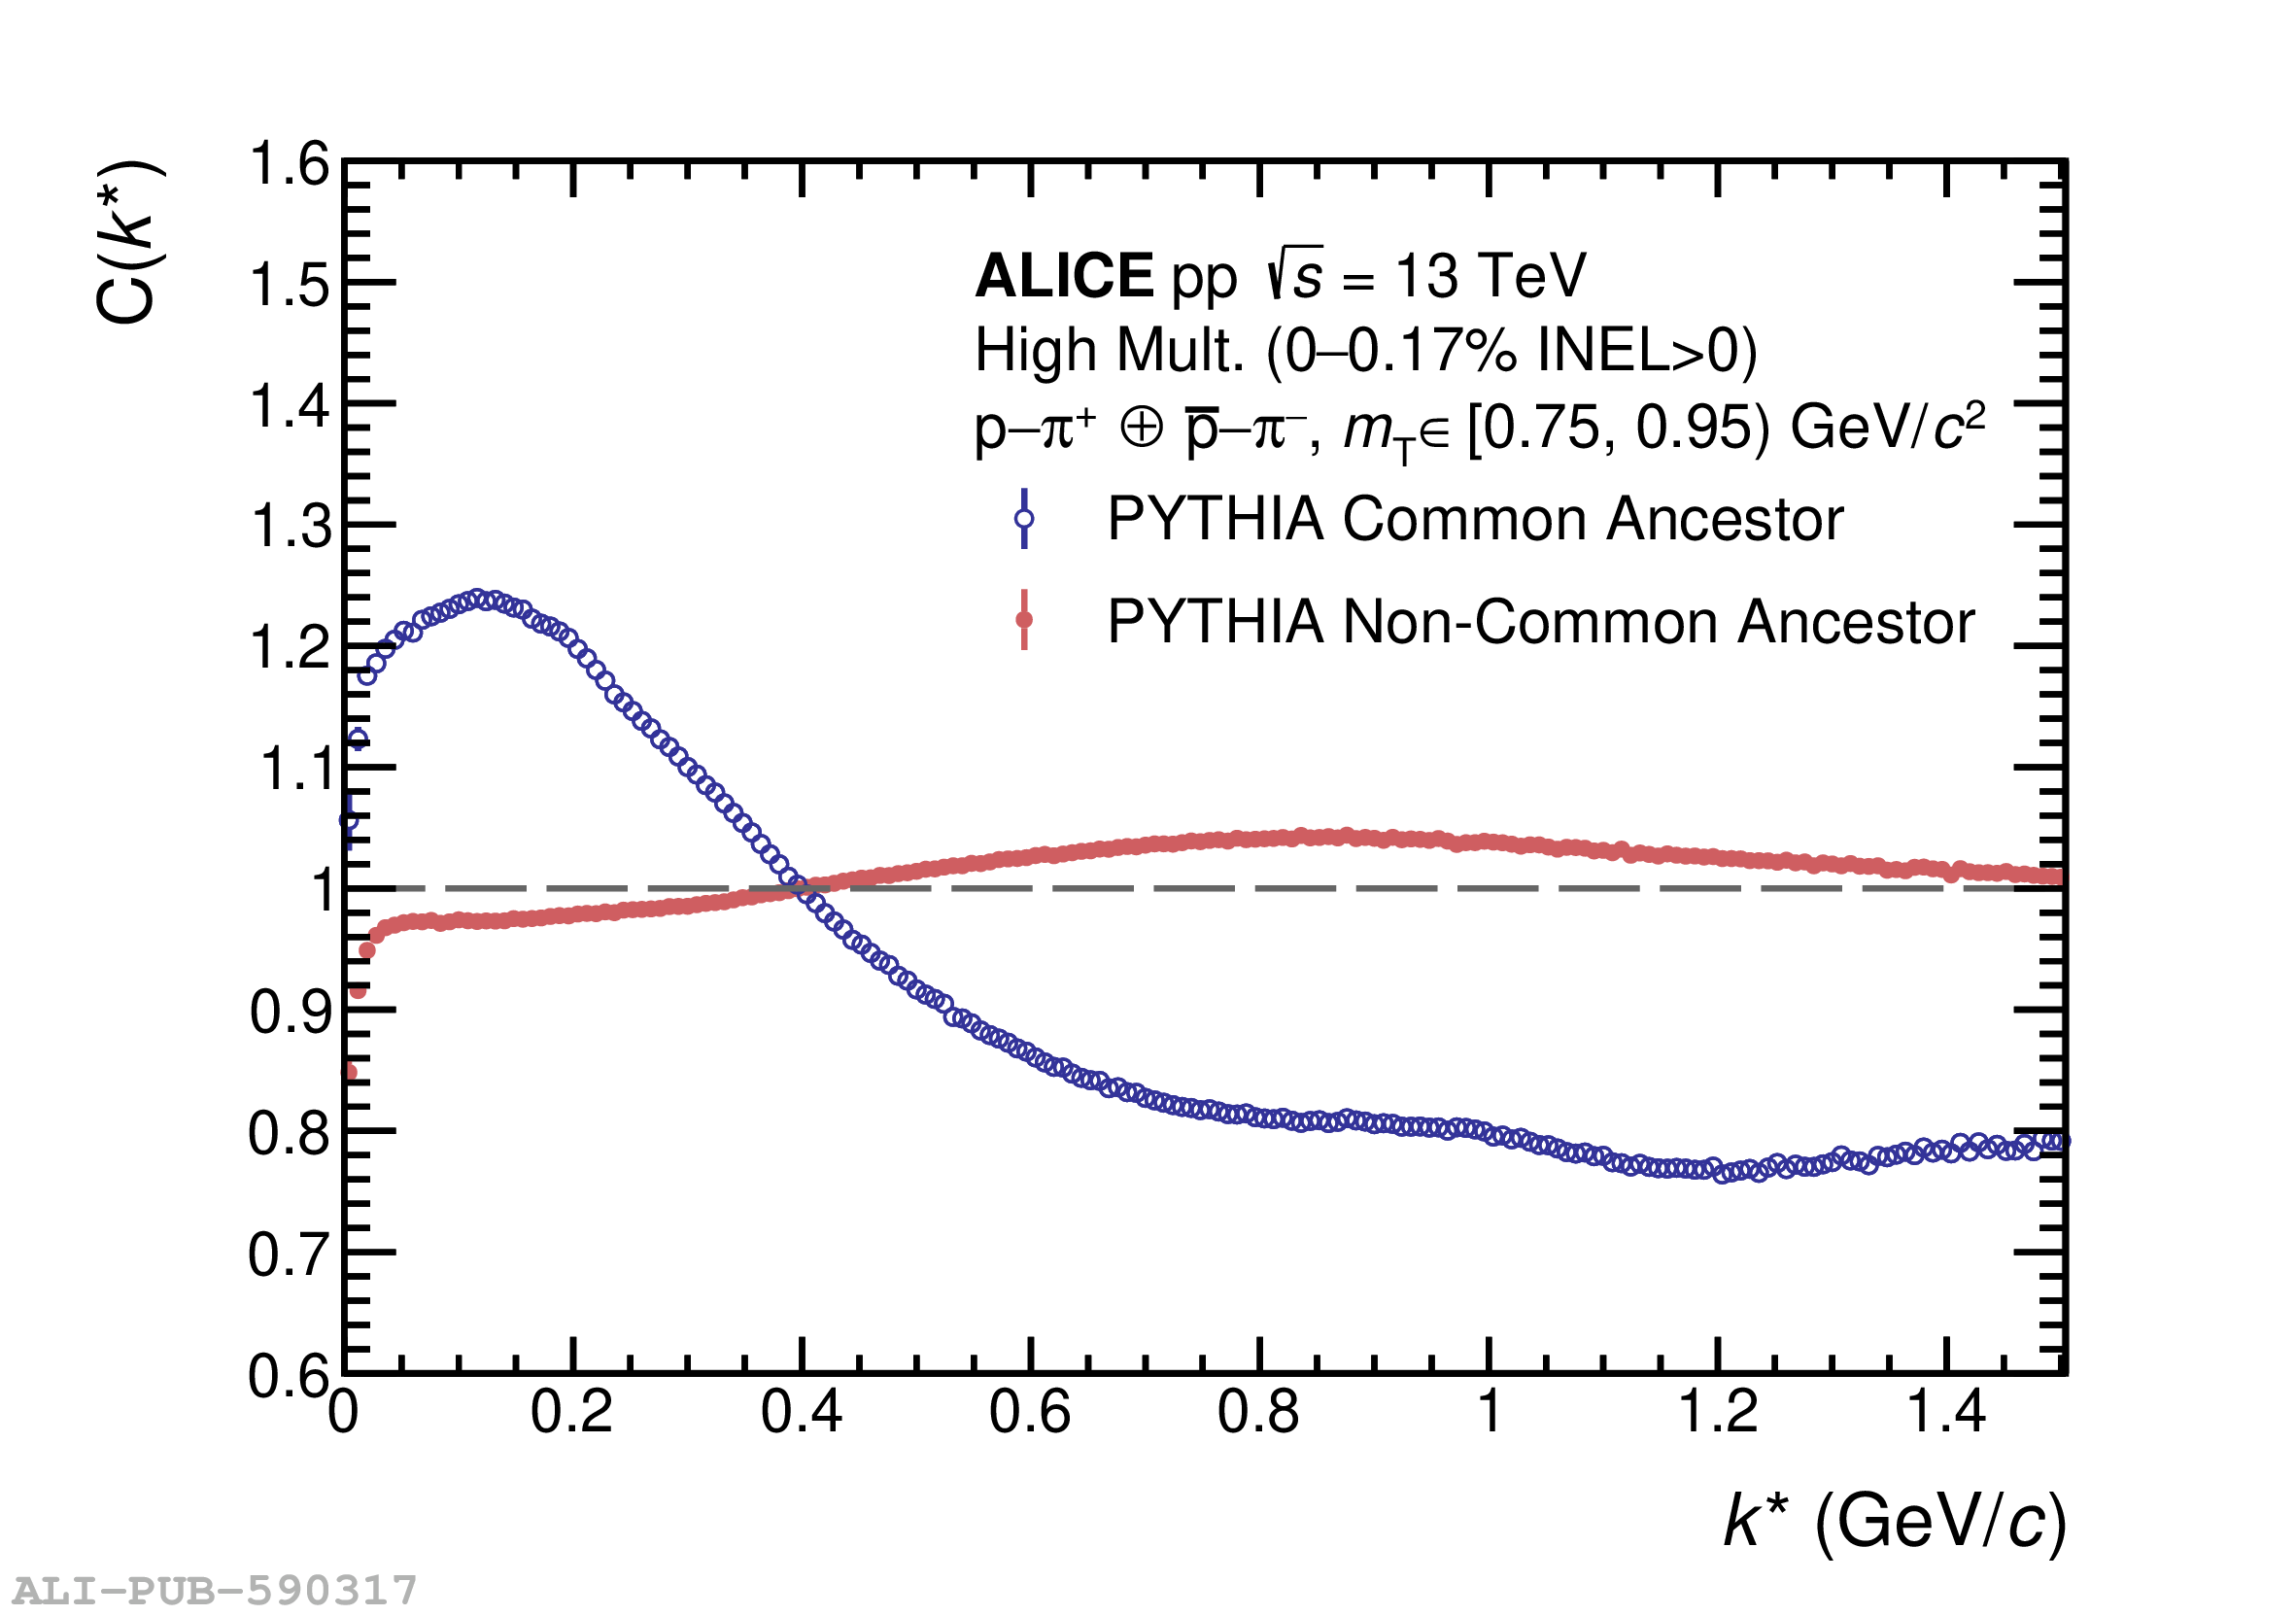  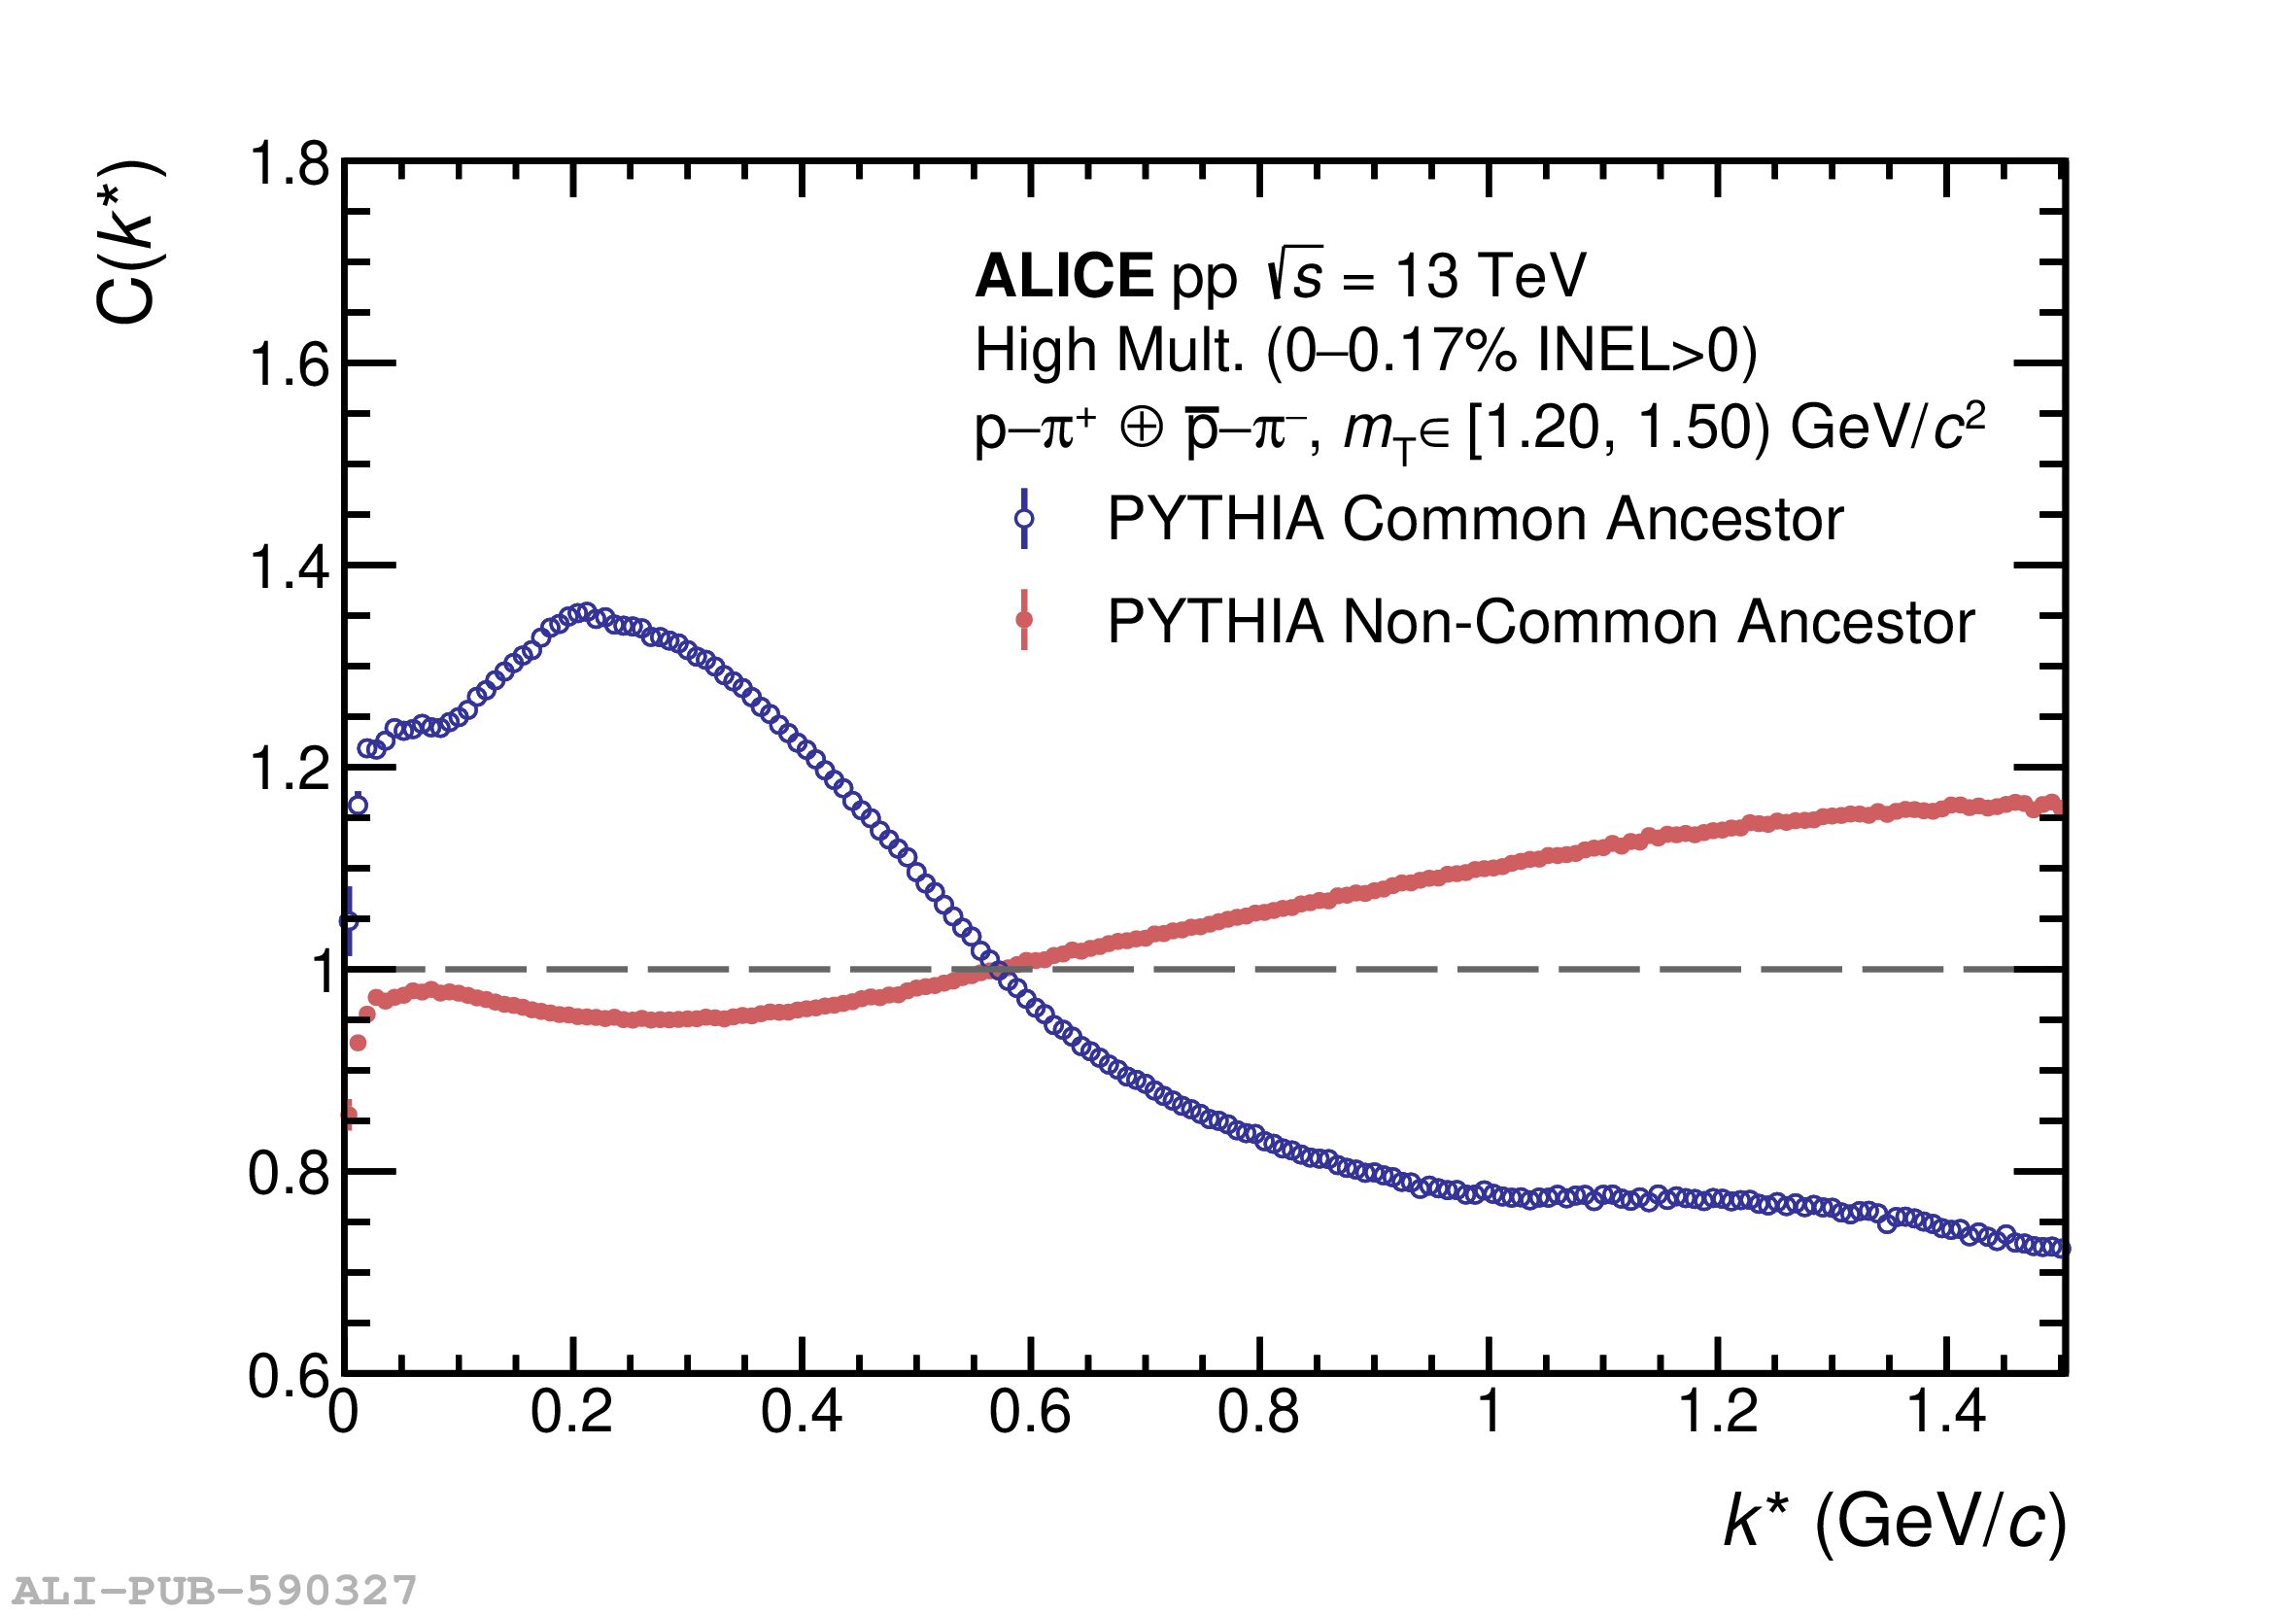   |
Figure A.4
The correlation function of p$-\pi^-$ pairs for common and non-common ancestor obtained with PYTHIA 8.2 (Monash 2013 Tune) together with GEANT3 as a function of the pair relative momentum $k^*$ in several intervals of the pair $m_{\rm T}$: (a) $[0.54, 0.75)$ GeV/$c^2$, (b) $[0.75, 0.95)$ GeV/$c^2$, (c) $[0.95, 1.2)$ GeV/$c^2$, (d) $[1.2, 1.5)$ GeV/$c^2$, (e) $[1.5, 2.0)$ GeV/$c^2$, and (f) $[2.0, 2.5)$ GeV/$c^2$. The lines represent the statistical uncertainties. Resonance contributions such as the $\Delta^0$ have been explicitly removed in the common ancestor correlation functions as these contributions are modeled separately. |   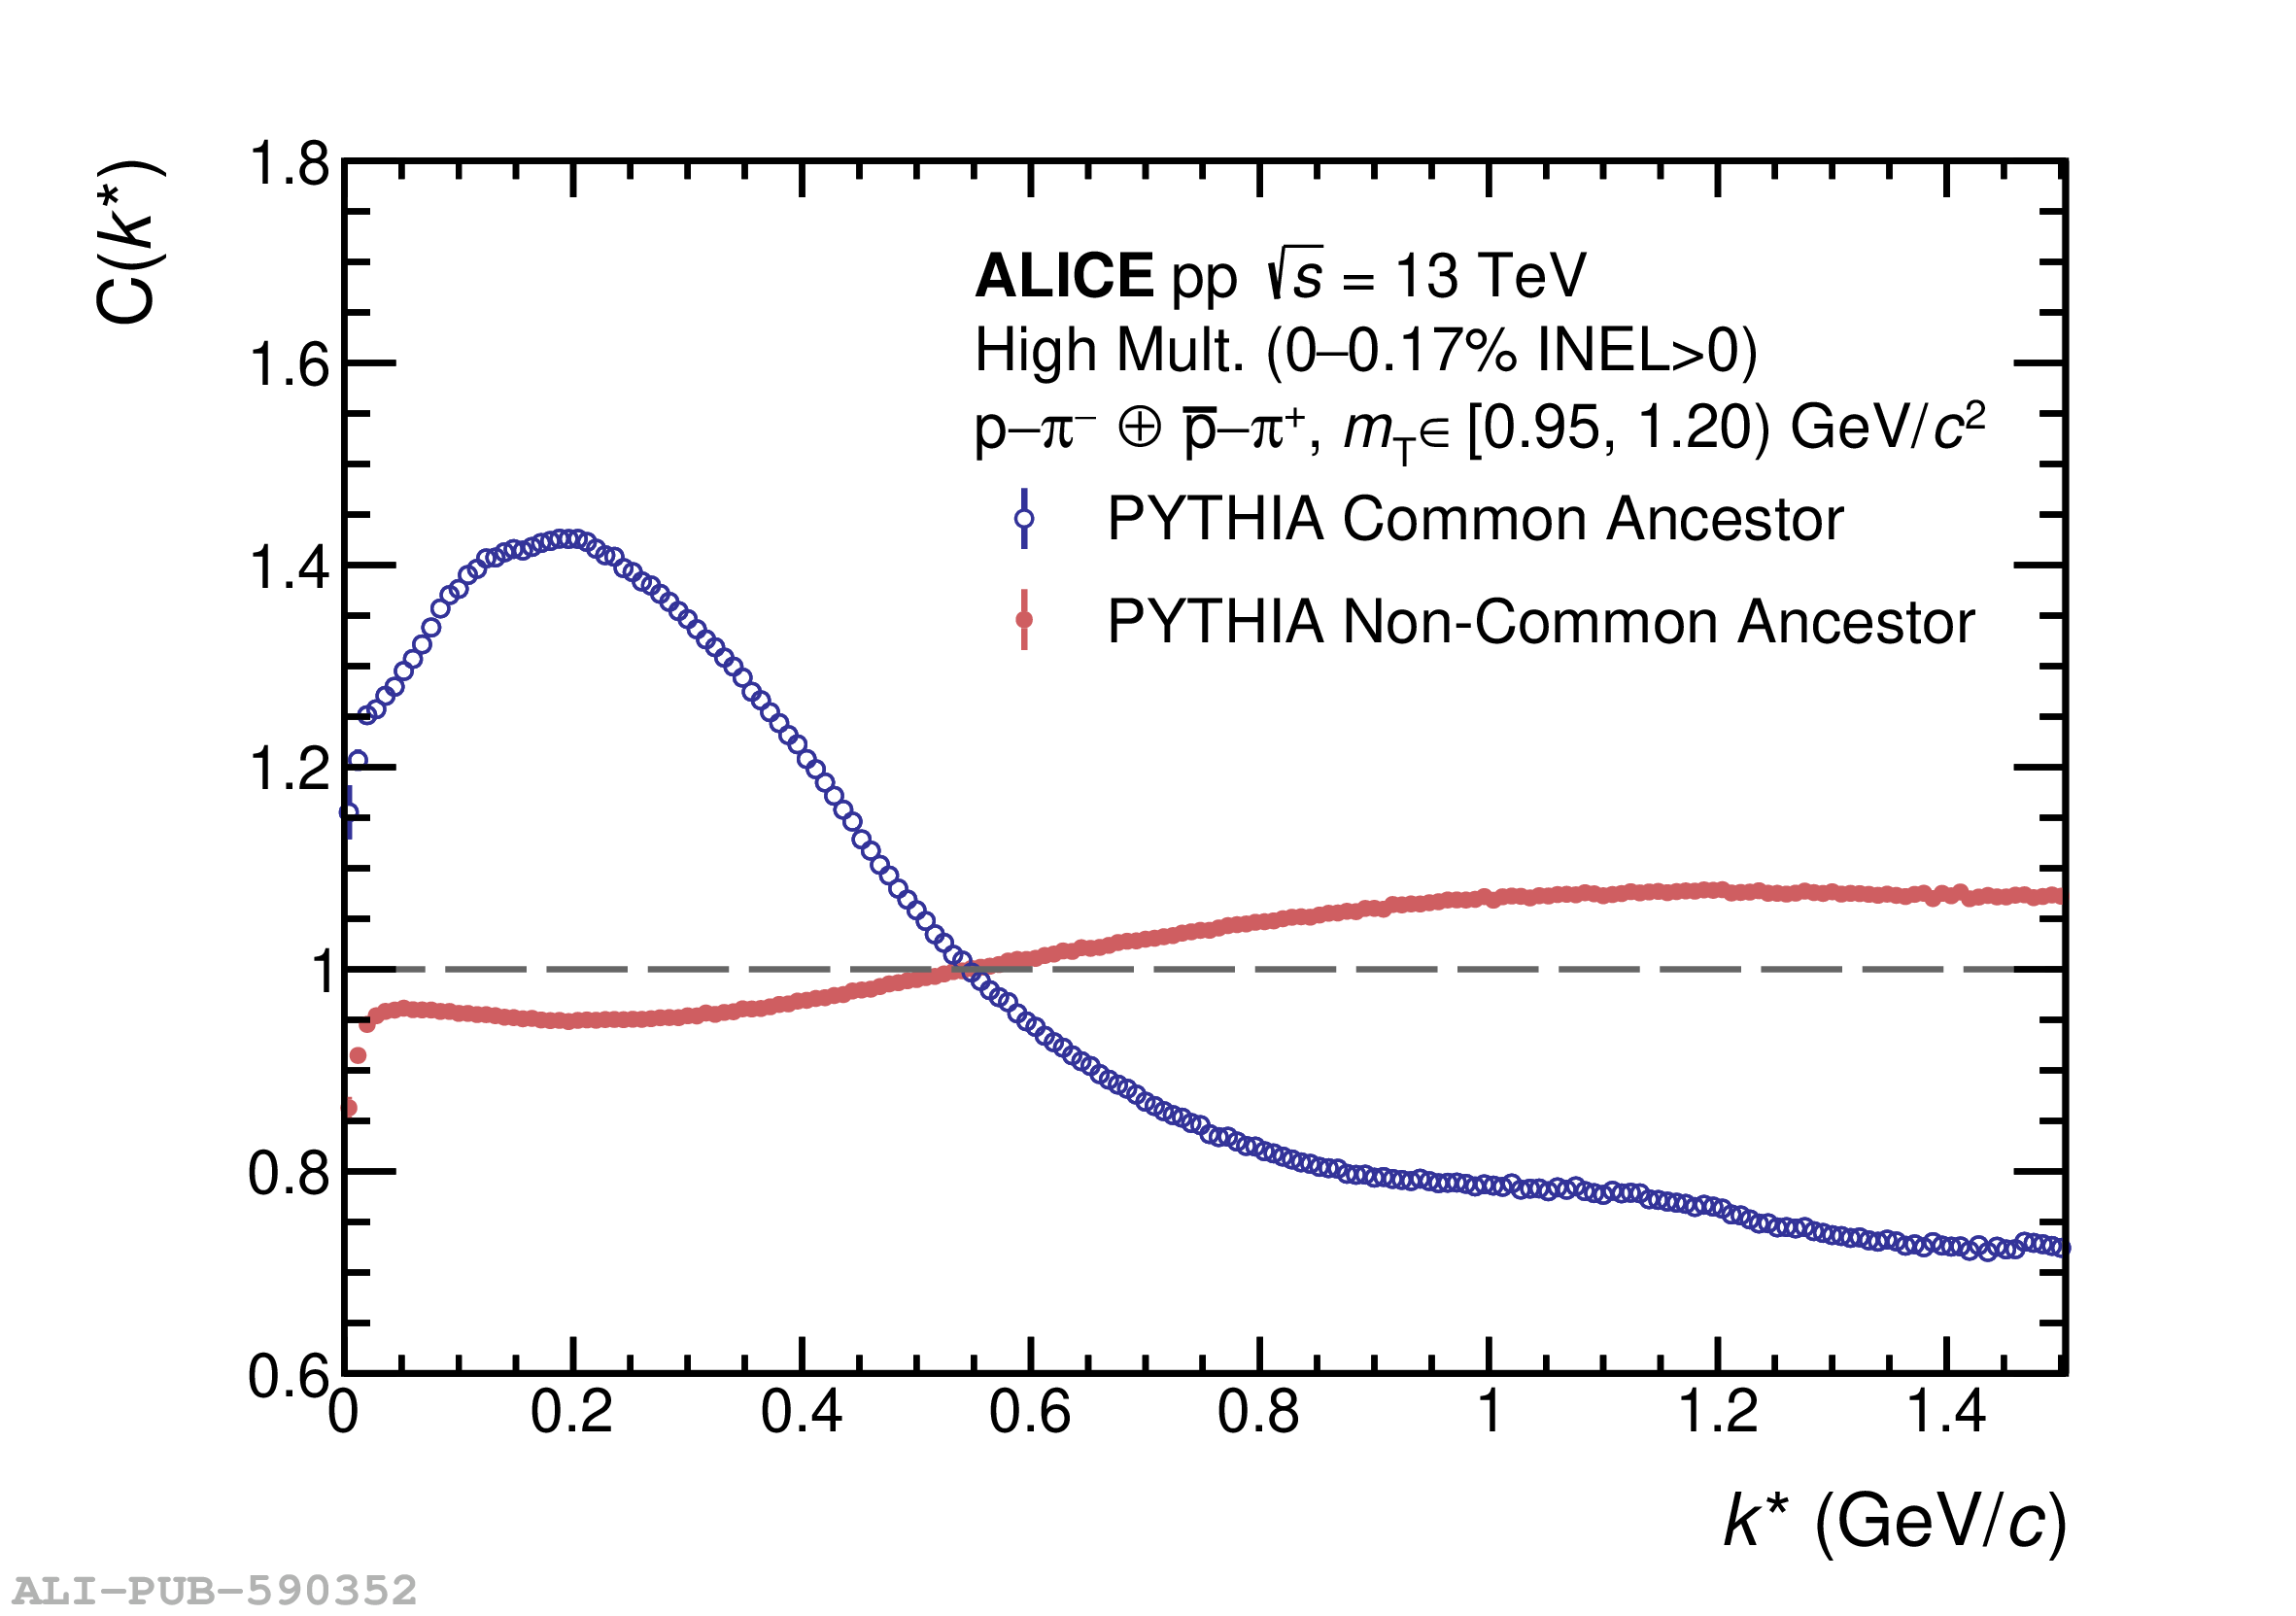   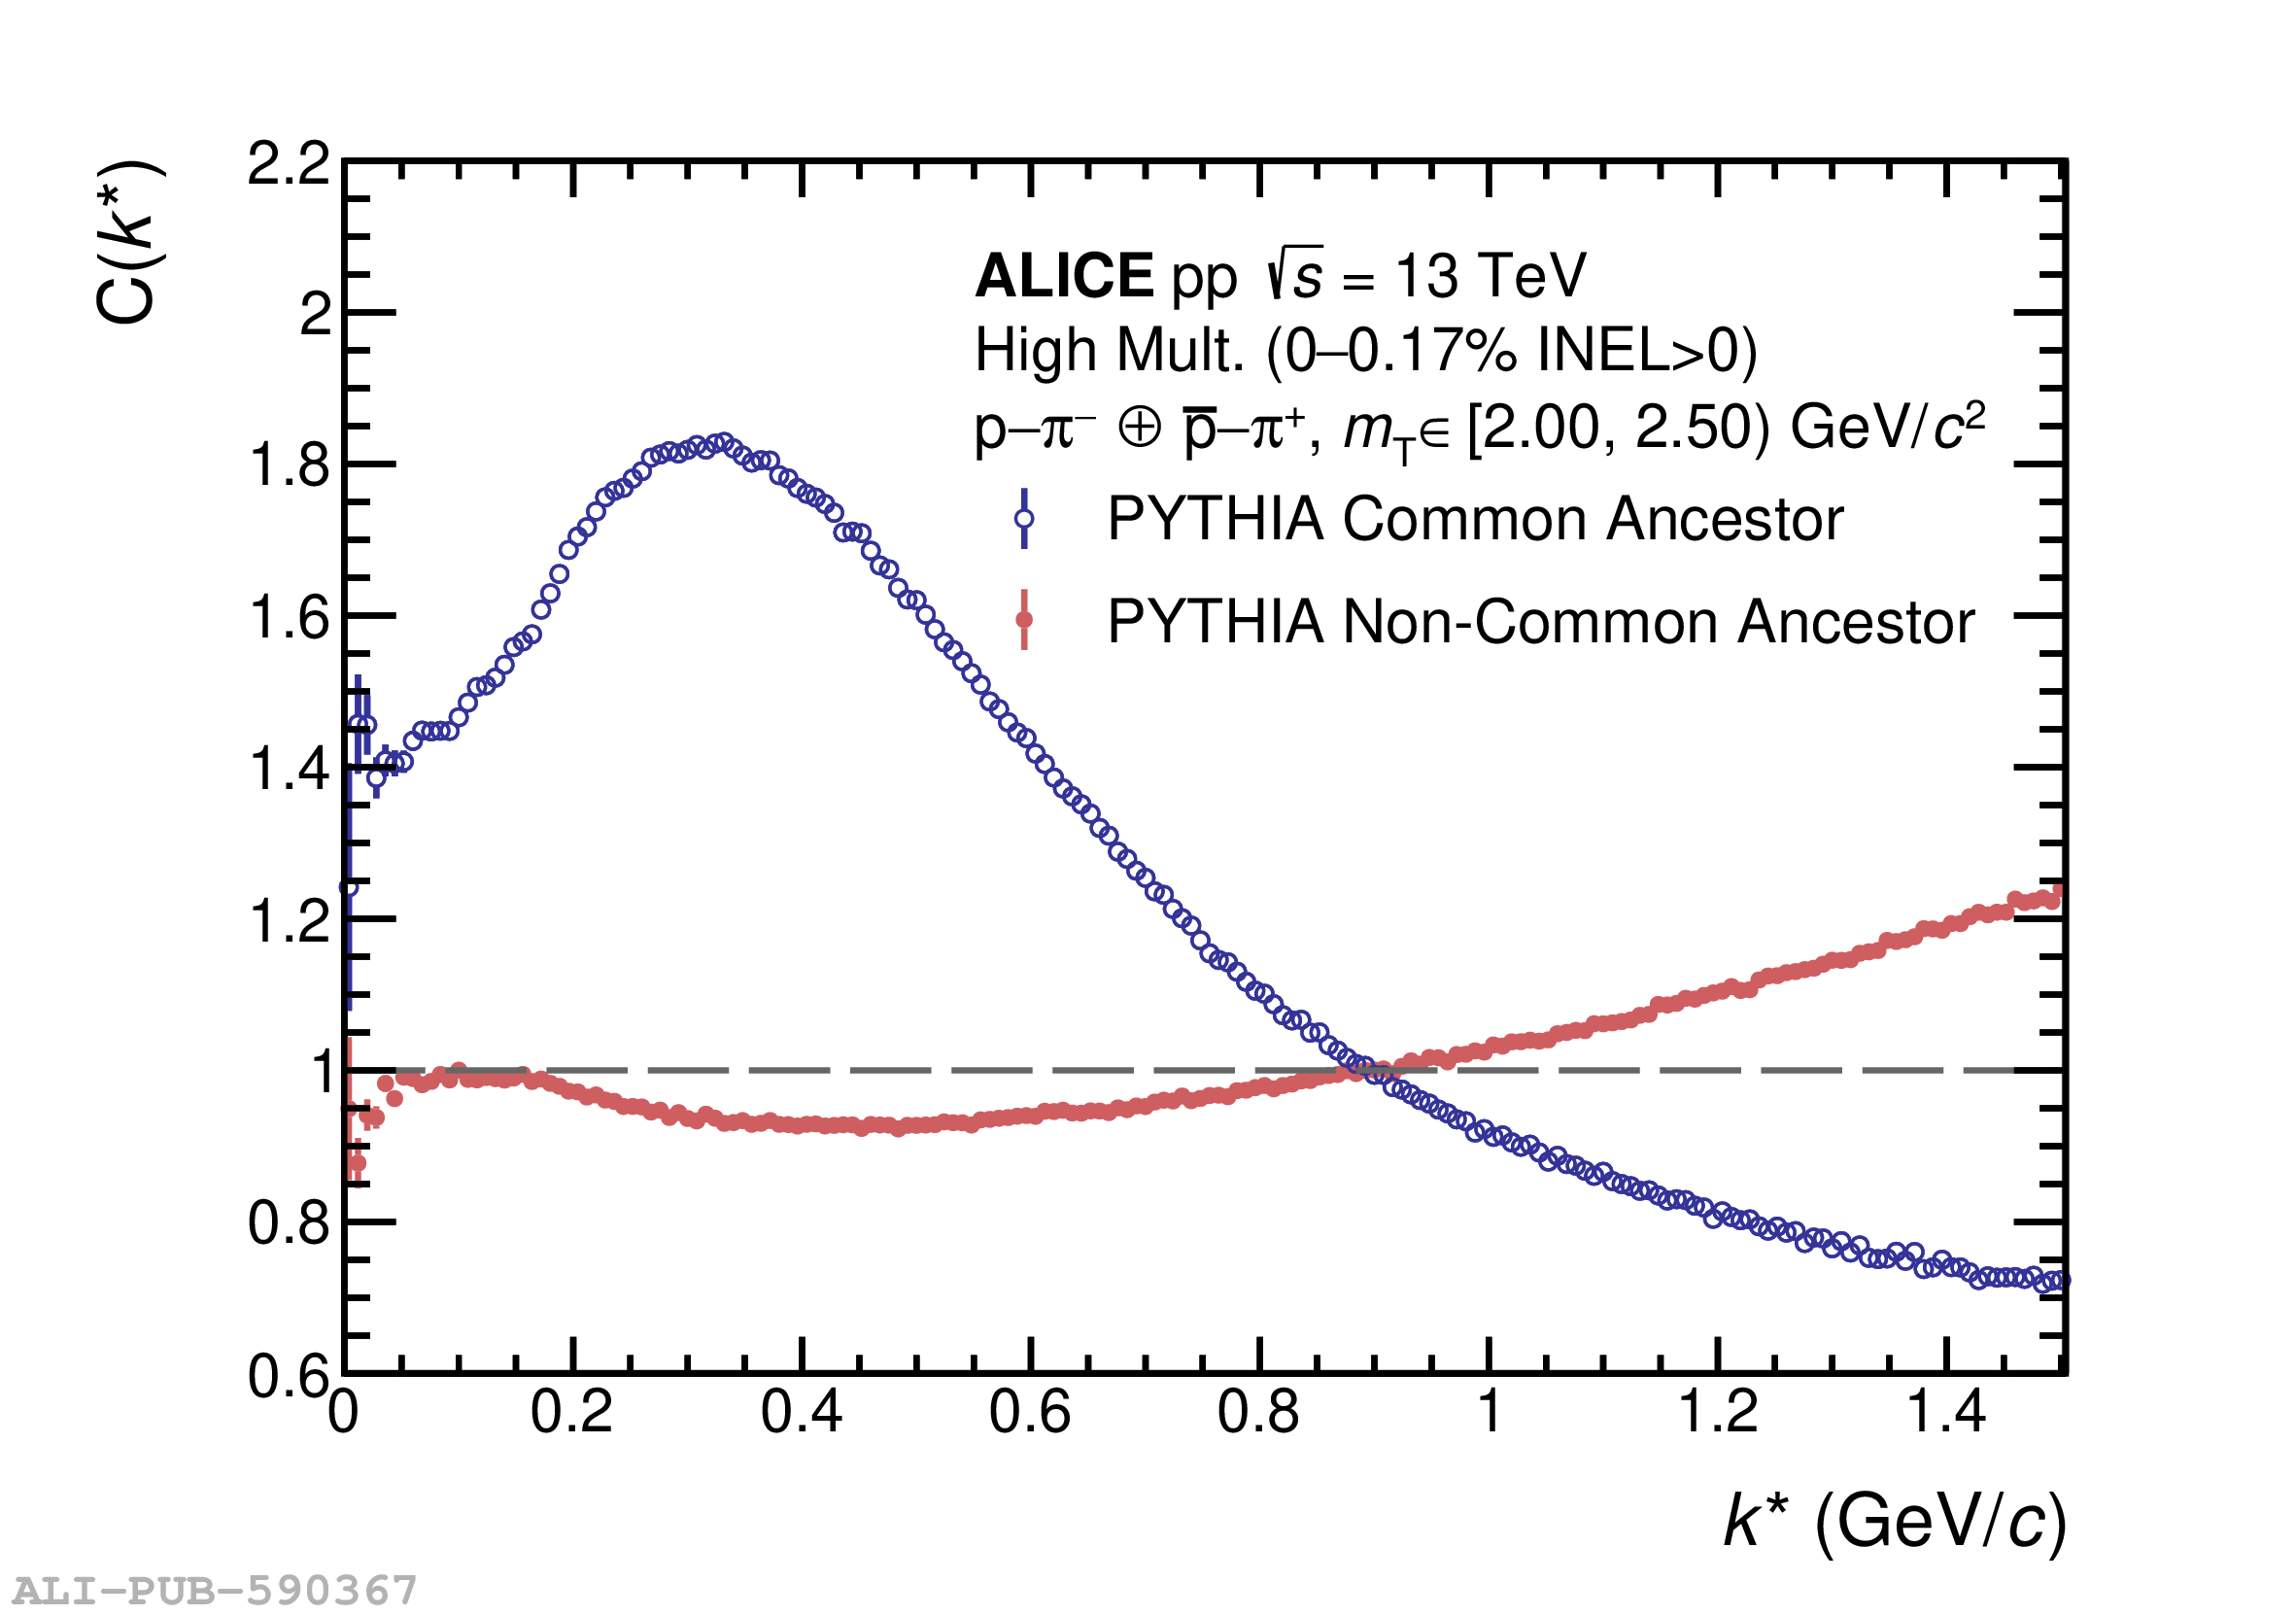 |